
Key Insights
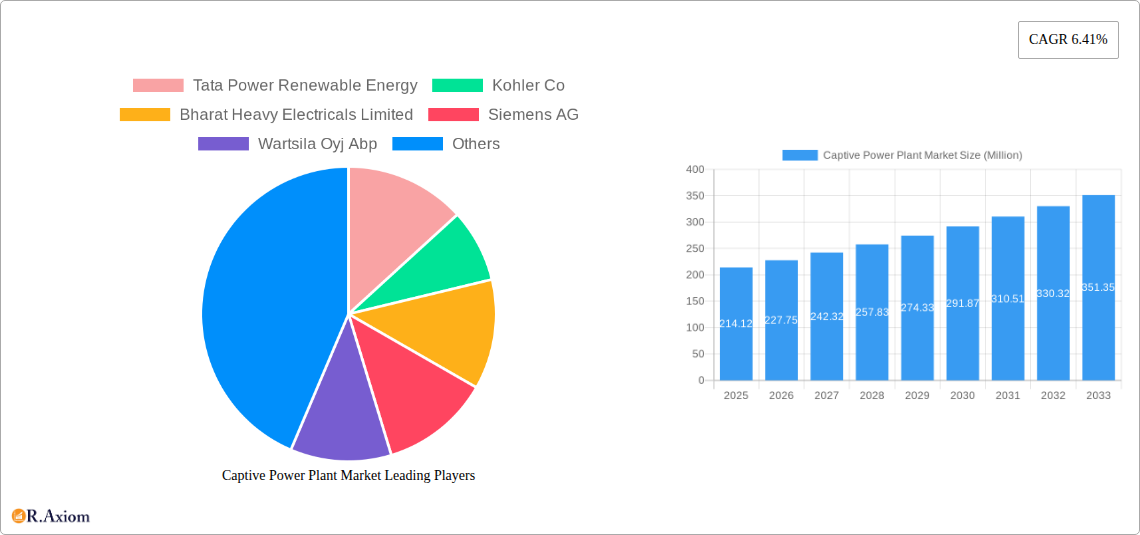
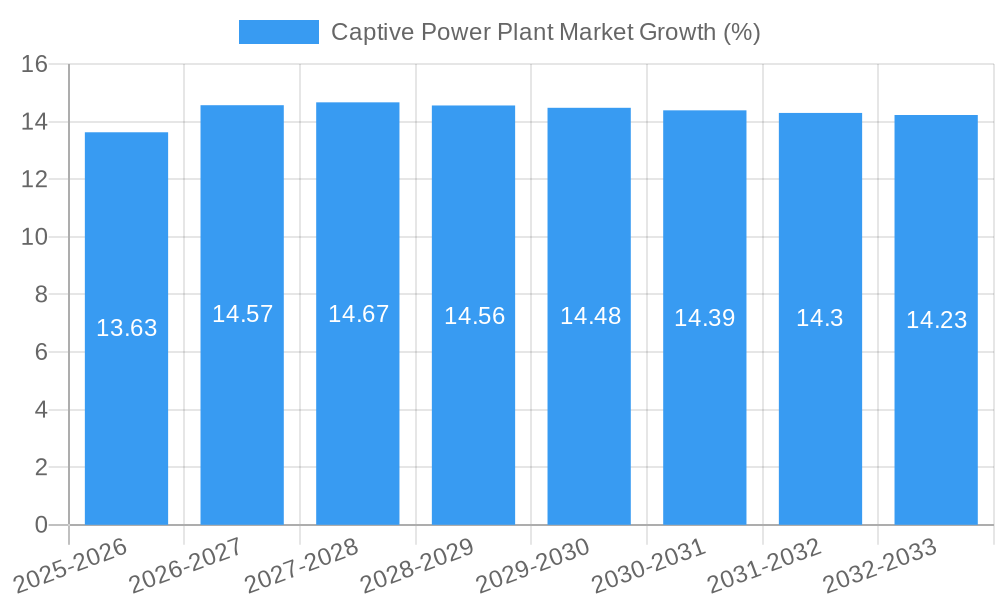
The Captive Power Plant market is experiencing robust growth, projected to reach $214.12 million in 2025 and maintain a Compound Annual Growth Rate (CAGR) of 6.41% from 2025 to 2033. This expansion is driven by several key factors. Increasing industrialization across regions like Asia-Pacific, particularly in rapidly developing economies like India and China, fuels a significant demand for reliable and cost-effective power solutions. The rising need for energy security and reduced reliance on volatile grid electricity also contribute to the market's growth. Furthermore, stringent environmental regulations are pushing industries to adopt cleaner fuel sources, creating opportunities for captive power plants utilizing renewable energy like solar and wind, alongside established sources such as coal and gas. Companies like Tata Power Renewable Energy, Kohler Co., and Siemens AG are at the forefront of innovation, developing advanced and efficient technologies to meet this growing demand. While regulatory hurdles and initial capital investment costs might present some challenges, the long-term benefits of stable power supply and cost control are driving strong adoption across various sectors, including cement, steel, metal & minerals, and petrochemicals.
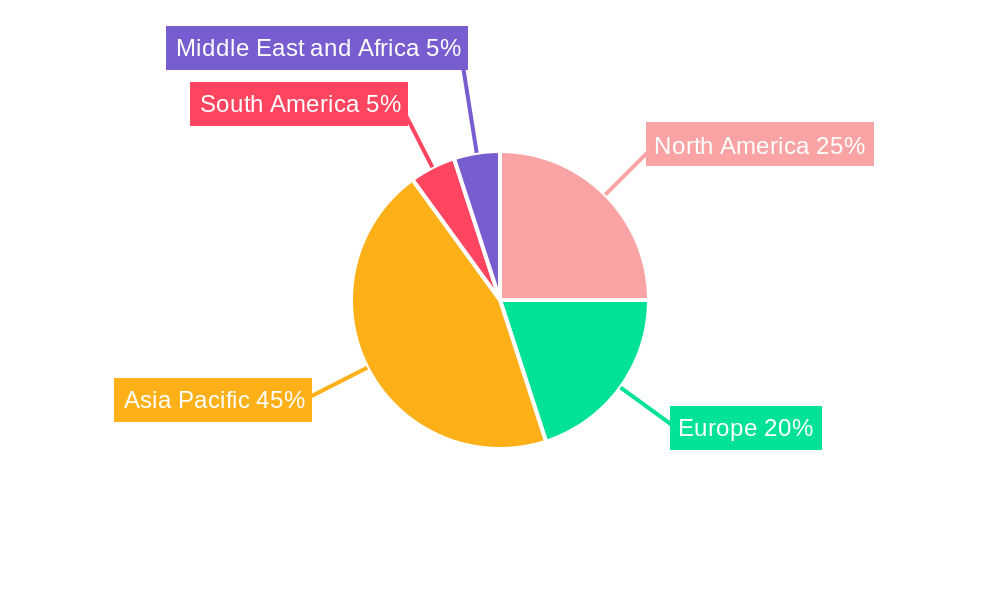
The market segmentation reveals diverse energy needs across industries. The cement, steel, and metal & minerals sectors are significant consumers of captive power, demanding robust and high-capacity solutions. The Petrochemicals sector necessitates reliable and consistent power supply for complex manufacturing processes. Fuel source diversification is another key trend, with a gradual shift toward renewable energy sources like solar and wind, driven by sustainability concerns and potential cost advantages in the long term. Regionally, the Asia-Pacific market is expected to dominate, driven by rapid industrialization and expanding energy needs. North America and Europe are also witnessing growth, though at a potentially slower pace compared to Asia-Pacific. The overall market outlook remains positive, underpinned by consistent industrial growth and a growing preference for dependable and environmentally responsible power solutions.
Captive Power Plant Market: A Comprehensive Report (2019-2033)
This in-depth report provides a comprehensive analysis of the Captive Power Plant market, offering invaluable insights for industry stakeholders, investors, and strategic decision-makers. The study covers the period from 2019 to 2033, with 2025 serving as the base year and estimated year. The report meticulously examines market size, growth drivers, challenges, opportunities, and key players, offering actionable intelligence for navigating this dynamic sector. The market is segmented by industry (Cement, Steel, Metal & Minerals, Petrochemicals, Others) and fuel source (Coal, Gas, Diesel, Renewable, Other Fuel Sources).
Captive Power Plant Market Concentration & Innovation
The Captive Power Plant market exhibits a moderately concentrated landscape, with a few major players holding significant market share. The market share of the top five players is estimated at xx% in 2025. Innovation is driven by the increasing demand for reliable and cost-effective power solutions, particularly in energy-intensive industries. Stringent environmental regulations are pushing the adoption of renewable energy sources, fostering innovation in hybrid and renewable-based captive power plants. The regulatory framework varies across regions, impacting market dynamics and investment decisions. Product substitutes, such as grid electricity, are readily available but often lack the reliability and cost-effectiveness of captive solutions for large industrial consumers. End-user trends show a growing preference for sustainable and energy-efficient solutions, while M&A activities are increasingly focused on expanding geographical reach and technological capabilities. Several significant M&A deals, totaling an estimated value of xx Million in the past five years, have reshaped the market landscape.
Captive Power Plant Market Industry Trends & Insights
The Captive Power Plant market is experiencing robust growth, driven by increasing industrialization and rising energy demands across various sectors. The market is projected to witness a CAGR of xx% during the forecast period (2025-2033). Technological disruptions, such as advancements in renewable energy technologies and energy storage solutions, are reshaping the market landscape. Consumer preferences are shifting towards sustainable and environmentally friendly solutions, leading to increased adoption of renewable energy-based captive power plants. Competitive dynamics are characterized by intense competition among established players and the emergence of new entrants focusing on specialized technologies or niche markets. Market penetration of renewable energy sources in captive power plants is gradually increasing, anticipated to reach xx% by 2033.
Dominant Markets & Segments in Captive Power Plant Market
The Steel, Metal & Minerals industry segment is currently the dominant market segment in the Captive Power Plant market, accounting for an estimated xx% of the total market share in 2025. This dominance is driven by the high energy consumption of these industries and the need for reliable and cost-effective power solutions.
- Key Drivers for Steel, Metal & Minerals Dominance:
- High energy intensity of production processes.
- Need for reliable power supply to maintain operational efficiency.
- Strategic investments by major players in captive power generation.
- Favorable government policies and incentives for industrial power generation.
The Renewable fuel source segment is experiencing significant growth, driven by the increasing focus on sustainability and environmental concerns. This segment is expected to experience the highest CAGR during the forecast period.
Captive Power Plant Market Product Developments
Significant product innovations are focused on improving efficiency, reducing emissions, and enhancing the reliability of captive power plants. Advancements in renewable energy technologies, such as solar and wind power, alongside improvements in energy storage solutions, are driving the development of more sustainable and cost-effective systems. These developments are improving the market fit of captive power plants by addressing environmental concerns and reducing operational costs. The integration of smart technologies and digitalization is also enhancing the efficiency and management of captive power plants.
Report Scope & Segmentation Analysis
The report provides a detailed analysis of the Captive Power Plant market segmented by industry and fuel source.
Industry Segmentation: Cement, Steel, Metal & Minerals, Petrochemicals, and Others. Each segment's growth projection, market size, and competitive landscape are thoroughly analyzed. The Steel, Metal & Minerals segment is projected to maintain its dominance, while the Others segment demonstrates significant growth potential.
Fuel Source Segmentation: Coal, Gas, Diesel, Renewable, and Other Fuel Sources. The renewable energy segment is expected to exhibit the highest growth rate during the forecast period, driven by environmental concerns and government incentives. However, traditional fuel sources like Gas and Coal are expected to retain significant market share, especially in regions with limited renewable energy infrastructure.
Key Drivers of Captive Power Plant Market Growth
Several factors contribute to the growth of the Captive Power Plant market: increasing industrialization and energy demand, stringent environmental regulations promoting renewable energy adoption, advancements in renewable energy technologies (solar, wind), and government support through subsidies and tax incentives. The need for reliable and uninterrupted power supply for critical operations, coupled with rising electricity costs from the grid, further drives the market's expansion.
Challenges in the Captive Power Plant Market Sector
The Captive Power Plant market faces challenges such as high upfront capital costs for installation, stringent environmental regulations, fluctuating fuel prices (especially for non-renewable sources), and potential grid integration complexities. Supply chain disruptions can impact project timelines and costs. Furthermore, competition from grid electricity providers and other decentralized power generation solutions presents a significant challenge. These factors can negatively impact the market’s overall growth trajectory and profitability for individual players.
Emerging Opportunities in Captive Power Plant Market
The Captive Power Plant market presents several promising opportunities: the growing adoption of hybrid power plants integrating renewable and conventional sources, the increasing demand for energy storage solutions to address intermittency issues with renewables, the expansion of captive power plants into emerging economies, and the integration of smart technologies to optimize plant operations and reduce costs. The development of innovative financing models and public-private partnerships can also unlock significant market potential.
Leading Players in the Captive Power Plant Market Market
- Tata Power Renewable Energy
- Kohler Co
- Bharat Heavy Electricals Limited
- Siemens AG
- Wartsila Oyj Abp
- AMP Solar Group Inc
- General Electric Company
Key Developments in Captive Power Plant Market Industry
September 2022: Tata Power Renewable Energy (TPREL) announced a collaboration with Viraj Profile to set up a 100 MW captive solar plant, signifying a significant move towards renewable energy adoption in the steel industry.
June 2022: Cipla Limited's expansion of its captive renewable energy plant showcases the growing trend of pharmaceutical companies adopting renewable energy sources for sustainable operations.
Strategic Outlook for Captive Power Plant Market Market
The Captive Power Plant market is poised for significant growth, driven by the increasing adoption of renewable energy sources, technological advancements, and supportive government policies. The market's future potential lies in the development of innovative and sustainable power solutions that address the evolving needs of energy-intensive industries. The focus on hybrid power plants, smart technologies, and optimized energy management systems will be key to realizing the full market potential in the coming years.
Captive Power Plant Market Segmentation
-
1. Fuel Source
- 1.1. Coal
- 1.2. Gas
- 1.3. Diesel
- 1.4. Renewable
- 1.5. Other Fuel Sources
-
2. Industry
- 2.1. Cement
- 2.2. Steel
- 2.3. Metal & Minerals
- 2.4. Petrochemicals
- 2.5. Others
Captive Power Plant Market Segmentation By Geography
-
1. North America
- 1.1. United States
- 1.2. Canada
- 1.3. Rest of North America
-
2. Europe
- 2.1. Germany
- 2.2. France
- 2.3. United Kingdom
- 2.4. Rest of Europe
-
3. Asia Pacific
- 3.1. China
- 3.2. India
- 3.3. Japan
- 3.4. South Korea
- 3.5. Rest of Asia Pacific
-
4. South America
- 4.1. Brazil
- 4.2. Argentina
- 4.3. Rest of South America
-
5. Middle East and Africa
- 5.1. Saudi Arabia
- 5.2. United Arab Emirates
- 5.3. South Africa
- 5.4. Rest of Middle East and Africa
Captive Power Plant Market REPORT HIGHLIGHTS
| Aspects | Details |
|---|---|
| Study Period | 2019-2033 |
| Base Year | 2024 |
| Estimated Year | 2025 |
| Forecast Period | 2025-2033 |
| Historical Period | 2019-2024 |
| Growth Rate | CAGR of 6.41% from 2019-2033 |
| Segmentation |
|
Table of Contents
- 1. Introduction
- 1.1. Research Scope
- 1.2. Market Segmentation
- 1.3. Research Methodology
- 1.4. Definitions and Assumptions
- 2. Executive Summary
- 2.1. Introduction
- 3. Market Dynamics
- 3.1. Introduction
- 3.2. Market Drivers
- 3.2.1. Increasing Power Demand across Industrial Sector4.; Remote Location of Several Industries and the Unreliability of the Power Supply
- 3.3. Market Restrains
- 3.3.1. High Capital and Operational Expenditures
- 3.4. Market Trends
- 3.4.1. Steel Industry to Have Significant Share in the Market
- 4. Market Factor Analysis
- 4.1. Porters Five Forces
- 4.2. Supply/Value Chain
- 4.3. PESTEL analysis
- 4.4. Market Entropy
- 4.5. Patent/Trademark Analysis
- 5. Global Captive Power Plant Market Analysis, Insights and Forecast, 2019-2031
- 5.1. Market Analysis, Insights and Forecast - by Fuel Source
- 5.1.1. Coal
- 5.1.2. Gas
- 5.1.3. Diesel
- 5.1.4. Renewable
- 5.1.5. Other Fuel Sources
- 5.2. Market Analysis, Insights and Forecast - by Industry
- 5.2.1. Cement
- 5.2.2. Steel
- 5.2.3. Metal & Minerals
- 5.2.4. Petrochemicals
- 5.2.5. Others
- 5.3. Market Analysis, Insights and Forecast - by Region
- 5.3.1. North America
- 5.3.2. Europe
- 5.3.3. Asia Pacific
- 5.3.4. South America
- 5.3.5. Middle East and Africa
- 5.1. Market Analysis, Insights and Forecast - by Fuel Source
- 6. North America Captive Power Plant Market Analysis, Insights and Forecast, 2019-2031
- 6.1. Market Analysis, Insights and Forecast - by Fuel Source
- 6.1.1. Coal
- 6.1.2. Gas
- 6.1.3. Diesel
- 6.1.4. Renewable
- 6.1.5. Other Fuel Sources
- 6.2. Market Analysis, Insights and Forecast - by Industry
- 6.2.1. Cement
- 6.2.2. Steel
- 6.2.3. Metal & Minerals
- 6.2.4. Petrochemicals
- 6.2.5. Others
- 6.1. Market Analysis, Insights and Forecast - by Fuel Source
- 7. Europe Captive Power Plant Market Analysis, Insights and Forecast, 2019-2031
- 7.1. Market Analysis, Insights and Forecast - by Fuel Source
- 7.1.1. Coal
- 7.1.2. Gas
- 7.1.3. Diesel
- 7.1.4. Renewable
- 7.1.5. Other Fuel Sources
- 7.2. Market Analysis, Insights and Forecast - by Industry
- 7.2.1. Cement
- 7.2.2. Steel
- 7.2.3. Metal & Minerals
- 7.2.4. Petrochemicals
- 7.2.5. Others
- 7.1. Market Analysis, Insights and Forecast - by Fuel Source
- 8. Asia Pacific Captive Power Plant Market Analysis, Insights and Forecast, 2019-2031
- 8.1. Market Analysis, Insights and Forecast - by Fuel Source
- 8.1.1. Coal
- 8.1.2. Gas
- 8.1.3. Diesel
- 8.1.4. Renewable
- 8.1.5. Other Fuel Sources
- 8.2. Market Analysis, Insights and Forecast - by Industry
- 8.2.1. Cement
- 8.2.2. Steel
- 8.2.3. Metal & Minerals
- 8.2.4. Petrochemicals
- 8.2.5. Others
- 8.1. Market Analysis, Insights and Forecast - by Fuel Source
- 9. South America Captive Power Plant Market Analysis, Insights and Forecast, 2019-2031
- 9.1. Market Analysis, Insights and Forecast - by Fuel Source
- 9.1.1. Coal
- 9.1.2. Gas
- 9.1.3. Diesel
- 9.1.4. Renewable
- 9.1.5. Other Fuel Sources
- 9.2. Market Analysis, Insights and Forecast - by Industry
- 9.2.1. Cement
- 9.2.2. Steel
- 9.2.3. Metal & Minerals
- 9.2.4. Petrochemicals
- 9.2.5. Others
- 9.1. Market Analysis, Insights and Forecast - by Fuel Source
- 10. Middle East and Africa Captive Power Plant Market Analysis, Insights and Forecast, 2019-2031
- 10.1. Market Analysis, Insights and Forecast - by Fuel Source
- 10.1.1. Coal
- 10.1.2. Gas
- 10.1.3. Diesel
- 10.1.4. Renewable
- 10.1.5. Other Fuel Sources
- 10.2. Market Analysis, Insights and Forecast - by Industry
- 10.2.1. Cement
- 10.2.2. Steel
- 10.2.3. Metal & Minerals
- 10.2.4. Petrochemicals
- 10.2.5. Others
- 10.1. Market Analysis, Insights and Forecast - by Fuel Source
- 11. North America Captive Power Plant Market Analysis, Insights and Forecast, 2019-2031
- 11.1. Market Analysis, Insights and Forecast - By Country/Sub-region
- 11.1.1 United States
- 11.1.2 Canada
- 11.1.3 Rest of North America
- 12. Europe Captive Power Plant Market Analysis, Insights and Forecast, 2019-2031
- 12.1. Market Analysis, Insights and Forecast - By Country/Sub-region
- 12.1.1 Germany
- 12.1.2 France
- 12.1.3 United Kingdom
- 12.1.4 Rest of Europe
- 13. Asia Pacific Captive Power Plant Market Analysis, Insights and Forecast, 2019-2031
- 13.1. Market Analysis, Insights and Forecast - By Country/Sub-region
- 13.1.1 China
- 13.1.2 India
- 13.1.3 Japan
- 13.1.4 South Korea
- 13.1.5 Rest of Asia Pacific
- 14. South America Captive Power Plant Market Analysis, Insights and Forecast, 2019-2031
- 14.1. Market Analysis, Insights and Forecast - By Country/Sub-region
- 14.1.1 Brazil
- 14.1.2 Argentina
- 14.1.3 Rest of South America
- 15. Middle East and Africa Captive Power Plant Market Analysis, Insights and Forecast, 2019-2031
- 15.1. Market Analysis, Insights and Forecast - By Country/Sub-region
- 15.1.1 Saudi Arabia
- 15.1.2 United Arab Emirates
- 15.1.3 South Africa
- 15.1.4 Rest of Middle East and Africa
- 16. Competitive Analysis
- 16.1. Global Market Share Analysis 2024
- 16.2. Company Profiles
- 16.2.1 Tata Power Renewable Energy
- 16.2.1.1. Overview
- 16.2.1.2. Products
- 16.2.1.3. SWOT Analysis
- 16.2.1.4. Recent Developments
- 16.2.1.5. Financials (Based on Availability)
- 16.2.2 Kohler Co
- 16.2.2.1. Overview
- 16.2.2.2. Products
- 16.2.2.3. SWOT Analysis
- 16.2.2.4. Recent Developments
- 16.2.2.5. Financials (Based on Availability)
- 16.2.3 Bharat Heavy Electricals Limited
- 16.2.3.1. Overview
- 16.2.3.2. Products
- 16.2.3.3. SWOT Analysis
- 16.2.3.4. Recent Developments
- 16.2.3.5. Financials (Based on Availability)
- 16.2.4 Siemens AG
- 16.2.4.1. Overview
- 16.2.4.2. Products
- 16.2.4.3. SWOT Analysis
- 16.2.4.4. Recent Developments
- 16.2.4.5. Financials (Based on Availability)
- 16.2.5 Wartsila Oyj Abp
- 16.2.5.1. Overview
- 16.2.5.2. Products
- 16.2.5.3. SWOT Analysis
- 16.2.5.4. Recent Developments
- 16.2.5.5. Financials (Based on Availability)
- 16.2.6 AMP Solar Group Inc
- 16.2.6.1. Overview
- 16.2.6.2. Products
- 16.2.6.3. SWOT Analysis
- 16.2.6.4. Recent Developments
- 16.2.6.5. Financials (Based on Availability)
- 16.2.7 General Electric Company
- 16.2.7.1. Overview
- 16.2.7.2. Products
- 16.2.7.3. SWOT Analysis
- 16.2.7.4. Recent Developments
- 16.2.7.5. Financials (Based on Availability)
- 16.2.1 Tata Power Renewable Energy
List of Figures
- Figure 1: Global Captive Power Plant Market Revenue Breakdown (Million, %) by Region 2024 & 2032
- Figure 2: Global Captive Power Plant Market Volume Breakdown (K Unit, %) by Region 2024 & 2032
- Figure 3: North America Captive Power Plant Market Revenue (Million), by Country 2024 & 2032
- Figure 4: North America Captive Power Plant Market Volume (K Unit), by Country 2024 & 2032
- Figure 5: North America Captive Power Plant Market Revenue Share (%), by Country 2024 & 2032
- Figure 6: North America Captive Power Plant Market Volume Share (%), by Country 2024 & 2032
- Figure 7: Europe Captive Power Plant Market Revenue (Million), by Country 2024 & 2032
- Figure 8: Europe Captive Power Plant Market Volume (K Unit), by Country 2024 & 2032
- Figure 9: Europe Captive Power Plant Market Revenue Share (%), by Country 2024 & 2032
- Figure 10: Europe Captive Power Plant Market Volume Share (%), by Country 2024 & 2032
- Figure 11: Asia Pacific Captive Power Plant Market Revenue (Million), by Country 2024 & 2032
- Figure 12: Asia Pacific Captive Power Plant Market Volume (K Unit), by Country 2024 & 2032
- Figure 13: Asia Pacific Captive Power Plant Market Revenue Share (%), by Country 2024 & 2032
- Figure 14: Asia Pacific Captive Power Plant Market Volume Share (%), by Country 2024 & 2032
- Figure 15: South America Captive Power Plant Market Revenue (Million), by Country 2024 & 2032
- Figure 16: South America Captive Power Plant Market Volume (K Unit), by Country 2024 & 2032
- Figure 17: South America Captive Power Plant Market Revenue Share (%), by Country 2024 & 2032
- Figure 18: South America Captive Power Plant Market Volume Share (%), by Country 2024 & 2032
- Figure 19: Middle East and Africa Captive Power Plant Market Revenue (Million), by Country 2024 & 2032
- Figure 20: Middle East and Africa Captive Power Plant Market Volume (K Unit), by Country 2024 & 2032
- Figure 21: Middle East and Africa Captive Power Plant Market Revenue Share (%), by Country 2024 & 2032
- Figure 22: Middle East and Africa Captive Power Plant Market Volume Share (%), by Country 2024 & 2032
- Figure 23: North America Captive Power Plant Market Revenue (Million), by Fuel Source 2024 & 2032
- Figure 24: North America Captive Power Plant Market Volume (K Unit), by Fuel Source 2024 & 2032
- Figure 25: North America Captive Power Plant Market Revenue Share (%), by Fuel Source 2024 & 2032
- Figure 26: North America Captive Power Plant Market Volume Share (%), by Fuel Source 2024 & 2032
- Figure 27: North America Captive Power Plant Market Revenue (Million), by Industry 2024 & 2032
- Figure 28: North America Captive Power Plant Market Volume (K Unit), by Industry 2024 & 2032
- Figure 29: North America Captive Power Plant Market Revenue Share (%), by Industry 2024 & 2032
- Figure 30: North America Captive Power Plant Market Volume Share (%), by Industry 2024 & 2032
- Figure 31: North America Captive Power Plant Market Revenue (Million), by Country 2024 & 2032
- Figure 32: North America Captive Power Plant Market Volume (K Unit), by Country 2024 & 2032
- Figure 33: North America Captive Power Plant Market Revenue Share (%), by Country 2024 & 2032
- Figure 34: North America Captive Power Plant Market Volume Share (%), by Country 2024 & 2032
- Figure 35: Europe Captive Power Plant Market Revenue (Million), by Fuel Source 2024 & 2032
- Figure 36: Europe Captive Power Plant Market Volume (K Unit), by Fuel Source 2024 & 2032
- Figure 37: Europe Captive Power Plant Market Revenue Share (%), by Fuel Source 2024 & 2032
- Figure 38: Europe Captive Power Plant Market Volume Share (%), by Fuel Source 2024 & 2032
- Figure 39: Europe Captive Power Plant Market Revenue (Million), by Industry 2024 & 2032
- Figure 40: Europe Captive Power Plant Market Volume (K Unit), by Industry 2024 & 2032
- Figure 41: Europe Captive Power Plant Market Revenue Share (%), by Industry 2024 & 2032
- Figure 42: Europe Captive Power Plant Market Volume Share (%), by Industry 2024 & 2032
- Figure 43: Europe Captive Power Plant Market Revenue (Million), by Country 2024 & 2032
- Figure 44: Europe Captive Power Plant Market Volume (K Unit), by Country 2024 & 2032
- Figure 45: Europe Captive Power Plant Market Revenue Share (%), by Country 2024 & 2032
- Figure 46: Europe Captive Power Plant Market Volume Share (%), by Country 2024 & 2032
- Figure 47: Asia Pacific Captive Power Plant Market Revenue (Million), by Fuel Source 2024 & 2032
- Figure 48: Asia Pacific Captive Power Plant Market Volume (K Unit), by Fuel Source 2024 & 2032
- Figure 49: Asia Pacific Captive Power Plant Market Revenue Share (%), by Fuel Source 2024 & 2032
- Figure 50: Asia Pacific Captive Power Plant Market Volume Share (%), by Fuel Source 2024 & 2032
- Figure 51: Asia Pacific Captive Power Plant Market Revenue (Million), by Industry 2024 & 2032
- Figure 52: Asia Pacific Captive Power Plant Market Volume (K Unit), by Industry 2024 & 2032
- Figure 53: Asia Pacific Captive Power Plant Market Revenue Share (%), by Industry 2024 & 2032
- Figure 54: Asia Pacific Captive Power Plant Market Volume Share (%), by Industry 2024 & 2032
- Figure 55: Asia Pacific Captive Power Plant Market Revenue (Million), by Country 2024 & 2032
- Figure 56: Asia Pacific Captive Power Plant Market Volume (K Unit), by Country 2024 & 2032
- Figure 57: Asia Pacific Captive Power Plant Market Revenue Share (%), by Country 2024 & 2032
- Figure 58: Asia Pacific Captive Power Plant Market Volume Share (%), by Country 2024 & 2032
- Figure 59: South America Captive Power Plant Market Revenue (Million), by Fuel Source 2024 & 2032
- Figure 60: South America Captive Power Plant Market Volume (K Unit), by Fuel Source 2024 & 2032
- Figure 61: South America Captive Power Plant Market Revenue Share (%), by Fuel Source 2024 & 2032
- Figure 62: South America Captive Power Plant Market Volume Share (%), by Fuel Source 2024 & 2032
- Figure 63: South America Captive Power Plant Market Revenue (Million), by Industry 2024 & 2032
- Figure 64: South America Captive Power Plant Market Volume (K Unit), by Industry 2024 & 2032
- Figure 65: South America Captive Power Plant Market Revenue Share (%), by Industry 2024 & 2032
- Figure 66: South America Captive Power Plant Market Volume Share (%), by Industry 2024 & 2032
- Figure 67: South America Captive Power Plant Market Revenue (Million), by Country 2024 & 2032
- Figure 68: South America Captive Power Plant Market Volume (K Unit), by Country 2024 & 2032
- Figure 69: South America Captive Power Plant Market Revenue Share (%), by Country 2024 & 2032
- Figure 70: South America Captive Power Plant Market Volume Share (%), by Country 2024 & 2032
- Figure 71: Middle East and Africa Captive Power Plant Market Revenue (Million), by Fuel Source 2024 & 2032
- Figure 72: Middle East and Africa Captive Power Plant Market Volume (K Unit), by Fuel Source 2024 & 2032
- Figure 73: Middle East and Africa Captive Power Plant Market Revenue Share (%), by Fuel Source 2024 & 2032
- Figure 74: Middle East and Africa Captive Power Plant Market Volume Share (%), by Fuel Source 2024 & 2032
- Figure 75: Middle East and Africa Captive Power Plant Market Revenue (Million), by Industry 2024 & 2032
- Figure 76: Middle East and Africa Captive Power Plant Market Volume (K Unit), by Industry 2024 & 2032
- Figure 77: Middle East and Africa Captive Power Plant Market Revenue Share (%), by Industry 2024 & 2032
- Figure 78: Middle East and Africa Captive Power Plant Market Volume Share (%), by Industry 2024 & 2032
- Figure 79: Middle East and Africa Captive Power Plant Market Revenue (Million), by Country 2024 & 2032
- Figure 80: Middle East and Africa Captive Power Plant Market Volume (K Unit), by Country 2024 & 2032
- Figure 81: Middle East and Africa Captive Power Plant Market Revenue Share (%), by Country 2024 & 2032
- Figure 82: Middle East and Africa Captive Power Plant Market Volume Share (%), by Country 2024 & 2032
List of Tables
- Table 1: Global Captive Power Plant Market Revenue Million Forecast, by Region 2019 & 2032
- Table 2: Global Captive Power Plant Market Volume K Unit Forecast, by Region 2019 & 2032
- Table 3: Global Captive Power Plant Market Revenue Million Forecast, by Fuel Source 2019 & 2032
- Table 4: Global Captive Power Plant Market Volume K Unit Forecast, by Fuel Source 2019 & 2032
- Table 5: Global Captive Power Plant Market Revenue Million Forecast, by Industry 2019 & 2032
- Table 6: Global Captive Power Plant Market Volume K Unit Forecast, by Industry 2019 & 2032
- Table 7: Global Captive Power Plant Market Revenue Million Forecast, by Region 2019 & 2032
- Table 8: Global Captive Power Plant Market Volume K Unit Forecast, by Region 2019 & 2032
- Table 9: Global Captive Power Plant Market Revenue Million Forecast, by Country 2019 & 2032
- Table 10: Global Captive Power Plant Market Volume K Unit Forecast, by Country 2019 & 2032
- Table 11: United States Captive Power Plant Market Revenue (Million) Forecast, by Application 2019 & 2032
- Table 12: United States Captive Power Plant Market Volume (K Unit) Forecast, by Application 2019 & 2032
- Table 13: Canada Captive Power Plant Market Revenue (Million) Forecast, by Application 2019 & 2032
- Table 14: Canada Captive Power Plant Market Volume (K Unit) Forecast, by Application 2019 & 2032
- Table 15: Rest of North America Captive Power Plant Market Revenue (Million) Forecast, by Application 2019 & 2032
- Table 16: Rest of North America Captive Power Plant Market Volume (K Unit) Forecast, by Application 2019 & 2032
- Table 17: Global Captive Power Plant Market Revenue Million Forecast, by Country 2019 & 2032
- Table 18: Global Captive Power Plant Market Volume K Unit Forecast, by Country 2019 & 2032
- Table 19: Germany Captive Power Plant Market Revenue (Million) Forecast, by Application 2019 & 2032
- Table 20: Germany Captive Power Plant Market Volume (K Unit) Forecast, by Application 2019 & 2032
- Table 21: France Captive Power Plant Market Revenue (Million) Forecast, by Application 2019 & 2032
- Table 22: France Captive Power Plant Market Volume (K Unit) Forecast, by Application 2019 & 2032
- Table 23: United Kingdom Captive Power Plant Market Revenue (Million) Forecast, by Application 2019 & 2032
- Table 24: United Kingdom Captive Power Plant Market Volume (K Unit) Forecast, by Application 2019 & 2032
- Table 25: Rest of Europe Captive Power Plant Market Revenue (Million) Forecast, by Application 2019 & 2032
- Table 26: Rest of Europe Captive Power Plant Market Volume (K Unit) Forecast, by Application 2019 & 2032
- Table 27: Global Captive Power Plant Market Revenue Million Forecast, by Country 2019 & 2032
- Table 28: Global Captive Power Plant Market Volume K Unit Forecast, by Country 2019 & 2032
- Table 29: China Captive Power Plant Market Revenue (Million) Forecast, by Application 2019 & 2032
- Table 30: China Captive Power Plant Market Volume (K Unit) Forecast, by Application 2019 & 2032
- Table 31: India Captive Power Plant Market Revenue (Million) Forecast, by Application 2019 & 2032
- Table 32: India Captive Power Plant Market Volume (K Unit) Forecast, by Application 2019 & 2032
- Table 33: Japan Captive Power Plant Market Revenue (Million) Forecast, by Application 2019 & 2032
- Table 34: Japan Captive Power Plant Market Volume (K Unit) Forecast, by Application 2019 & 2032
- Table 35: South Korea Captive Power Plant Market Revenue (Million) Forecast, by Application 2019 & 2032
- Table 36: South Korea Captive Power Plant Market Volume (K Unit) Forecast, by Application 2019 & 2032
- Table 37: Rest of Asia Pacific Captive Power Plant Market Revenue (Million) Forecast, by Application 2019 & 2032
- Table 38: Rest of Asia Pacific Captive Power Plant Market Volume (K Unit) Forecast, by Application 2019 & 2032
- Table 39: Global Captive Power Plant Market Revenue Million Forecast, by Country 2019 & 2032
- Table 40: Global Captive Power Plant Market Volume K Unit Forecast, by Country 2019 & 2032
- Table 41: Brazil Captive Power Plant Market Revenue (Million) Forecast, by Application 2019 & 2032
- Table 42: Brazil Captive Power Plant Market Volume (K Unit) Forecast, by Application 2019 & 2032
- Table 43: Argentina Captive Power Plant Market Revenue (Million) Forecast, by Application 2019 & 2032
- Table 44: Argentina Captive Power Plant Market Volume (K Unit) Forecast, by Application 2019 & 2032
- Table 45: Rest of South America Captive Power Plant Market Revenue (Million) Forecast, by Application 2019 & 2032
- Table 46: Rest of South America Captive Power Plant Market Volume (K Unit) Forecast, by Application 2019 & 2032
- Table 47: Global Captive Power Plant Market Revenue Million Forecast, by Country 2019 & 2032
- Table 48: Global Captive Power Plant Market Volume K Unit Forecast, by Country 2019 & 2032
- Table 49: Saudi Arabia Captive Power Plant Market Revenue (Million) Forecast, by Application 2019 & 2032
- Table 50: Saudi Arabia Captive Power Plant Market Volume (K Unit) Forecast, by Application 2019 & 2032
- Table 51: United Arab Emirates Captive Power Plant Market Revenue (Million) Forecast, by Application 2019 & 2032
- Table 52: United Arab Emirates Captive Power Plant Market Volume (K Unit) Forecast, by Application 2019 & 2032
- Table 53: South Africa Captive Power Plant Market Revenue (Million) Forecast, by Application 2019 & 2032
- Table 54: South Africa Captive Power Plant Market Volume (K Unit) Forecast, by Application 2019 & 2032
- Table 55: Rest of Middle East and Africa Captive Power Plant Market Revenue (Million) Forecast, by Application 2019 & 2032
- Table 56: Rest of Middle East and Africa Captive Power Plant Market Volume (K Unit) Forecast, by Application 2019 & 2032
- Table 57: Global Captive Power Plant Market Revenue Million Forecast, by Fuel Source 2019 & 2032
- Table 58: Global Captive Power Plant Market Volume K Unit Forecast, by Fuel Source 2019 & 2032
- Table 59: Global Captive Power Plant Market Revenue Million Forecast, by Industry 2019 & 2032
- Table 60: Global Captive Power Plant Market Volume K Unit Forecast, by Industry 2019 & 2032
- Table 61: Global Captive Power Plant Market Revenue Million Forecast, by Country 2019 & 2032
- Table 62: Global Captive Power Plant Market Volume K Unit Forecast, by Country 2019 & 2032
- Table 63: United States Captive Power Plant Market Revenue (Million) Forecast, by Application 2019 & 2032
- Table 64: United States Captive Power Plant Market Volume (K Unit) Forecast, by Application 2019 & 2032
- Table 65: Canada Captive Power Plant Market Revenue (Million) Forecast, by Application 2019 & 2032
- Table 66: Canada Captive Power Plant Market Volume (K Unit) Forecast, by Application 2019 & 2032
- Table 67: Rest of North America Captive Power Plant Market Revenue (Million) Forecast, by Application 2019 & 2032
- Table 68: Rest of North America Captive Power Plant Market Volume (K Unit) Forecast, by Application 2019 & 2032
- Table 69: Global Captive Power Plant Market Revenue Million Forecast, by Fuel Source 2019 & 2032
- Table 70: Global Captive Power Plant Market Volume K Unit Forecast, by Fuel Source 2019 & 2032
- Table 71: Global Captive Power Plant Market Revenue Million Forecast, by Industry 2019 & 2032
- Table 72: Global Captive Power Plant Market Volume K Unit Forecast, by Industry 2019 & 2032
- Table 73: Global Captive Power Plant Market Revenue Million Forecast, by Country 2019 & 2032
- Table 74: Global Captive Power Plant Market Volume K Unit Forecast, by Country 2019 & 2032
- Table 75: Germany Captive Power Plant Market Revenue (Million) Forecast, by Application 2019 & 2032
- Table 76: Germany Captive Power Plant Market Volume (K Unit) Forecast, by Application 2019 & 2032
- Table 77: France Captive Power Plant Market Revenue (Million) Forecast, by Application 2019 & 2032
- Table 78: France Captive Power Plant Market Volume (K Unit) Forecast, by Application 2019 & 2032
- Table 79: United Kingdom Captive Power Plant Market Revenue (Million) Forecast, by Application 2019 & 2032
- Table 80: United Kingdom Captive Power Plant Market Volume (K Unit) Forecast, by Application 2019 & 2032
- Table 81: Rest of Europe Captive Power Plant Market Revenue (Million) Forecast, by Application 2019 & 2032
- Table 82: Rest of Europe Captive Power Plant Market Volume (K Unit) Forecast, by Application 2019 & 2032
- Table 83: Global Captive Power Plant Market Revenue Million Forecast, by Fuel Source 2019 & 2032
- Table 84: Global Captive Power Plant Market Volume K Unit Forecast, by Fuel Source 2019 & 2032
- Table 85: Global Captive Power Plant Market Revenue Million Forecast, by Industry 2019 & 2032
- Table 86: Global Captive Power Plant Market Volume K Unit Forecast, by Industry 2019 & 2032
- Table 87: Global Captive Power Plant Market Revenue Million Forecast, by Country 2019 & 2032
- Table 88: Global Captive Power Plant Market Volume K Unit Forecast, by Country 2019 & 2032
- Table 89: China Captive Power Plant Market Revenue (Million) Forecast, by Application 2019 & 2032
- Table 90: China Captive Power Plant Market Volume (K Unit) Forecast, by Application 2019 & 2032
- Table 91: India Captive Power Plant Market Revenue (Million) Forecast, by Application 2019 & 2032
- Table 92: India Captive Power Plant Market Volume (K Unit) Forecast, by Application 2019 & 2032
- Table 93: Japan Captive Power Plant Market Revenue (Million) Forecast, by Application 2019 & 2032
- Table 94: Japan Captive Power Plant Market Volume (K Unit) Forecast, by Application 2019 & 2032
- Table 95: South Korea Captive Power Plant Market Revenue (Million) Forecast, by Application 2019 & 2032
- Table 96: South Korea Captive Power Plant Market Volume (K Unit) Forecast, by Application 2019 & 2032
- Table 97: Rest of Asia Pacific Captive Power Plant Market Revenue (Million) Forecast, by Application 2019 & 2032
- Table 98: Rest of Asia Pacific Captive Power Plant Market Volume (K Unit) Forecast, by Application 2019 & 2032
- Table 99: Global Captive Power Plant Market Revenue Million Forecast, by Fuel Source 2019 & 2032
- Table 100: Global Captive Power Plant Market Volume K Unit Forecast, by Fuel Source 2019 & 2032
- Table 101: Global Captive Power Plant Market Revenue Million Forecast, by Industry 2019 & 2032
- Table 102: Global Captive Power Plant Market Volume K Unit Forecast, by Industry 2019 & 2032
- Table 103: Global Captive Power Plant Market Revenue Million Forecast, by Country 2019 & 2032
- Table 104: Global Captive Power Plant Market Volume K Unit Forecast, by Country 2019 & 2032
- Table 105: Brazil Captive Power Plant Market Revenue (Million) Forecast, by Application 2019 & 2032
- Table 106: Brazil Captive Power Plant Market Volume (K Unit) Forecast, by Application 2019 & 2032
- Table 107: Argentina Captive Power Plant Market Revenue (Million) Forecast, by Application 2019 & 2032
- Table 108: Argentina Captive Power Plant Market Volume (K Unit) Forecast, by Application 2019 & 2032
- Table 109: Rest of South America Captive Power Plant Market Revenue (Million) Forecast, by Application 2019 & 2032
- Table 110: Rest of South America Captive Power Plant Market Volume (K Unit) Forecast, by Application 2019 & 2032
- Table 111: Global Captive Power Plant Market Revenue Million Forecast, by Fuel Source 2019 & 2032
- Table 112: Global Captive Power Plant Market Volume K Unit Forecast, by Fuel Source 2019 & 2032
- Table 113: Global Captive Power Plant Market Revenue Million Forecast, by Industry 2019 & 2032
- Table 114: Global Captive Power Plant Market Volume K Unit Forecast, by Industry 2019 & 2032
- Table 115: Global Captive Power Plant Market Revenue Million Forecast, by Country 2019 & 2032
- Table 116: Global Captive Power Plant Market Volume K Unit Forecast, by Country 2019 & 2032
- Table 117: Saudi Arabia Captive Power Plant Market Revenue (Million) Forecast, by Application 2019 & 2032
- Table 118: Saudi Arabia Captive Power Plant Market Volume (K Unit) Forecast, by Application 2019 & 2032
- Table 119: United Arab Emirates Captive Power Plant Market Revenue (Million) Forecast, by Application 2019 & 2032
- Table 120: United Arab Emirates Captive Power Plant Market Volume (K Unit) Forecast, by Application 2019 & 2032
- Table 121: South Africa Captive Power Plant Market Revenue (Million) Forecast, by Application 2019 & 2032
- Table 122: South Africa Captive Power Plant Market Volume (K Unit) Forecast, by Application 2019 & 2032
- Table 123: Rest of Middle East and Africa Captive Power Plant Market Revenue (Million) Forecast, by Application 2019 & 2032
- Table 124: Rest of Middle East and Africa Captive Power Plant Market Volume (K Unit) Forecast, by Application 2019 & 2032
Frequently Asked Questions
1. What is the projected Compound Annual Growth Rate (CAGR) of the Captive Power Plant Market?
The projected CAGR is approximately 6.41%.
2. Which companies are prominent players in the Captive Power Plant Market?
Key companies in the market include Tata Power Renewable Energy, Kohler Co, Bharat Heavy Electricals Limited, Siemens AG, Wartsila Oyj Abp, AMP Solar Group Inc, General Electric Company.
3. What are the main segments of the Captive Power Plant Market?
The market segments include Fuel Source, Industry.
4. Can you provide details about the market size?
The market size is estimated to be USD 214.12 Million as of 2022.
5. What are some drivers contributing to market growth?
Increasing Power Demand across Industrial Sector4.; Remote Location of Several Industries and the Unreliability of the Power Supply.
6. What are the notable trends driving market growth?
Steel Industry to Have Significant Share in the Market.
7. Are there any restraints impacting market growth?
High Capital and Operational Expenditures.
8. Can you provide examples of recent developments in the market?
September 2022: Tata Power Renewable Energy (TPREL) announced a collaboration with Viraj Profile, a stainless steel manufacturer, to set up a 100 MW captive solar plant. The company will develop the Nandgaon plant at its Nasik site, and it will power the Tarapur Plant of Viraj Profile.
9. What pricing options are available for accessing the report?
Pricing options include single-user, multi-user, and enterprise licenses priced at USD 4750, USD 5250, and USD 8750 respectively.
10. Is the market size provided in terms of value or volume?
The market size is provided in terms of value, measured in Million and volume, measured in K Unit.
11. Are there any specific market keywords associated with the report?
Yes, the market keyword associated with the report is "Captive Power Plant Market," which aids in identifying and referencing the specific market segment covered.
12. How do I determine which pricing option suits my needs best?
The pricing options vary based on user requirements and access needs. Individual users may opt for single-user licenses, while businesses requiring broader access may choose multi-user or enterprise licenses for cost-effective access to the report.
13. Are there any additional resources or data provided in the Captive Power Plant Market report?
While the report offers comprehensive insights, it's advisable to review the specific contents or supplementary materials provided to ascertain if additional resources or data are available.
14. How can I stay updated on further developments or reports in the Captive Power Plant Market?
To stay informed about further developments, trends, and reports in the Captive Power Plant Market, consider subscribing to industry newsletters, following relevant companies and organizations, or regularly checking reputable industry news sources and publications.
Methodology
Step 1 - Identification of Relevant Samples Size from Population Database


Step 2 - Approaches for Defining Global Market Size (Value, Volume* & Price*)

Note*: In applicable scenarios
Step 3 - Data Sources
Primary Research
- Web Analytics
- Survey Reports
- Research Institute
- Latest Research Reports
- Opinion Leaders
Secondary Research
- Annual Reports
- White Paper
- Latest Press Release
- Industry Association
- Paid Database
- Investor Presentations

Step 4 - Data Triangulation
Involves using different sources of information in order to increase the validity of a study
These sources are likely to be stakeholders in a program - participants, other researchers, program staff, other community members, and so on.
Then we put all data in single framework & apply various statistical tools to find out the dynamic on the market.
During the analysis stage, feedback from the stakeholder groups would be compared to determine areas of agreement as well as areas of divergence


