
Key Insights
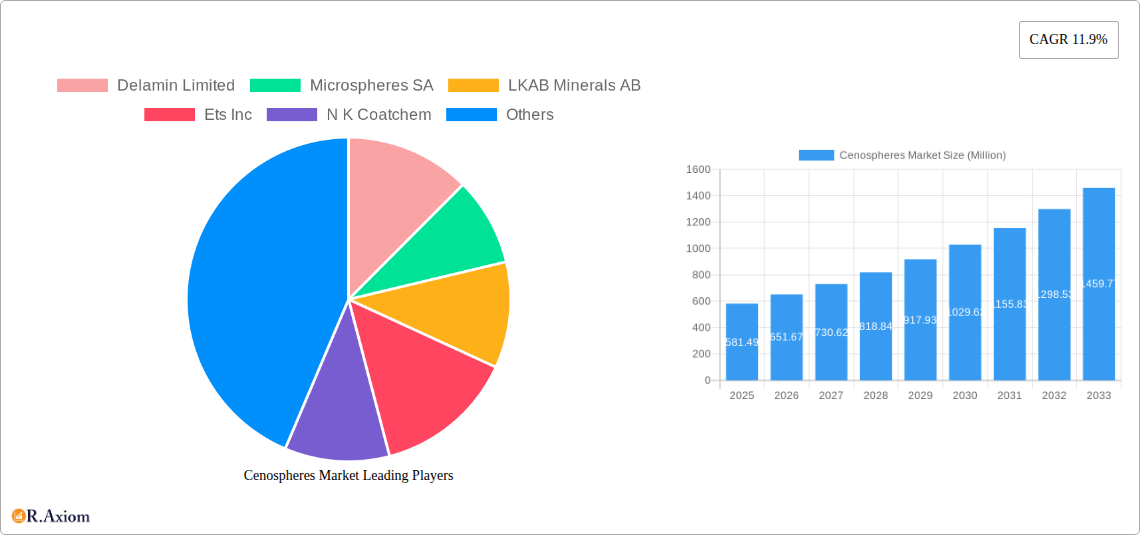
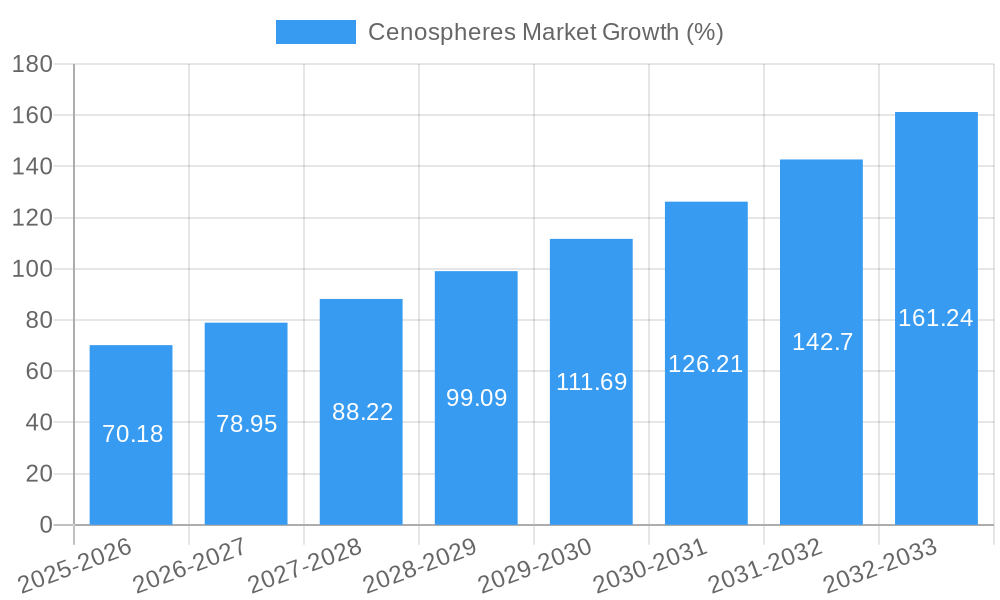
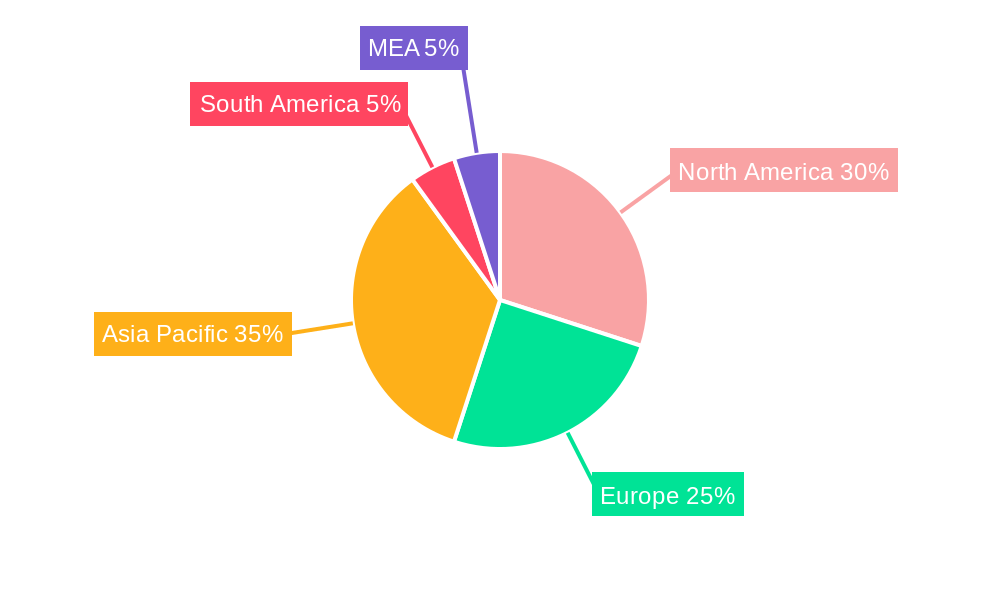
The global cenospheres market, valued at $581.49 million in 2025, is projected to experience robust growth, driven by a compound annual growth rate (CAGR) of 11.9% from 2025 to 2033. This expansion is fueled by several key factors. The increasing adoption of lightweight construction materials in the building and construction industry is a major driver, with cenospheres offering significant advantages in terms of strength, insulation, and reduced weight. Furthermore, the growing demand for high-performance materials in the oil and gas sector, particularly for drilling fluids and cement additives, contributes significantly to market growth. The automotive and aerospace industries are also increasingly utilizing cenospheres for their lightweighting and enhanced performance properties, boosting market demand. Technological advancements in cenosphere production, leading to improved quality and consistency, are further accelerating market expansion. The diverse applications across various end-user industries ensure a broad and resilient market base. Geographic growth is anticipated across all regions, with North America and Asia-Pacific expected to maintain leading positions due to significant infrastructural development and industrial activity.
However, certain restraints might temper the market's growth trajectory. Price fluctuations in raw materials, coupled with potential environmental concerns associated with cenosphere production and disposal, could present challenges. Competition from alternative lightweight fillers and the potential impact of economic downturns on construction and industrial activity could also influence market growth. Nevertheless, the overall market outlook remains positive, indicating sustained growth potential in the coming years. The focus on sustainability and the development of innovative applications will be critical to navigating these challenges and ensuring continued market expansion. Strategic partnerships and investments in research and development are crucial for companies seeking to capitalize on the opportunities presented by this burgeoning market.
Cenospheres Market: A Comprehensive Analysis & Forecast (2019-2033)
This detailed report provides a comprehensive analysis of the global cenospheres market, offering in-depth insights into market dynamics, growth drivers, challenges, and future opportunities. The study covers the period 2019-2033, with 2025 serving as the base and estimated year. This report is an invaluable resource for industry stakeholders, investors, and businesses seeking to understand and capitalize on the growth potential within this dynamic market.
Cenospheres Market Concentration & Innovation
The global cenospheres market exhibits a moderately concentrated landscape, with key players holding significant market share. Delamin Limited, LKAB Minerals AB, and Microspheres SA are among the leading companies, collectively accounting for an estimated xx% of the market in 2025. However, the market also features several smaller players and regional specialists, contributing to a dynamic competitive environment.
Innovation in the cenospheres market is driven by the increasing demand for high-performance materials across diverse end-use industries. Key drivers include:
- Technological advancements: Research and development efforts focus on improving cenosphere properties like strength, density, and surface treatment for enhanced performance in specific applications.
- Regulatory frameworks: Stringent environmental regulations are prompting the development of sustainable and eco-friendly cenosphere production methods.
- Product substitution: Cenospheres are increasingly replacing traditional fillers and lightweighting agents due to their superior properties.
- End-user trends: The growing adoption of cenospheres in construction, oil and gas, and automotive industries is fueling market growth.
- M&A activities: Consolidation within the industry through mergers and acquisitions (M&A) is expected to reshape the competitive landscape, with estimated M&A deal values totaling xx Million in the forecast period.
Cenospheres Market Industry Trends & Insights
The global cenospheres market is projected to witness significant growth, with a Compound Annual Growth Rate (CAGR) of xx% during the forecast period (2025-2033). This growth is primarily attributed to the increasing demand for lightweight, high-strength materials across various industries. Technological advancements in cenosphere production and surface modification techniques are further enhancing their performance and expanding application possibilities. Consumer preferences for sustainable and eco-friendly products are also driving the demand for cenospheres, as they offer a sustainable alternative to conventional fillers. However, the market faces challenges including fluctuating raw material prices and intense competition among market players. Market penetration is expected to increase significantly in emerging economies, driven by rising infrastructure development and industrialization.
Dominant Markets & Segments in Cenospheres Market
The construction industry is the dominant end-user segment for cenospheres, accounting for xx% of the market share in 2025. This is driven by the increasing use of cenospheres in concrete and cement products to enhance their properties like strength, durability, and insulation. Geographically, [Leading Region - e.g., North America/Europe] is the leading market, driven by robust infrastructure development, high construction activity, and a strong presence of key players.
Key Drivers for Construction Segment:
- Growing infrastructure projects in developing nations.
- Increased demand for lightweight and high-strength construction materials.
- Government initiatives promoting sustainable building practices.
Dominant Type Segment: White cenospheres hold a larger market share than gray cenospheres due to their superior properties and wider range of applications.
Detailed Dominance Analysis: The dominance of the construction segment is expected to continue throughout the forecast period, driven by consistent growth in construction activity globally, particularly in emerging economies.
Cenospheres Market Product Developments
Recent product innovations focus on improving cenosphere surface treatment to enhance their bonding properties with matrices and improve dispersion in composite materials. These advancements have broadened their applications in areas like high-performance concrete, oil well cementing, and automotive parts. The competitive advantage lies in developing specialized cenosphere grades tailored for specific applications, offering superior performance characteristics compared to traditional fillers.
Report Scope & Segmentation Analysis
This report segments the cenospheres market based on type (white cenospheres and gray cenospheres) and end-user industry (construction, oil and gas, automotive, aerospace, refractories, and other end-user industries). Each segment's growth projections, market size, and competitive dynamics are analyzed in detail, providing a comprehensive understanding of the market landscape. The construction segment is projected to exhibit significant growth, driven by booming construction activities worldwide. The oil and gas segment is expected to experience moderate growth, owing to its use in drilling fluids.
Key Drivers of Cenospheres Market Growth
The cenospheres market is experiencing growth driven by several factors, including:
- The increasing demand for lightweight and high-strength materials across various industries.
- Technological advancements resulting in enhanced cenosphere properties and application possibilities.
- Stringent environmental regulations promoting the use of sustainable materials.
- Growing infrastructure development and industrialization in emerging economies.
Challenges in the Cenospheres Market Sector
The cenospheres market faces challenges including:
- Fluctuations in raw material prices, impacting production costs.
- Intense competition among existing and new market entrants.
- Concerns regarding the consistency and quality of cenospheres from different sources.
Emerging Opportunities in Cenospheres Market
Emerging opportunities include:
- Expanding applications in advanced materials like composites and polymers.
- Growth in emerging markets with high infrastructure development.
- Development of specialized cenosphere grades with improved properties.
Leading Players in the Cenospheres Market Market
- Delamin Limited
- Microspheres SA
- LKAB Minerals AB
- Ets Inc
- N K Coatchem
- American Iodine Company Inc
- Ashtech India Pvt Ltd
- CenoStar
- Kulin Corporation
- BPN International
- Cenospheres Trade and Engineering SA
- Ceno Technologies
- Dennert Poraver GmbH
Key Developments in Cenospheres Market Industry
- 2022: LKAB Minerals AB announced a significant investment in expanding its cenosphere production capacity.
- 2023: Delamin Limited launched a new line of high-performance white cenospheres for the construction industry.
- 2024: Microspheres SA acquired a smaller competitor, strengthening its market position. (Further details to be added based on actual data)
Strategic Outlook for Cenospheres Market Market
The cenospheres market is poised for continued growth, driven by strong demand from diverse end-user industries and ongoing technological advancements. Future opportunities lie in exploring new applications, enhancing product properties, and expanding into emerging markets. Strategic partnerships and collaborations will play a vital role in shaping the future of this dynamic market.
Cenospheres Market Segmentation
-
1. Type
- 1.1. White Cenospheres
- 1.2. Gray Cenospheres
-
2. End-user Industry
- 2.1. Construction
- 2.2. Oil and Gas
- 2.3. Automotive
- 2.4. Aerospace
- 2.5. Refractories
- 2.6. Other End-user Industries
Cenospheres Market Segmentation By Geography
-
1. Asia Pacific
- 1.1. China
- 1.2. India
- 1.3. Japan
- 1.4. South Korea
- 1.5. Rest of Asia Pacific
-
2. North America
- 2.1. United States
- 2.2. Canada
- 2.3. Mexico
-
3. Europe
- 3.1. Germany
- 3.2. United Kingdom
- 3.3. Italy
- 3.4. France
- 3.5. Rest of Europe
-
4. South America
- 4.1. Brazil
- 4.2. Argentina
- 4.3. Rest of South America
- 5. Middle East
-
6. Saudi Arabia
- 6.1. South Africa
- 6.2. Rest of Middle East
Cenospheres Market REPORT HIGHLIGHTS
| Aspects | Details |
|---|---|
| Study Period | 2019-2033 |
| Base Year | 2024 |
| Estimated Year | 2025 |
| Forecast Period | 2025-2033 |
| Historical Period | 2019-2024 |
| Growth Rate | CAGR of 11.9% from 2019-2033 |
| Segmentation |
|
Table of Contents
- 1. Introduction
- 1.1. Research Scope
- 1.2. Market Segmentation
- 1.3. Research Methodology
- 1.4. Definitions and Assumptions
- 2. Executive Summary
- 2.1. Introduction
- 3. Market Dynamics
- 3.1. Introduction
- 3.2. Market Drivers
- 3.2.1. ; Growth of Construction Sector in Asia-Pacific; Other Drivers
- 3.3. Market Restrains
- 3.3.1. ; Limited Raw Material Supply; Other Restraints
- 3.4. Market Trends
- 3.4.1. Construction Sector to Dominate the Market
- 4. Market Factor Analysis
- 4.1. Porters Five Forces
- 4.2. Supply/Value Chain
- 4.3. PESTEL analysis
- 4.4. Market Entropy
- 4.5. Patent/Trademark Analysis
- 5. Global Cenospheres Market Analysis, Insights and Forecast, 2019-2031
- 5.1. Market Analysis, Insights and Forecast - by Type
- 5.1.1. White Cenospheres
- 5.1.2. Gray Cenospheres
- 5.2. Market Analysis, Insights and Forecast - by End-user Industry
- 5.2.1. Construction
- 5.2.2. Oil and Gas
- 5.2.3. Automotive
- 5.2.4. Aerospace
- 5.2.5. Refractories
- 5.2.6. Other End-user Industries
- 5.3. Market Analysis, Insights and Forecast - by Region
- 5.3.1. Asia Pacific
- 5.3.2. North America
- 5.3.3. Europe
- 5.3.4. South America
- 5.3.5. Middle East
- 5.3.6. Saudi Arabia
- 5.1. Market Analysis, Insights and Forecast - by Type
- 6. Asia Pacific Cenospheres Market Analysis, Insights and Forecast, 2019-2031
- 6.1. Market Analysis, Insights and Forecast - by Type
- 6.1.1. White Cenospheres
- 6.1.2. Gray Cenospheres
- 6.2. Market Analysis, Insights and Forecast - by End-user Industry
- 6.2.1. Construction
- 6.2.2. Oil and Gas
- 6.2.3. Automotive
- 6.2.4. Aerospace
- 6.2.5. Refractories
- 6.2.6. Other End-user Industries
- 6.1. Market Analysis, Insights and Forecast - by Type
- 7. North America Cenospheres Market Analysis, Insights and Forecast, 2019-2031
- 7.1. Market Analysis, Insights and Forecast - by Type
- 7.1.1. White Cenospheres
- 7.1.2. Gray Cenospheres
- 7.2. Market Analysis, Insights and Forecast - by End-user Industry
- 7.2.1. Construction
- 7.2.2. Oil and Gas
- 7.2.3. Automotive
- 7.2.4. Aerospace
- 7.2.5. Refractories
- 7.2.6. Other End-user Industries
- 7.1. Market Analysis, Insights and Forecast - by Type
- 8. Europe Cenospheres Market Analysis, Insights and Forecast, 2019-2031
- 8.1. Market Analysis, Insights and Forecast - by Type
- 8.1.1. White Cenospheres
- 8.1.2. Gray Cenospheres
- 8.2. Market Analysis, Insights and Forecast - by End-user Industry
- 8.2.1. Construction
- 8.2.2. Oil and Gas
- 8.2.3. Automotive
- 8.2.4. Aerospace
- 8.2.5. Refractories
- 8.2.6. Other End-user Industries
- 8.1. Market Analysis, Insights and Forecast - by Type
- 9. South America Cenospheres Market Analysis, Insights and Forecast, 2019-2031
- 9.1. Market Analysis, Insights and Forecast - by Type
- 9.1.1. White Cenospheres
- 9.1.2. Gray Cenospheres
- 9.2. Market Analysis, Insights and Forecast - by End-user Industry
- 9.2.1. Construction
- 9.2.2. Oil and Gas
- 9.2.3. Automotive
- 9.2.4. Aerospace
- 9.2.5. Refractories
- 9.2.6. Other End-user Industries
- 9.1. Market Analysis, Insights and Forecast - by Type
- 10. Middle East Cenospheres Market Analysis, Insights and Forecast, 2019-2031
- 10.1. Market Analysis, Insights and Forecast - by Type
- 10.1.1. White Cenospheres
- 10.1.2. Gray Cenospheres
- 10.2. Market Analysis, Insights and Forecast - by End-user Industry
- 10.2.1. Construction
- 10.2.2. Oil and Gas
- 10.2.3. Automotive
- 10.2.4. Aerospace
- 10.2.5. Refractories
- 10.2.6. Other End-user Industries
- 10.1. Market Analysis, Insights and Forecast - by Type
- 11. Saudi Arabia Cenospheres Market Analysis, Insights and Forecast, 2019-2031
- 11.1. Market Analysis, Insights and Forecast - by Type
- 11.1.1. White Cenospheres
- 11.1.2. Gray Cenospheres
- 11.2. Market Analysis, Insights and Forecast - by End-user Industry
- 11.2.1. Construction
- 11.2.2. Oil and Gas
- 11.2.3. Automotive
- 11.2.4. Aerospace
- 11.2.5. Refractories
- 11.2.6. Other End-user Industries
- 11.1. Market Analysis, Insights and Forecast - by Type
- 12. North America Cenospheres Market Analysis, Insights and Forecast, 2019-2031
- 12.1. Market Analysis, Insights and Forecast - By Country/Sub-region
- 12.1.1 United States
- 12.1.2 Canada
- 12.1.3 Mexico
- 13. Europe Cenospheres Market Analysis, Insights and Forecast, 2019-2031
- 13.1. Market Analysis, Insights and Forecast - By Country/Sub-region
- 13.1.1 Germany
- 13.1.2 France
- 13.1.3 Italy
- 13.1.4 United Kingdom
- 13.1.5 Netherlands
- 13.1.6 Rest of Europe
- 14. Asia Pacific Cenospheres Market Analysis, Insights and Forecast, 2019-2031
- 14.1. Market Analysis, Insights and Forecast - By Country/Sub-region
- 14.1.1 China
- 14.1.2 Japan
- 14.1.3 India
- 14.1.4 South Korea
- 14.1.5 Taiwan
- 14.1.6 Australia
- 14.1.7 Rest of Asia-Pacific
- 15. South America Cenospheres Market Analysis, Insights and Forecast, 2019-2031
- 15.1. Market Analysis, Insights and Forecast - By Country/Sub-region
- 15.1.1 Brazil
- 15.1.2 Argentina
- 15.1.3 Rest of South America
- 16. MEA Cenospheres Market Analysis, Insights and Forecast, 2019-2031
- 16.1. Market Analysis, Insights and Forecast - By Country/Sub-region
- 16.1.1 Middle East
- 16.1.2 Africa
- 17. Competitive Analysis
- 17.1. Global Market Share Analysis 2024
- 17.2. Company Profiles
- 17.2.1 Delamin Limited
- 17.2.1.1. Overview
- 17.2.1.2. Products
- 17.2.1.3. SWOT Analysis
- 17.2.1.4. Recent Developments
- 17.2.1.5. Financials (Based on Availability)
- 17.2.2 Microspheres SA
- 17.2.2.1. Overview
- 17.2.2.2. Products
- 17.2.2.3. SWOT Analysis
- 17.2.2.4. Recent Developments
- 17.2.2.5. Financials (Based on Availability)
- 17.2.3 LKAB Minerals AB
- 17.2.3.1. Overview
- 17.2.3.2. Products
- 17.2.3.3. SWOT Analysis
- 17.2.3.4. Recent Developments
- 17.2.3.5. Financials (Based on Availability)
- 17.2.4 Ets Inc
- 17.2.4.1. Overview
- 17.2.4.2. Products
- 17.2.4.3. SWOT Analysis
- 17.2.4.4. Recent Developments
- 17.2.4.5. Financials (Based on Availability)
- 17.2.5 N K Coatchem
- 17.2.5.1. Overview
- 17.2.5.2. Products
- 17.2.5.3. SWOT Analysis
- 17.2.5.4. Recent Developments
- 17.2.5.5. Financials (Based on Availability)
- 17.2.6 American Iodine Company Inc
- 17.2.6.1. Overview
- 17.2.6.2. Products
- 17.2.6.3. SWOT Analysis
- 17.2.6.4. Recent Developments
- 17.2.6.5. Financials (Based on Availability)
- 17.2.7 Ashtech India Pvt Ltd
- 17.2.7.1. Overview
- 17.2.7.2. Products
- 17.2.7.3. SWOT Analysis
- 17.2.7.4. Recent Developments
- 17.2.7.5. Financials (Based on Availability)
- 17.2.8 CenoStar
- 17.2.8.1. Overview
- 17.2.8.2. Products
- 17.2.8.3. SWOT Analysis
- 17.2.8.4. Recent Developments
- 17.2.8.5. Financials (Based on Availability)
- 17.2.9 Kulin Corporation
- 17.2.9.1. Overview
- 17.2.9.2. Products
- 17.2.9.3. SWOT Analysis
- 17.2.9.4. Recent Developments
- 17.2.9.5. Financials (Based on Availability)
- 17.2.10 BPN International
- 17.2.10.1. Overview
- 17.2.10.2. Products
- 17.2.10.3. SWOT Analysis
- 17.2.10.4. Recent Developments
- 17.2.10.5. Financials (Based on Availability)
- 17.2.11 Cenospheres Trade and Engineering SA
- 17.2.11.1. Overview
- 17.2.11.2. Products
- 17.2.11.3. SWOT Analysis
- 17.2.11.4. Recent Developments
- 17.2.11.5. Financials (Based on Availability)
- 17.2.12 Ceno Technologies
- 17.2.12.1. Overview
- 17.2.12.2. Products
- 17.2.12.3. SWOT Analysis
- 17.2.12.4. Recent Developments
- 17.2.12.5. Financials (Based on Availability)
- 17.2.13 Dennert Poraver GmbH
- 17.2.13.1. Overview
- 17.2.13.2. Products
- 17.2.13.3. SWOT Analysis
- 17.2.13.4. Recent Developments
- 17.2.13.5. Financials (Based on Availability)
- 17.2.1 Delamin Limited
List of Figures
- Figure 1: Global Cenospheres Market Revenue Breakdown (Million, %) by Region 2024 & 2032
- Figure 2: Global Cenospheres Market Volume Breakdown (K Tons, %) by Region 2024 & 2032
- Figure 3: North America Cenospheres Market Revenue (Million), by Country 2024 & 2032
- Figure 4: North America Cenospheres Market Volume (K Tons), by Country 2024 & 2032
- Figure 5: North America Cenospheres Market Revenue Share (%), by Country 2024 & 2032
- Figure 6: North America Cenospheres Market Volume Share (%), by Country 2024 & 2032
- Figure 7: Europe Cenospheres Market Revenue (Million), by Country 2024 & 2032
- Figure 8: Europe Cenospheres Market Volume (K Tons), by Country 2024 & 2032
- Figure 9: Europe Cenospheres Market Revenue Share (%), by Country 2024 & 2032
- Figure 10: Europe Cenospheres Market Volume Share (%), by Country 2024 & 2032
- Figure 11: Asia Pacific Cenospheres Market Revenue (Million), by Country 2024 & 2032
- Figure 12: Asia Pacific Cenospheres Market Volume (K Tons), by Country 2024 & 2032
- Figure 13: Asia Pacific Cenospheres Market Revenue Share (%), by Country 2024 & 2032
- Figure 14: Asia Pacific Cenospheres Market Volume Share (%), by Country 2024 & 2032
- Figure 15: South America Cenospheres Market Revenue (Million), by Country 2024 & 2032
- Figure 16: South America Cenospheres Market Volume (K Tons), by Country 2024 & 2032
- Figure 17: South America Cenospheres Market Revenue Share (%), by Country 2024 & 2032
- Figure 18: South America Cenospheres Market Volume Share (%), by Country 2024 & 2032
- Figure 19: MEA Cenospheres Market Revenue (Million), by Country 2024 & 2032
- Figure 20: MEA Cenospheres Market Volume (K Tons), by Country 2024 & 2032
- Figure 21: MEA Cenospheres Market Revenue Share (%), by Country 2024 & 2032
- Figure 22: MEA Cenospheres Market Volume Share (%), by Country 2024 & 2032
- Figure 23: Asia Pacific Cenospheres Market Revenue (Million), by Type 2024 & 2032
- Figure 24: Asia Pacific Cenospheres Market Volume (K Tons), by Type 2024 & 2032
- Figure 25: Asia Pacific Cenospheres Market Revenue Share (%), by Type 2024 & 2032
- Figure 26: Asia Pacific Cenospheres Market Volume Share (%), by Type 2024 & 2032
- Figure 27: Asia Pacific Cenospheres Market Revenue (Million), by End-user Industry 2024 & 2032
- Figure 28: Asia Pacific Cenospheres Market Volume (K Tons), by End-user Industry 2024 & 2032
- Figure 29: Asia Pacific Cenospheres Market Revenue Share (%), by End-user Industry 2024 & 2032
- Figure 30: Asia Pacific Cenospheres Market Volume Share (%), by End-user Industry 2024 & 2032
- Figure 31: Asia Pacific Cenospheres Market Revenue (Million), by Country 2024 & 2032
- Figure 32: Asia Pacific Cenospheres Market Volume (K Tons), by Country 2024 & 2032
- Figure 33: Asia Pacific Cenospheres Market Revenue Share (%), by Country 2024 & 2032
- Figure 34: Asia Pacific Cenospheres Market Volume Share (%), by Country 2024 & 2032
- Figure 35: North America Cenospheres Market Revenue (Million), by Type 2024 & 2032
- Figure 36: North America Cenospheres Market Volume (K Tons), by Type 2024 & 2032
- Figure 37: North America Cenospheres Market Revenue Share (%), by Type 2024 & 2032
- Figure 38: North America Cenospheres Market Volume Share (%), by Type 2024 & 2032
- Figure 39: North America Cenospheres Market Revenue (Million), by End-user Industry 2024 & 2032
- Figure 40: North America Cenospheres Market Volume (K Tons), by End-user Industry 2024 & 2032
- Figure 41: North America Cenospheres Market Revenue Share (%), by End-user Industry 2024 & 2032
- Figure 42: North America Cenospheres Market Volume Share (%), by End-user Industry 2024 & 2032
- Figure 43: North America Cenospheres Market Revenue (Million), by Country 2024 & 2032
- Figure 44: North America Cenospheres Market Volume (K Tons), by Country 2024 & 2032
- Figure 45: North America Cenospheres Market Revenue Share (%), by Country 2024 & 2032
- Figure 46: North America Cenospheres Market Volume Share (%), by Country 2024 & 2032
- Figure 47: Europe Cenospheres Market Revenue (Million), by Type 2024 & 2032
- Figure 48: Europe Cenospheres Market Volume (K Tons), by Type 2024 & 2032
- Figure 49: Europe Cenospheres Market Revenue Share (%), by Type 2024 & 2032
- Figure 50: Europe Cenospheres Market Volume Share (%), by Type 2024 & 2032
- Figure 51: Europe Cenospheres Market Revenue (Million), by End-user Industry 2024 & 2032
- Figure 52: Europe Cenospheres Market Volume (K Tons), by End-user Industry 2024 & 2032
- Figure 53: Europe Cenospheres Market Revenue Share (%), by End-user Industry 2024 & 2032
- Figure 54: Europe Cenospheres Market Volume Share (%), by End-user Industry 2024 & 2032
- Figure 55: Europe Cenospheres Market Revenue (Million), by Country 2024 & 2032
- Figure 56: Europe Cenospheres Market Volume (K Tons), by Country 2024 & 2032
- Figure 57: Europe Cenospheres Market Revenue Share (%), by Country 2024 & 2032
- Figure 58: Europe Cenospheres Market Volume Share (%), by Country 2024 & 2032
- Figure 59: South America Cenospheres Market Revenue (Million), by Type 2024 & 2032
- Figure 60: South America Cenospheres Market Volume (K Tons), by Type 2024 & 2032
- Figure 61: South America Cenospheres Market Revenue Share (%), by Type 2024 & 2032
- Figure 62: South America Cenospheres Market Volume Share (%), by Type 2024 & 2032
- Figure 63: South America Cenospheres Market Revenue (Million), by End-user Industry 2024 & 2032
- Figure 64: South America Cenospheres Market Volume (K Tons), by End-user Industry 2024 & 2032
- Figure 65: South America Cenospheres Market Revenue Share (%), by End-user Industry 2024 & 2032
- Figure 66: South America Cenospheres Market Volume Share (%), by End-user Industry 2024 & 2032
- Figure 67: South America Cenospheres Market Revenue (Million), by Country 2024 & 2032
- Figure 68: South America Cenospheres Market Volume (K Tons), by Country 2024 & 2032
- Figure 69: South America Cenospheres Market Revenue Share (%), by Country 2024 & 2032
- Figure 70: South America Cenospheres Market Volume Share (%), by Country 2024 & 2032
- Figure 71: Middle East Cenospheres Market Revenue (Million), by Type 2024 & 2032
- Figure 72: Middle East Cenospheres Market Volume (K Tons), by Type 2024 & 2032
- Figure 73: Middle East Cenospheres Market Revenue Share (%), by Type 2024 & 2032
- Figure 74: Middle East Cenospheres Market Volume Share (%), by Type 2024 & 2032
- Figure 75: Middle East Cenospheres Market Revenue (Million), by End-user Industry 2024 & 2032
- Figure 76: Middle East Cenospheres Market Volume (K Tons), by End-user Industry 2024 & 2032
- Figure 77: Middle East Cenospheres Market Revenue Share (%), by End-user Industry 2024 & 2032
- Figure 78: Middle East Cenospheres Market Volume Share (%), by End-user Industry 2024 & 2032
- Figure 79: Middle East Cenospheres Market Revenue (Million), by Country 2024 & 2032
- Figure 80: Middle East Cenospheres Market Volume (K Tons), by Country 2024 & 2032
- Figure 81: Middle East Cenospheres Market Revenue Share (%), by Country 2024 & 2032
- Figure 82: Middle East Cenospheres Market Volume Share (%), by Country 2024 & 2032
- Figure 83: Saudi Arabia Cenospheres Market Revenue (Million), by Type 2024 & 2032
- Figure 84: Saudi Arabia Cenospheres Market Volume (K Tons), by Type 2024 & 2032
- Figure 85: Saudi Arabia Cenospheres Market Revenue Share (%), by Type 2024 & 2032
- Figure 86: Saudi Arabia Cenospheres Market Volume Share (%), by Type 2024 & 2032
- Figure 87: Saudi Arabia Cenospheres Market Revenue (Million), by End-user Industry 2024 & 2032
- Figure 88: Saudi Arabia Cenospheres Market Volume (K Tons), by End-user Industry 2024 & 2032
- Figure 89: Saudi Arabia Cenospheres Market Revenue Share (%), by End-user Industry 2024 & 2032
- Figure 90: Saudi Arabia Cenospheres Market Volume Share (%), by End-user Industry 2024 & 2032
- Figure 91: Saudi Arabia Cenospheres Market Revenue (Million), by Country 2024 & 2032
- Figure 92: Saudi Arabia Cenospheres Market Volume (K Tons), by Country 2024 & 2032
- Figure 93: Saudi Arabia Cenospheres Market Revenue Share (%), by Country 2024 & 2032
- Figure 94: Saudi Arabia Cenospheres Market Volume Share (%), by Country 2024 & 2032
List of Tables
- Table 1: Global Cenospheres Market Revenue Million Forecast, by Region 2019 & 2032
- Table 2: Global Cenospheres Market Volume K Tons Forecast, by Region 2019 & 2032
- Table 3: Global Cenospheres Market Revenue Million Forecast, by Type 2019 & 2032
- Table 4: Global Cenospheres Market Volume K Tons Forecast, by Type 2019 & 2032
- Table 5: Global Cenospheres Market Revenue Million Forecast, by End-user Industry 2019 & 2032
- Table 6: Global Cenospheres Market Volume K Tons Forecast, by End-user Industry 2019 & 2032
- Table 7: Global Cenospheres Market Revenue Million Forecast, by Region 2019 & 2032
- Table 8: Global Cenospheres Market Volume K Tons Forecast, by Region 2019 & 2032
- Table 9: Global Cenospheres Market Revenue Million Forecast, by Country 2019 & 2032
- Table 10: Global Cenospheres Market Volume K Tons Forecast, by Country 2019 & 2032
- Table 11: United States Cenospheres Market Revenue (Million) Forecast, by Application 2019 & 2032
- Table 12: United States Cenospheres Market Volume (K Tons) Forecast, by Application 2019 & 2032
- Table 13: Canada Cenospheres Market Revenue (Million) Forecast, by Application 2019 & 2032
- Table 14: Canada Cenospheres Market Volume (K Tons) Forecast, by Application 2019 & 2032
- Table 15: Mexico Cenospheres Market Revenue (Million) Forecast, by Application 2019 & 2032
- Table 16: Mexico Cenospheres Market Volume (K Tons) Forecast, by Application 2019 & 2032
- Table 17: Global Cenospheres Market Revenue Million Forecast, by Country 2019 & 2032
- Table 18: Global Cenospheres Market Volume K Tons Forecast, by Country 2019 & 2032
- Table 19: Germany Cenospheres Market Revenue (Million) Forecast, by Application 2019 & 2032
- Table 20: Germany Cenospheres Market Volume (K Tons) Forecast, by Application 2019 & 2032
- Table 21: France Cenospheres Market Revenue (Million) Forecast, by Application 2019 & 2032
- Table 22: France Cenospheres Market Volume (K Tons) Forecast, by Application 2019 & 2032
- Table 23: Italy Cenospheres Market Revenue (Million) Forecast, by Application 2019 & 2032
- Table 24: Italy Cenospheres Market Volume (K Tons) Forecast, by Application 2019 & 2032
- Table 25: United Kingdom Cenospheres Market Revenue (Million) Forecast, by Application 2019 & 2032
- Table 26: United Kingdom Cenospheres Market Volume (K Tons) Forecast, by Application 2019 & 2032
- Table 27: Netherlands Cenospheres Market Revenue (Million) Forecast, by Application 2019 & 2032
- Table 28: Netherlands Cenospheres Market Volume (K Tons) Forecast, by Application 2019 & 2032
- Table 29: Rest of Europe Cenospheres Market Revenue (Million) Forecast, by Application 2019 & 2032
- Table 30: Rest of Europe Cenospheres Market Volume (K Tons) Forecast, by Application 2019 & 2032
- Table 31: Global Cenospheres Market Revenue Million Forecast, by Country 2019 & 2032
- Table 32: Global Cenospheres Market Volume K Tons Forecast, by Country 2019 & 2032
- Table 33: China Cenospheres Market Revenue (Million) Forecast, by Application 2019 & 2032
- Table 34: China Cenospheres Market Volume (K Tons) Forecast, by Application 2019 & 2032
- Table 35: Japan Cenospheres Market Revenue (Million) Forecast, by Application 2019 & 2032
- Table 36: Japan Cenospheres Market Volume (K Tons) Forecast, by Application 2019 & 2032
- Table 37: India Cenospheres Market Revenue (Million) Forecast, by Application 2019 & 2032
- Table 38: India Cenospheres Market Volume (K Tons) Forecast, by Application 2019 & 2032
- Table 39: South Korea Cenospheres Market Revenue (Million) Forecast, by Application 2019 & 2032
- Table 40: South Korea Cenospheres Market Volume (K Tons) Forecast, by Application 2019 & 2032
- Table 41: Taiwan Cenospheres Market Revenue (Million) Forecast, by Application 2019 & 2032
- Table 42: Taiwan Cenospheres Market Volume (K Tons) Forecast, by Application 2019 & 2032
- Table 43: Australia Cenospheres Market Revenue (Million) Forecast, by Application 2019 & 2032
- Table 44: Australia Cenospheres Market Volume (K Tons) Forecast, by Application 2019 & 2032
- Table 45: Rest of Asia-Pacific Cenospheres Market Revenue (Million) Forecast, by Application 2019 & 2032
- Table 46: Rest of Asia-Pacific Cenospheres Market Volume (K Tons) Forecast, by Application 2019 & 2032
- Table 47: Global Cenospheres Market Revenue Million Forecast, by Country 2019 & 2032
- Table 48: Global Cenospheres Market Volume K Tons Forecast, by Country 2019 & 2032
- Table 49: Brazil Cenospheres Market Revenue (Million) Forecast, by Application 2019 & 2032
- Table 50: Brazil Cenospheres Market Volume (K Tons) Forecast, by Application 2019 & 2032
- Table 51: Argentina Cenospheres Market Revenue (Million) Forecast, by Application 2019 & 2032
- Table 52: Argentina Cenospheres Market Volume (K Tons) Forecast, by Application 2019 & 2032
- Table 53: Rest of South America Cenospheres Market Revenue (Million) Forecast, by Application 2019 & 2032
- Table 54: Rest of South America Cenospheres Market Volume (K Tons) Forecast, by Application 2019 & 2032
- Table 55: Global Cenospheres Market Revenue Million Forecast, by Country 2019 & 2032
- Table 56: Global Cenospheres Market Volume K Tons Forecast, by Country 2019 & 2032
- Table 57: Middle East Cenospheres Market Revenue (Million) Forecast, by Application 2019 & 2032
- Table 58: Middle East Cenospheres Market Volume (K Tons) Forecast, by Application 2019 & 2032
- Table 59: Africa Cenospheres Market Revenue (Million) Forecast, by Application 2019 & 2032
- Table 60: Africa Cenospheres Market Volume (K Tons) Forecast, by Application 2019 & 2032
- Table 61: Global Cenospheres Market Revenue Million Forecast, by Type 2019 & 2032
- Table 62: Global Cenospheres Market Volume K Tons Forecast, by Type 2019 & 2032
- Table 63: Global Cenospheres Market Revenue Million Forecast, by End-user Industry 2019 & 2032
- Table 64: Global Cenospheres Market Volume K Tons Forecast, by End-user Industry 2019 & 2032
- Table 65: Global Cenospheres Market Revenue Million Forecast, by Country 2019 & 2032
- Table 66: Global Cenospheres Market Volume K Tons Forecast, by Country 2019 & 2032
- Table 67: China Cenospheres Market Revenue (Million) Forecast, by Application 2019 & 2032
- Table 68: China Cenospheres Market Volume (K Tons) Forecast, by Application 2019 & 2032
- Table 69: India Cenospheres Market Revenue (Million) Forecast, by Application 2019 & 2032
- Table 70: India Cenospheres Market Volume (K Tons) Forecast, by Application 2019 & 2032
- Table 71: Japan Cenospheres Market Revenue (Million) Forecast, by Application 2019 & 2032
- Table 72: Japan Cenospheres Market Volume (K Tons) Forecast, by Application 2019 & 2032
- Table 73: South Korea Cenospheres Market Revenue (Million) Forecast, by Application 2019 & 2032
- Table 74: South Korea Cenospheres Market Volume (K Tons) Forecast, by Application 2019 & 2032
- Table 75: Rest of Asia Pacific Cenospheres Market Revenue (Million) Forecast, by Application 2019 & 2032
- Table 76: Rest of Asia Pacific Cenospheres Market Volume (K Tons) Forecast, by Application 2019 & 2032
- Table 77: Global Cenospheres Market Revenue Million Forecast, by Type 2019 & 2032
- Table 78: Global Cenospheres Market Volume K Tons Forecast, by Type 2019 & 2032
- Table 79: Global Cenospheres Market Revenue Million Forecast, by End-user Industry 2019 & 2032
- Table 80: Global Cenospheres Market Volume K Tons Forecast, by End-user Industry 2019 & 2032
- Table 81: Global Cenospheres Market Revenue Million Forecast, by Country 2019 & 2032
- Table 82: Global Cenospheres Market Volume K Tons Forecast, by Country 2019 & 2032
- Table 83: United States Cenospheres Market Revenue (Million) Forecast, by Application 2019 & 2032
- Table 84: United States Cenospheres Market Volume (K Tons) Forecast, by Application 2019 & 2032
- Table 85: Canada Cenospheres Market Revenue (Million) Forecast, by Application 2019 & 2032
- Table 86: Canada Cenospheres Market Volume (K Tons) Forecast, by Application 2019 & 2032
- Table 87: Mexico Cenospheres Market Revenue (Million) Forecast, by Application 2019 & 2032
- Table 88: Mexico Cenospheres Market Volume (K Tons) Forecast, by Application 2019 & 2032
- Table 89: Global Cenospheres Market Revenue Million Forecast, by Type 2019 & 2032
- Table 90: Global Cenospheres Market Volume K Tons Forecast, by Type 2019 & 2032
- Table 91: Global Cenospheres Market Revenue Million Forecast, by End-user Industry 2019 & 2032
- Table 92: Global Cenospheres Market Volume K Tons Forecast, by End-user Industry 2019 & 2032
- Table 93: Global Cenospheres Market Revenue Million Forecast, by Country 2019 & 2032
- Table 94: Global Cenospheres Market Volume K Tons Forecast, by Country 2019 & 2032
- Table 95: Germany Cenospheres Market Revenue (Million) Forecast, by Application 2019 & 2032
- Table 96: Germany Cenospheres Market Volume (K Tons) Forecast, by Application 2019 & 2032
- Table 97: United Kingdom Cenospheres Market Revenue (Million) Forecast, by Application 2019 & 2032
- Table 98: United Kingdom Cenospheres Market Volume (K Tons) Forecast, by Application 2019 & 2032
- Table 99: Italy Cenospheres Market Revenue (Million) Forecast, by Application 2019 & 2032
- Table 100: Italy Cenospheres Market Volume (K Tons) Forecast, by Application 2019 & 2032
- Table 101: France Cenospheres Market Revenue (Million) Forecast, by Application 2019 & 2032
- Table 102: France Cenospheres Market Volume (K Tons) Forecast, by Application 2019 & 2032
- Table 103: Rest of Europe Cenospheres Market Revenue (Million) Forecast, by Application 2019 & 2032
- Table 104: Rest of Europe Cenospheres Market Volume (K Tons) Forecast, by Application 2019 & 2032
- Table 105: Global Cenospheres Market Revenue Million Forecast, by Type 2019 & 2032
- Table 106: Global Cenospheres Market Volume K Tons Forecast, by Type 2019 & 2032
- Table 107: Global Cenospheres Market Revenue Million Forecast, by End-user Industry 2019 & 2032
- Table 108: Global Cenospheres Market Volume K Tons Forecast, by End-user Industry 2019 & 2032
- Table 109: Global Cenospheres Market Revenue Million Forecast, by Country 2019 & 2032
- Table 110: Global Cenospheres Market Volume K Tons Forecast, by Country 2019 & 2032
- Table 111: Brazil Cenospheres Market Revenue (Million) Forecast, by Application 2019 & 2032
- Table 112: Brazil Cenospheres Market Volume (K Tons) Forecast, by Application 2019 & 2032
- Table 113: Argentina Cenospheres Market Revenue (Million) Forecast, by Application 2019 & 2032
- Table 114: Argentina Cenospheres Market Volume (K Tons) Forecast, by Application 2019 & 2032
- Table 115: Rest of South America Cenospheres Market Revenue (Million) Forecast, by Application 2019 & 2032
- Table 116: Rest of South America Cenospheres Market Volume (K Tons) Forecast, by Application 2019 & 2032
- Table 117: Global Cenospheres Market Revenue Million Forecast, by Type 2019 & 2032
- Table 118: Global Cenospheres Market Volume K Tons Forecast, by Type 2019 & 2032
- Table 119: Global Cenospheres Market Revenue Million Forecast, by End-user Industry 2019 & 2032
- Table 120: Global Cenospheres Market Volume K Tons Forecast, by End-user Industry 2019 & 2032
- Table 121: Global Cenospheres Market Revenue Million Forecast, by Country 2019 & 2032
- Table 122: Global Cenospheres Market Volume K Tons Forecast, by Country 2019 & 2032
- Table 123: Global Cenospheres Market Revenue Million Forecast, by Type 2019 & 2032
- Table 124: Global Cenospheres Market Volume K Tons Forecast, by Type 2019 & 2032
- Table 125: Global Cenospheres Market Revenue Million Forecast, by End-user Industry 2019 & 2032
- Table 126: Global Cenospheres Market Volume K Tons Forecast, by End-user Industry 2019 & 2032
- Table 127: Global Cenospheres Market Revenue Million Forecast, by Country 2019 & 2032
- Table 128: Global Cenospheres Market Volume K Tons Forecast, by Country 2019 & 2032
- Table 129: South Africa Cenospheres Market Revenue (Million) Forecast, by Application 2019 & 2032
- Table 130: South Africa Cenospheres Market Volume (K Tons) Forecast, by Application 2019 & 2032
- Table 131: Rest of Middle East Cenospheres Market Revenue (Million) Forecast, by Application 2019 & 2032
- Table 132: Rest of Middle East Cenospheres Market Volume (K Tons) Forecast, by Application 2019 & 2032
Frequently Asked Questions
1. What is the projected Compound Annual Growth Rate (CAGR) of the Cenospheres Market?
The projected CAGR is approximately 11.9%.
2. Which companies are prominent players in the Cenospheres Market?
Key companies in the market include Delamin Limited, Microspheres SA, LKAB Minerals AB, Ets Inc, N K Coatchem, American Iodine Company Inc, Ashtech India Pvt Ltd, CenoStar, Kulin Corporation, BPN International, Cenospheres Trade and Engineering SA, Ceno Technologies, Dennert Poraver GmbH.
3. What are the main segments of the Cenospheres Market?
The market segments include Type, End-user Industry.
4. Can you provide details about the market size?
The market size is estimated to be USD 581.49 Million as of 2022.
5. What are some drivers contributing to market growth?
; Growth of Construction Sector in Asia-Pacific; Other Drivers.
6. What are the notable trends driving market growth?
Construction Sector to Dominate the Market.
7. Are there any restraints impacting market growth?
; Limited Raw Material Supply; Other Restraints.
8. Can you provide examples of recent developments in the market?
N/A
9. What pricing options are available for accessing the report?
Pricing options include single-user, multi-user, and enterprise licenses priced at USD 4750, USD 5250, and USD 8750 respectively.
10. Is the market size provided in terms of value or volume?
The market size is provided in terms of value, measured in Million and volume, measured in K Tons.
11. Are there any specific market keywords associated with the report?
Yes, the market keyword associated with the report is "Cenospheres Market," which aids in identifying and referencing the specific market segment covered.
12. How do I determine which pricing option suits my needs best?
The pricing options vary based on user requirements and access needs. Individual users may opt for single-user licenses, while businesses requiring broader access may choose multi-user or enterprise licenses for cost-effective access to the report.
13. Are there any additional resources or data provided in the Cenospheres Market report?
While the report offers comprehensive insights, it's advisable to review the specific contents or supplementary materials provided to ascertain if additional resources or data are available.
14. How can I stay updated on further developments or reports in the Cenospheres Market?
To stay informed about further developments, trends, and reports in the Cenospheres Market, consider subscribing to industry newsletters, following relevant companies and organizations, or regularly checking reputable industry news sources and publications.
Methodology
Step 1 - Identification of Relevant Samples Size from Population Database


Step 2 - Approaches for Defining Global Market Size (Value, Volume* & Price*)

Note*: In applicable scenarios
Step 3 - Data Sources
Primary Research
- Web Analytics
- Survey Reports
- Research Institute
- Latest Research Reports
- Opinion Leaders
Secondary Research
- Annual Reports
- White Paper
- Latest Press Release
- Industry Association
- Paid Database
- Investor Presentations

Step 4 - Data Triangulation
Involves using different sources of information in order to increase the validity of a study
These sources are likely to be stakeholders in a program - participants, other researchers, program staff, other community members, and so on.
Then we put all data in single framework & apply various statistical tools to find out the dynamic on the market.
During the analysis stage, feedback from the stakeholder groups would be compared to determine areas of agreement as well as areas of divergence


