
Key Insights
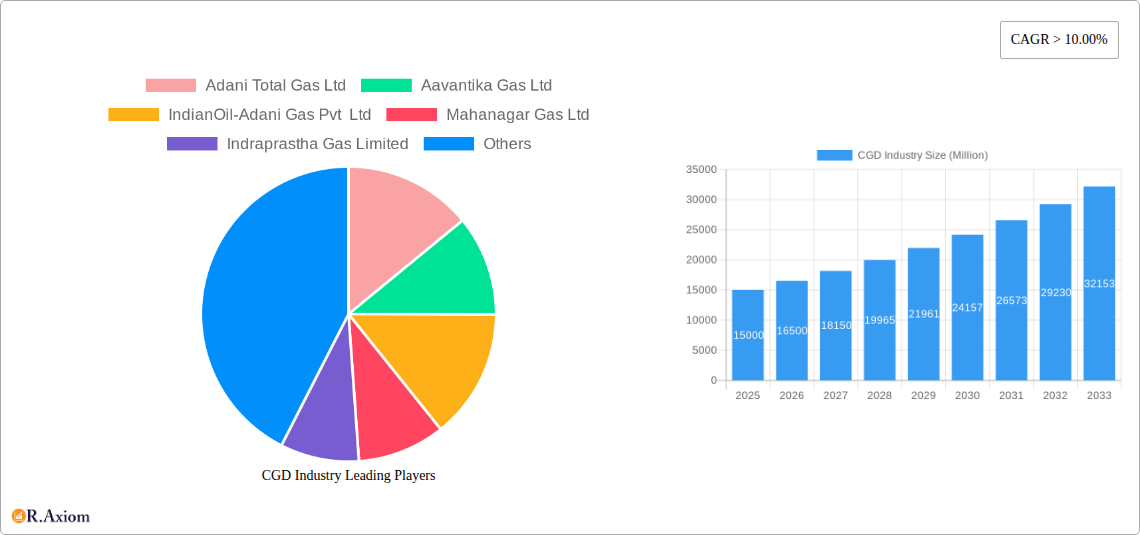
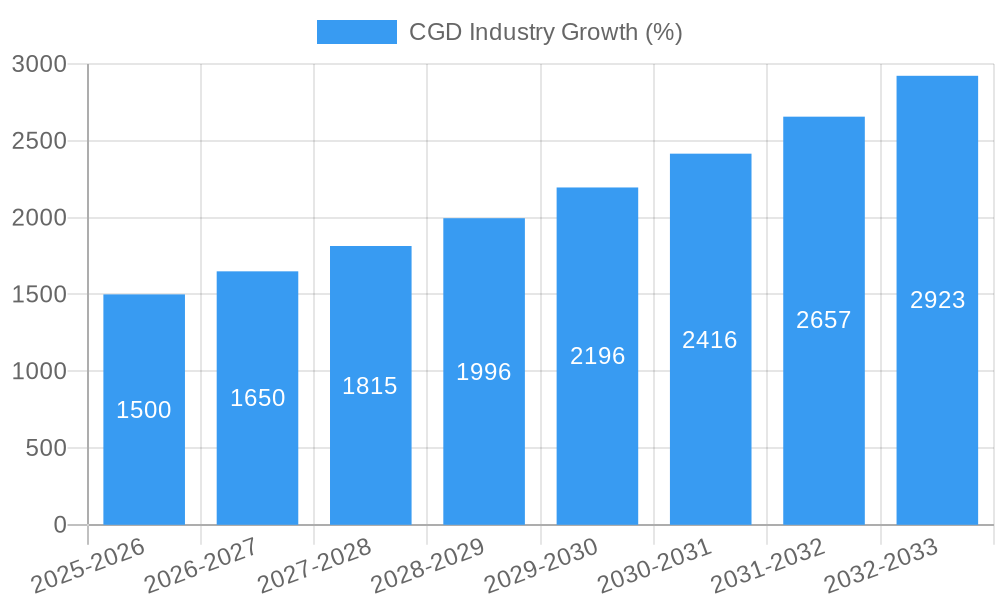
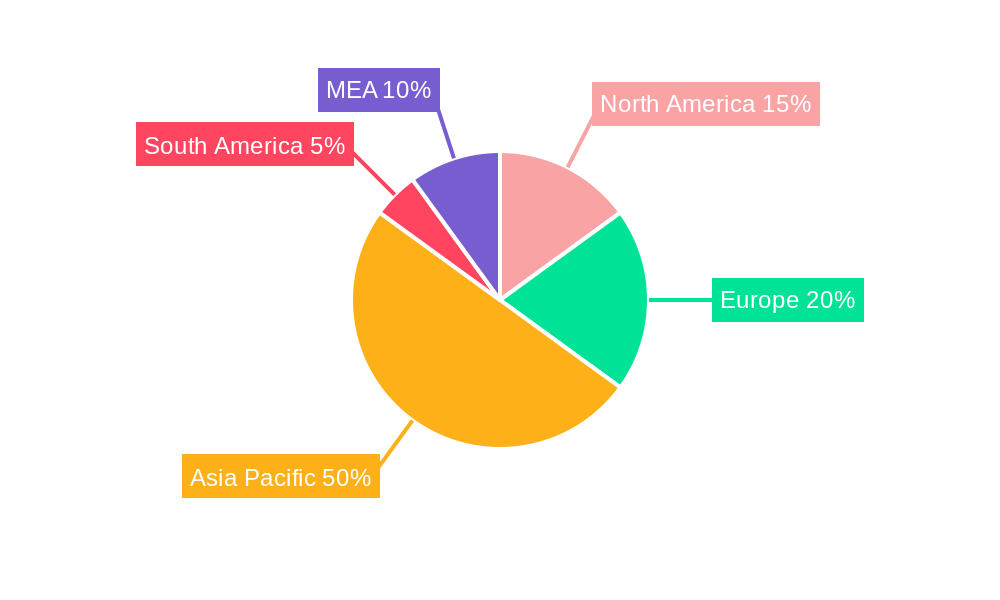
The Compressed Natural Gas (CNG) and Pipelined Natural Gas (PNG) distribution (CGD) industry is experiencing robust growth, driven by increasing urbanization, rising energy demand, and government initiatives promoting cleaner fuels. A CAGR exceeding 10% indicates significant expansion potential through 2033. The automotive sector remains a major end-user, fueled by the cost-effectiveness and environmental benefits of CNG vehicles compared to gasoline and diesel. However, growth is also being witnessed in the residential, commercial, and industrial segments, as consumers and businesses increasingly adopt natural gas for heating, cooking, and industrial processes. Key players like Adani Total Gas, Mahanagar Gas, and Indraprastha Gas are strategically expanding their networks and customer bases to capitalize on this growth. While regulatory hurdles and infrastructure limitations pose some challenges, the long-term outlook for the CGD industry remains positive, particularly in rapidly developing economies within the Asia-Pacific region, specifically India and China, where demand is surging. The increasing focus on reducing carbon emissions and improving air quality is further bolstering the industry's prospects, making natural gas a crucial transition fuel in the energy mix.
Geographical expansion is a key strategy for CGD companies. While the Asia-Pacific region currently dominates the market, significant growth opportunities exist in other regions. North America and Europe, with their established infrastructure and regulatory frameworks, are expected to witness steady growth. However, South America, the Middle East, and Africa present emerging markets with considerable untapped potential, driven by increasing infrastructure development and government support for CGD networks. The competitive landscape is dynamic, characterized by mergers, acquisitions, and collaborations among existing players and the entry of new participants. Future success will depend on companies' ability to adapt to evolving technological advancements, manage operational efficiencies, and meet the growing demands of a diverse customer base. Technological innovations such as smart metering and digital platforms are also improving efficiency and customer engagement.
India CGD Industry Market Report: 2019-2033
This comprehensive report provides an in-depth analysis of the Indian City Gas Distribution (CGD) industry, offering crucial insights for stakeholders seeking to understand the market's dynamics, growth potential, and future trends. The study covers the period 2019-2033, with a base year of 2025 and a forecast period of 2025-2033. The report analyzes key players, market segments, and growth drivers, providing actionable intelligence for strategic decision-making. The market size is estimated at xx Million USD in 2025 and is projected to reach xx Million USD by 2033, exhibiting a significant CAGR of xx%.
CGD Industry Market Concentration & Innovation
The Indian CGD market exhibits a moderately concentrated landscape, with key players like Adani Total Gas Ltd, Mahanagar Gas Ltd, Indraprastha Gas Limited, and GAIL Gas Limited holding significant market share. Market concentration is influenced by factors like licensing rounds, government policies, and the capital-intensive nature of CGD infrastructure development. Innovation in the sector is driven by technological advancements in pipeline infrastructure, CNG station technology, and the integration of smart metering systems. Regulatory frameworks, while supportive of CGD expansion, are subject to periodic revisions influencing investment decisions. Product substitution pressure is relatively low, given the established preference for natural gas as a cleaner fuel. However, competition from other energy sources remains a factor. M&A activities are frequent, with deal values exceeding xx Million USD in recent years, reflecting consolidation and expansion strategies within the industry. This trend is projected to continue as companies strive for greater market share and geographical reach.
- Market Share: Adani Total Gas Ltd holds approximately xx% market share, followed by Mahanagar Gas Ltd with xx%, and Indraprastha Gas Limited with xx%.
- M&A Deal Values (2019-2024): Total value estimated at xx Million USD.
- Key Innovation Drivers: Smart metering, pipeline optimization, CNG station automation.
- Regulatory Changes: Ongoing regulatory revisions to encourage greater efficiency and penetration.
CGD Industry Industry Trends & Insights
The Indian CGD industry is experiencing robust growth driven by increasing urbanization, rising energy demand, favorable government policies promoting cleaner fuel adoption, and the expanding automotive and industrial sectors. The growth is particularly pronounced in residential and commercial segments due to rising disposable incomes and awareness of environmental concerns. Technological advancements, such as the adoption of smart metering and automated CNG dispensing systems, are enhancing efficiency and reducing operational costs. Consumer preferences are shifting towards cleaner, more reliable, and cost-effective energy solutions, favoring natural gas. Competitive dynamics are intensifying as new players enter the market and existing players expand their reach. The market penetration rate for CNG and PNG is expected to increase significantly over the forecast period.
Dominant Markets & Segments in CGD Industry
The Indian CGD market is dominated by the northern and western regions, which boast robust infrastructure and high energy consumption rates. The residential and commercial segments exhibit particularly high growth due to increasing urbanization and rising disposable incomes. Key growth drivers include:
- Economic Policies: Government incentives and subsidies for CGD infrastructure development.
- Infrastructure Development: Expansion of pipeline networks and increase in the number of CNG stations.
Dominant Segment Analysis:
- PNG Connections: The residential sector dominates PNG consumption, driven by rising demand for cleaner cooking fuel.
- CNG Connections: The automotive sector is the major consumer of CNG, boosted by government incentives for CNG vehicles.
The industrial segment's growth is primarily influenced by the expansion of industrial activities in certain regions. The commercial sector is witnessing increasing adoption of natural gas for heating and other industrial applications. This widespread growth is anticipated to remain steady over the forecast period.
CGD Industry Product Developments
Recent product innovations in the CGD sector include the adoption of smart metering systems for accurate gas consumption monitoring, improved CNG dispensing technologies for enhanced efficiency and safety, and the development of advanced pipeline materials for increased durability and reduced leakage. These innovations aim to improve operational efficiency, customer experience, and environmental sustainability. These technological advancements are improving market competitiveness by providing cost-effective and efficient solutions to consumers, thereby driving demand for CGD services.
Report Scope & Segmentation Analysis
This report segments the Indian CGD market based on connection type (Pipeline Natural Gas (PNG) and Compressed Natural Gas (CNG)) and end-user (Automotive, Residential, Commercial, and Industrial).
PNG Connections: The PNG segment is projected to grow at a CAGR of xx% during the forecast period, driven by increasing residential and commercial demand. Competitive dynamics in this segment are shaped by infrastructure development and the expansion of pipeline networks.
CNG Connections: The CNG segment is expected to grow at a CAGR of xx% due to rising adoption of CNG vehicles and government initiatives. Competition is intense among existing players, driven by the increasing number of CNG fueling stations.
End-User Segments: Each end-user segment exhibits unique growth patterns. The automotive segment experiences the strongest growth, while residential and commercial segments follow closely behind. The industrial segment's growth is tied to industrial expansion and government regulations.
Key Drivers of CGD Industry Growth
The growth of the Indian CGD industry is propelled by several key factors: the government's unwavering support for cleaner energy solutions, the rising demand for natural gas in various sectors, substantial investments in infrastructure development, and technological advancements that boost efficiency and sustainability. Government policies, such as subsidies for CNG vehicles and infrastructure development projects, have significantly contributed to increased adoption rates.
Challenges in the CGD Industry Sector
Despite its growth potential, the CGD industry faces various challenges. These include securing environmental clearances for pipeline expansion projects, the high capital investment requirements for infrastructure development, and logistical complexities in setting up distribution networks in densely populated areas. Competition among existing players and the potential entry of new players also adds pressure to margins. These factors can influence market dynamics by slowing down expansion plans and limiting market penetration in certain areas.
Emerging Opportunities in CGD Industry
Emerging opportunities for the CGD industry include the expansion into underserved regions, the development of integrated energy solutions combining natural gas with renewable energy sources, and the exploration of new applications for natural gas in emerging sectors such as industrial power generation. The growth of electric vehicles might pose a medium-term challenge to the CNG segment but also present opportunities for combined charging and CNG fueling infrastructure. These developments will create new avenues for market penetration and revenue generation.
Leading Players in the CGD Industry Market
- Adani Total Gas Ltd
- Aavantika Gas Ltd
- IndianOil-Adani Gas Pvt Ltd
- Mahanagar Gas Ltd
- Indraprastha Gas Limited
- Assam Gas Company Ltd
- Sabarmati Gas Ltd
- GAIL Gas Limited
- SKN-Haryana City Gas Distribution Pvt Ltd
- Gujarat Gas Ltd
- Torrent Group
Key Developments in CGD Industry Industry
July 2022: The petroleum ministry announced plans to establish 3,500 new CNG stations across India within two years, significantly boosting the CNG infrastructure. This initiative will have a substantial impact on market growth by increasing CNG accessibility.
January 2022: Bharat Petroleum Corporation Ltd (BPCL) committed USD 1.35 Billion towards expanding city gas distribution networks, underscoring the significant private investment flowing into the sector and signaling future market expansion.
Strategic Outlook for CGD Industry Market
The Indian CGD industry is poised for significant growth over the coming decade, fueled by strong government support, rising energy demand, and technological advancements. The market presents lucrative opportunities for existing players to expand their networks and for new entrants to establish a foothold. Strategic partnerships and investments in innovative technologies will be crucial for success in this dynamic and expanding market. Further diversification into related areas, like renewable energy integration, will present promising long-term growth potential.
CGD Industry Segmentation
-
1. Type
- 1.1. Pipeline Natural Gas (PNG) Connections
- 1.2. Compressed Natural Gas (CNG) Connections
-
2. End User
- 2.1. Automotive
- 2.2. Residential
- 2.3. Commercial
- 2.4. Industrial
CGD Industry Segmentation By Geography
-
1. North America
- 1.1. United States
- 1.2. Canada
- 1.3. Mexico
-
2. South America
- 2.1. Brazil
- 2.2. Argentina
- 2.3. Rest of South America
-
3. Europe
- 3.1. United Kingdom
- 3.2. Germany
- 3.3. France
- 3.4. Italy
- 3.5. Spain
- 3.6. Russia
- 3.7. Benelux
- 3.8. Nordics
- 3.9. Rest of Europe
-
4. Middle East & Africa
- 4.1. Turkey
- 4.2. Israel
- 4.3. GCC
- 4.4. North Africa
- 4.5. South Africa
- 4.6. Rest of Middle East & Africa
-
5. Asia Pacific
- 5.1. China
- 5.2. India
- 5.3. Japan
- 5.4. South Korea
- 5.5. ASEAN
- 5.6. Oceania
- 5.7. Rest of Asia Pacific
CGD Industry REPORT HIGHLIGHTS
| Aspects | Details |
|---|---|
| Study Period | 2019-2033 |
| Base Year | 2024 |
| Estimated Year | 2025 |
| Forecast Period | 2025-2033 |
| Historical Period | 2019-2024 |
| Growth Rate | CAGR of > 10.00% from 2019-2033 |
| Segmentation |
|
Table of Contents
- 1. Introduction
- 1.1. Research Scope
- 1.2. Market Segmentation
- 1.3. Research Methodology
- 1.4. Definitions and Assumptions
- 2. Executive Summary
- 2.1. Introduction
- 3. Market Dynamics
- 3.1. Introduction
- 3.2. Market Drivers
- 3.2.1. 4.; Growing Vehicle Ownership4.; Government Initiatives
- 3.3. Market Restrains
- 3.3.1. 4.; Volatile Crude Oil Prices
- 3.4. Market Trends
- 3.4.1. PNG Connections are Likely to Dominate the Market
- 4. Market Factor Analysis
- 4.1. Porters Five Forces
- 4.2. Supply/Value Chain
- 4.3. PESTEL analysis
- 4.4. Market Entropy
- 4.5. Patent/Trademark Analysis
- 5. Global CGD Industry Analysis, Insights and Forecast, 2019-2031
- 5.1. Market Analysis, Insights and Forecast - by Type
- 5.1.1. Pipeline Natural Gas (PNG) Connections
- 5.1.2. Compressed Natural Gas (CNG) Connections
- 5.2. Market Analysis, Insights and Forecast - by End User
- 5.2.1. Automotive
- 5.2.2. Residential
- 5.2.3. Commercial
- 5.2.4. Industrial
- 5.3. Market Analysis, Insights and Forecast - by Region
- 5.3.1. North America
- 5.3.2. South America
- 5.3.3. Europe
- 5.3.4. Middle East & Africa
- 5.3.5. Asia Pacific
- 5.1. Market Analysis, Insights and Forecast - by Type
- 6. North America CGD Industry Analysis, Insights and Forecast, 2019-2031
- 6.1. Market Analysis, Insights and Forecast - by Type
- 6.1.1. Pipeline Natural Gas (PNG) Connections
- 6.1.2. Compressed Natural Gas (CNG) Connections
- 6.2. Market Analysis, Insights and Forecast - by End User
- 6.2.1. Automotive
- 6.2.2. Residential
- 6.2.3. Commercial
- 6.2.4. Industrial
- 6.1. Market Analysis, Insights and Forecast - by Type
- 7. South America CGD Industry Analysis, Insights and Forecast, 2019-2031
- 7.1. Market Analysis, Insights and Forecast - by Type
- 7.1.1. Pipeline Natural Gas (PNG) Connections
- 7.1.2. Compressed Natural Gas (CNG) Connections
- 7.2. Market Analysis, Insights and Forecast - by End User
- 7.2.1. Automotive
- 7.2.2. Residential
- 7.2.3. Commercial
- 7.2.4. Industrial
- 7.1. Market Analysis, Insights and Forecast - by Type
- 8. Europe CGD Industry Analysis, Insights and Forecast, 2019-2031
- 8.1. Market Analysis, Insights and Forecast - by Type
- 8.1.1. Pipeline Natural Gas (PNG) Connections
- 8.1.2. Compressed Natural Gas (CNG) Connections
- 8.2. Market Analysis, Insights and Forecast - by End User
- 8.2.1. Automotive
- 8.2.2. Residential
- 8.2.3. Commercial
- 8.2.4. Industrial
- 8.1. Market Analysis, Insights and Forecast - by Type
- 9. Middle East & Africa CGD Industry Analysis, Insights and Forecast, 2019-2031
- 9.1. Market Analysis, Insights and Forecast - by Type
- 9.1.1. Pipeline Natural Gas (PNG) Connections
- 9.1.2. Compressed Natural Gas (CNG) Connections
- 9.2. Market Analysis, Insights and Forecast - by End User
- 9.2.1. Automotive
- 9.2.2. Residential
- 9.2.3. Commercial
- 9.2.4. Industrial
- 9.1. Market Analysis, Insights and Forecast - by Type
- 10. Asia Pacific CGD Industry Analysis, Insights and Forecast, 2019-2031
- 10.1. Market Analysis, Insights and Forecast - by Type
- 10.1.1. Pipeline Natural Gas (PNG) Connections
- 10.1.2. Compressed Natural Gas (CNG) Connections
- 10.2. Market Analysis, Insights and Forecast - by End User
- 10.2.1. Automotive
- 10.2.2. Residential
- 10.2.3. Commercial
- 10.2.4. Industrial
- 10.1. Market Analysis, Insights and Forecast - by Type
- 11. North America CGD Industry Analysis, Insights and Forecast, 2019-2031
- 11.1. Market Analysis, Insights and Forecast - By Country/Sub-region
- 11.1.1. United States Canada Mexico
- 12. South America CGD Industry Analysis, Insights and Forecast, 2019-2031
- 12.1. Market Analysis, Insights and Forecast - By Country/Sub-region
- 12.1.1 Brazil
- 12.1.2 Argentina
- 12.1.3 Rest of South America
- 13. Asia Pacific CGD Industry Analysis, Insights and Forecast, 2019-2031
- 13.1. Market Analysis, Insights and Forecast - By Country/Sub-region
- 13.1.1 China
- 13.1.2 Japan
- 13.1.3 India
- 13.1.4 South Korea
- 13.1.5 Taiwan
- 13.1.6 Australia
- 13.1.7 Rest of Asia-Pacific
- 14. Europe CGD Industry Analysis, Insights and Forecast, 2019-2031
- 14.1. Market Analysis, Insights and Forecast - By Country/Sub-region
- 14.1.1. Germany
- 15. MEA CGD Industry Analysis, Insights and Forecast, 2019-2031
- 15.1. Market Analysis, Insights and Forecast - By Country/Sub-region
- 15.1.1 Middle East
- 15.1.2 Africa
- 16. Competitive Analysis
- 16.1. Global Market Share Analysis 2024
- 16.2. Company Profiles
- 16.2.1 Adani Total Gas Ltd
- 16.2.1.1. Overview
- 16.2.1.2. Products
- 16.2.1.3. SWOT Analysis
- 16.2.1.4. Recent Developments
- 16.2.1.5. Financials (Based on Availability)
- 16.2.2 Aavantika Gas Ltd
- 16.2.2.1. Overview
- 16.2.2.2. Products
- 16.2.2.3. SWOT Analysis
- 16.2.2.4. Recent Developments
- 16.2.2.5. Financials (Based on Availability)
- 16.2.3 IndianOil-Adani Gas Pvt Ltd
- 16.2.3.1. Overview
- 16.2.3.2. Products
- 16.2.3.3. SWOT Analysis
- 16.2.3.4. Recent Developments
- 16.2.3.5. Financials (Based on Availability)
- 16.2.4 Mahanagar Gas Ltd
- 16.2.4.1. Overview
- 16.2.4.2. Products
- 16.2.4.3. SWOT Analysis
- 16.2.4.4. Recent Developments
- 16.2.4.5. Financials (Based on Availability)
- 16.2.5 Indraprastha Gas Limited
- 16.2.5.1. Overview
- 16.2.5.2. Products
- 16.2.5.3. SWOT Analysis
- 16.2.5.4. Recent Developments
- 16.2.5.5. Financials (Based on Availability)
- 16.2.6 Assam Gas Company Ltd
- 16.2.6.1. Overview
- 16.2.6.2. Products
- 16.2.6.3. SWOT Analysis
- 16.2.6.4. Recent Developments
- 16.2.6.5. Financials (Based on Availability)
- 16.2.7 Sabarmati Gas Ltd
- 16.2.7.1. Overview
- 16.2.7.2. Products
- 16.2.7.3. SWOT Analysis
- 16.2.7.4. Recent Developments
- 16.2.7.5. Financials (Based on Availability)
- 16.2.8 GAIL Gas Limited
- 16.2.8.1. Overview
- 16.2.8.2. Products
- 16.2.8.3. SWOT Analysis
- 16.2.8.4. Recent Developments
- 16.2.8.5. Financials (Based on Availability)
- 16.2.9 SKN-Haryana City Gas Distribution Pvt Ltd
- 16.2.9.1. Overview
- 16.2.9.2. Products
- 16.2.9.3. SWOT Analysis
- 16.2.9.4. Recent Developments
- 16.2.9.5. Financials (Based on Availability)
- 16.2.10 Gujarat Gas Ltd
- 16.2.10.1. Overview
- 16.2.10.2. Products
- 16.2.10.3. SWOT Analysis
- 16.2.10.4. Recent Developments
- 16.2.10.5. Financials (Based on Availability)
- 16.2.11 Torrent Group
- 16.2.11.1. Overview
- 16.2.11.2. Products
- 16.2.11.3. SWOT Analysis
- 16.2.11.4. Recent Developments
- 16.2.11.5. Financials (Based on Availability)
- 16.2.1 Adani Total Gas Ltd
List of Figures
- Figure 1: Global CGD Industry Revenue Breakdown (Million, %) by Region 2024 & 2032
- Figure 2: North America CGD Industry Revenue (Million), by Country 2024 & 2032
- Figure 3: North America CGD Industry Revenue Share (%), by Country 2024 & 2032
- Figure 4: South America CGD Industry Revenue (Million), by Country 2024 & 2032
- Figure 5: South America CGD Industry Revenue Share (%), by Country 2024 & 2032
- Figure 6: Asia Pacific CGD Industry Revenue (Million), by Country 2024 & 2032
- Figure 7: Asia Pacific CGD Industry Revenue Share (%), by Country 2024 & 2032
- Figure 8: Europe CGD Industry Revenue (Million), by Country 2024 & 2032
- Figure 9: Europe CGD Industry Revenue Share (%), by Country 2024 & 2032
- Figure 10: MEA CGD Industry Revenue (Million), by Country 2024 & 2032
- Figure 11: MEA CGD Industry Revenue Share (%), by Country 2024 & 2032
- Figure 12: North America CGD Industry Revenue (Million), by Type 2024 & 2032
- Figure 13: North America CGD Industry Revenue Share (%), by Type 2024 & 2032
- Figure 14: North America CGD Industry Revenue (Million), by End User 2024 & 2032
- Figure 15: North America CGD Industry Revenue Share (%), by End User 2024 & 2032
- Figure 16: North America CGD Industry Revenue (Million), by Country 2024 & 2032
- Figure 17: North America CGD Industry Revenue Share (%), by Country 2024 & 2032
- Figure 18: South America CGD Industry Revenue (Million), by Type 2024 & 2032
- Figure 19: South America CGD Industry Revenue Share (%), by Type 2024 & 2032
- Figure 20: South America CGD Industry Revenue (Million), by End User 2024 & 2032
- Figure 21: South America CGD Industry Revenue Share (%), by End User 2024 & 2032
- Figure 22: South America CGD Industry Revenue (Million), by Country 2024 & 2032
- Figure 23: South America CGD Industry Revenue Share (%), by Country 2024 & 2032
- Figure 24: Europe CGD Industry Revenue (Million), by Type 2024 & 2032
- Figure 25: Europe CGD Industry Revenue Share (%), by Type 2024 & 2032
- Figure 26: Europe CGD Industry Revenue (Million), by End User 2024 & 2032
- Figure 27: Europe CGD Industry Revenue Share (%), by End User 2024 & 2032
- Figure 28: Europe CGD Industry Revenue (Million), by Country 2024 & 2032
- Figure 29: Europe CGD Industry Revenue Share (%), by Country 2024 & 2032
- Figure 30: Middle East & Africa CGD Industry Revenue (Million), by Type 2024 & 2032
- Figure 31: Middle East & Africa CGD Industry Revenue Share (%), by Type 2024 & 2032
- Figure 32: Middle East & Africa CGD Industry Revenue (Million), by End User 2024 & 2032
- Figure 33: Middle East & Africa CGD Industry Revenue Share (%), by End User 2024 & 2032
- Figure 34: Middle East & Africa CGD Industry Revenue (Million), by Country 2024 & 2032
- Figure 35: Middle East & Africa CGD Industry Revenue Share (%), by Country 2024 & 2032
- Figure 36: Asia Pacific CGD Industry Revenue (Million), by Type 2024 & 2032
- Figure 37: Asia Pacific CGD Industry Revenue Share (%), by Type 2024 & 2032
- Figure 38: Asia Pacific CGD Industry Revenue (Million), by End User 2024 & 2032
- Figure 39: Asia Pacific CGD Industry Revenue Share (%), by End User 2024 & 2032
- Figure 40: Asia Pacific CGD Industry Revenue (Million), by Country 2024 & 2032
- Figure 41: Asia Pacific CGD Industry Revenue Share (%), by Country 2024 & 2032
List of Tables
- Table 1: Global CGD Industry Revenue Million Forecast, by Region 2019 & 2032
- Table 2: Global CGD Industry Revenue Million Forecast, by Type 2019 & 2032
- Table 3: Global CGD Industry Revenue Million Forecast, by End User 2019 & 2032
- Table 4: Global CGD Industry Revenue Million Forecast, by Region 2019 & 2032
- Table 5: Global CGD Industry Revenue Million Forecast, by Country 2019 & 2032
- Table 6: United States Canada Mexico CGD Industry Revenue (Million) Forecast, by Application 2019 & 2032
- Table 7: Global CGD Industry Revenue Million Forecast, by Country 2019 & 2032
- Table 8: Brazil CGD Industry Revenue (Million) Forecast, by Application 2019 & 2032
- Table 9: Argentina CGD Industry Revenue (Million) Forecast, by Application 2019 & 2032
- Table 10: Rest of South America CGD Industry Revenue (Million) Forecast, by Application 2019 & 2032
- Table 11: Global CGD Industry Revenue Million Forecast, by Country 2019 & 2032
- Table 12: China CGD Industry Revenue (Million) Forecast, by Application 2019 & 2032
- Table 13: Japan CGD Industry Revenue (Million) Forecast, by Application 2019 & 2032
- Table 14: India CGD Industry Revenue (Million) Forecast, by Application 2019 & 2032
- Table 15: South Korea CGD Industry Revenue (Million) Forecast, by Application 2019 & 2032
- Table 16: Taiwan CGD Industry Revenue (Million) Forecast, by Application 2019 & 2032
- Table 17: Australia CGD Industry Revenue (Million) Forecast, by Application 2019 & 2032
- Table 18: Rest of Asia-Pacific CGD Industry Revenue (Million) Forecast, by Application 2019 & 2032
- Table 19: Global CGD Industry Revenue Million Forecast, by Country 2019 & 2032
- Table 20: Germany CGD Industry Revenue (Million) Forecast, by Application 2019 & 2032
- Table 21: Global CGD Industry Revenue Million Forecast, by Country 2019 & 2032
- Table 22: Middle East CGD Industry Revenue (Million) Forecast, by Application 2019 & 2032
- Table 23: Africa CGD Industry Revenue (Million) Forecast, by Application 2019 & 2032
- Table 24: Global CGD Industry Revenue Million Forecast, by Type 2019 & 2032
- Table 25: Global CGD Industry Revenue Million Forecast, by End User 2019 & 2032
- Table 26: Global CGD Industry Revenue Million Forecast, by Country 2019 & 2032
- Table 27: United States CGD Industry Revenue (Million) Forecast, by Application 2019 & 2032
- Table 28: Canada CGD Industry Revenue (Million) Forecast, by Application 2019 & 2032
- Table 29: Mexico CGD Industry Revenue (Million) Forecast, by Application 2019 & 2032
- Table 30: Global CGD Industry Revenue Million Forecast, by Type 2019 & 2032
- Table 31: Global CGD Industry Revenue Million Forecast, by End User 2019 & 2032
- Table 32: Global CGD Industry Revenue Million Forecast, by Country 2019 & 2032
- Table 33: Brazil CGD Industry Revenue (Million) Forecast, by Application 2019 & 2032
- Table 34: Argentina CGD Industry Revenue (Million) Forecast, by Application 2019 & 2032
- Table 35: Rest of South America CGD Industry Revenue (Million) Forecast, by Application 2019 & 2032
- Table 36: Global CGD Industry Revenue Million Forecast, by Type 2019 & 2032
- Table 37: Global CGD Industry Revenue Million Forecast, by End User 2019 & 2032
- Table 38: Global CGD Industry Revenue Million Forecast, by Country 2019 & 2032
- Table 39: United Kingdom CGD Industry Revenue (Million) Forecast, by Application 2019 & 2032
- Table 40: Germany CGD Industry Revenue (Million) Forecast, by Application 2019 & 2032
- Table 41: France CGD Industry Revenue (Million) Forecast, by Application 2019 & 2032
- Table 42: Italy CGD Industry Revenue (Million) Forecast, by Application 2019 & 2032
- Table 43: Spain CGD Industry Revenue (Million) Forecast, by Application 2019 & 2032
- Table 44: Russia CGD Industry Revenue (Million) Forecast, by Application 2019 & 2032
- Table 45: Benelux CGD Industry Revenue (Million) Forecast, by Application 2019 & 2032
- Table 46: Nordics CGD Industry Revenue (Million) Forecast, by Application 2019 & 2032
- Table 47: Rest of Europe CGD Industry Revenue (Million) Forecast, by Application 2019 & 2032
- Table 48: Global CGD Industry Revenue Million Forecast, by Type 2019 & 2032
- Table 49: Global CGD Industry Revenue Million Forecast, by End User 2019 & 2032
- Table 50: Global CGD Industry Revenue Million Forecast, by Country 2019 & 2032
- Table 51: Turkey CGD Industry Revenue (Million) Forecast, by Application 2019 & 2032
- Table 52: Israel CGD Industry Revenue (Million) Forecast, by Application 2019 & 2032
- Table 53: GCC CGD Industry Revenue (Million) Forecast, by Application 2019 & 2032
- Table 54: North Africa CGD Industry Revenue (Million) Forecast, by Application 2019 & 2032
- Table 55: South Africa CGD Industry Revenue (Million) Forecast, by Application 2019 & 2032
- Table 56: Rest of Middle East & Africa CGD Industry Revenue (Million) Forecast, by Application 2019 & 2032
- Table 57: Global CGD Industry Revenue Million Forecast, by Type 2019 & 2032
- Table 58: Global CGD Industry Revenue Million Forecast, by End User 2019 & 2032
- Table 59: Global CGD Industry Revenue Million Forecast, by Country 2019 & 2032
- Table 60: China CGD Industry Revenue (Million) Forecast, by Application 2019 & 2032
- Table 61: India CGD Industry Revenue (Million) Forecast, by Application 2019 & 2032
- Table 62: Japan CGD Industry Revenue (Million) Forecast, by Application 2019 & 2032
- Table 63: South Korea CGD Industry Revenue (Million) Forecast, by Application 2019 & 2032
- Table 64: ASEAN CGD Industry Revenue (Million) Forecast, by Application 2019 & 2032
- Table 65: Oceania CGD Industry Revenue (Million) Forecast, by Application 2019 & 2032
- Table 66: Rest of Asia Pacific CGD Industry Revenue (Million) Forecast, by Application 2019 & 2032
Frequently Asked Questions
1. What is the projected Compound Annual Growth Rate (CAGR) of the CGD Industry?
The projected CAGR is approximately > 10.00%.
2. Which companies are prominent players in the CGD Industry?
Key companies in the market include Adani Total Gas Ltd, Aavantika Gas Ltd, IndianOil-Adani Gas Pvt Ltd, Mahanagar Gas Ltd, Indraprastha Gas Limited, Assam Gas Company Ltd, Sabarmati Gas Ltd, GAIL Gas Limited, SKN-Haryana City Gas Distribution Pvt Ltd, Gujarat Gas Ltd, Torrent Group.
3. What are the main segments of the CGD Industry?
The market segments include Type, End User.
4. Can you provide details about the market size?
The market size is estimated to be USD XX Million as of 2022.
5. What are some drivers contributing to market growth?
4.; Growing Vehicle Ownership4.; Government Initiatives.
6. What are the notable trends driving market growth?
PNG Connections are Likely to Dominate the Market.
7. Are there any restraints impacting market growth?
4.; Volatile Crude Oil Prices.
8. Can you provide examples of recent developments in the market?
In July 2022, the petroleum ministry announced that it planned to set up 3,500 CNG stations in India in the next two years. GAIL and nine of its CGD companies will set up these CNG stations in 41 geographical areas spread across 14 states.
9. What pricing options are available for accessing the report?
Pricing options include single-user, multi-user, and enterprise licenses priced at USD 3800, USD 4500, and USD 5800 respectively.
10. Is the market size provided in terms of value or volume?
The market size is provided in terms of value, measured in Million.
11. Are there any specific market keywords associated with the report?
Yes, the market keyword associated with the report is "CGD Industry," which aids in identifying and referencing the specific market segment covered.
12. How do I determine which pricing option suits my needs best?
The pricing options vary based on user requirements and access needs. Individual users may opt for single-user licenses, while businesses requiring broader access may choose multi-user or enterprise licenses for cost-effective access to the report.
13. Are there any additional resources or data provided in the CGD Industry report?
While the report offers comprehensive insights, it's advisable to review the specific contents or supplementary materials provided to ascertain if additional resources or data are available.
14. How can I stay updated on further developments or reports in the CGD Industry?
To stay informed about further developments, trends, and reports in the CGD Industry, consider subscribing to industry newsletters, following relevant companies and organizations, or regularly checking reputable industry news sources and publications.
Methodology
Step 1 - Identification of Relevant Samples Size from Population Database


Step 2 - Approaches for Defining Global Market Size (Value, Volume* & Price*)

Note*: In applicable scenarios
Step 3 - Data Sources
Primary Research
- Web Analytics
- Survey Reports
- Research Institute
- Latest Research Reports
- Opinion Leaders
Secondary Research
- Annual Reports
- White Paper
- Latest Press Release
- Industry Association
- Paid Database
- Investor Presentations

Step 4 - Data Triangulation
Involves using different sources of information in order to increase the validity of a study
These sources are likely to be stakeholders in a program - participants, other researchers, program staff, other community members, and so on.
Then we put all data in single framework & apply various statistical tools to find out the dynamic on the market.
During the analysis stage, feedback from the stakeholder groups would be compared to determine areas of agreement as well as areas of divergence


