
Key Insights
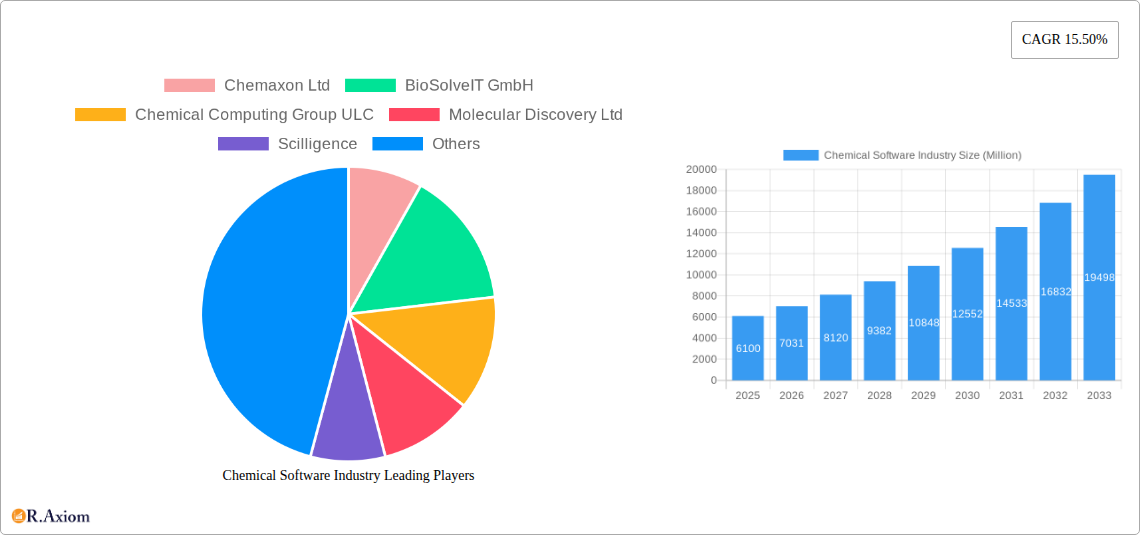
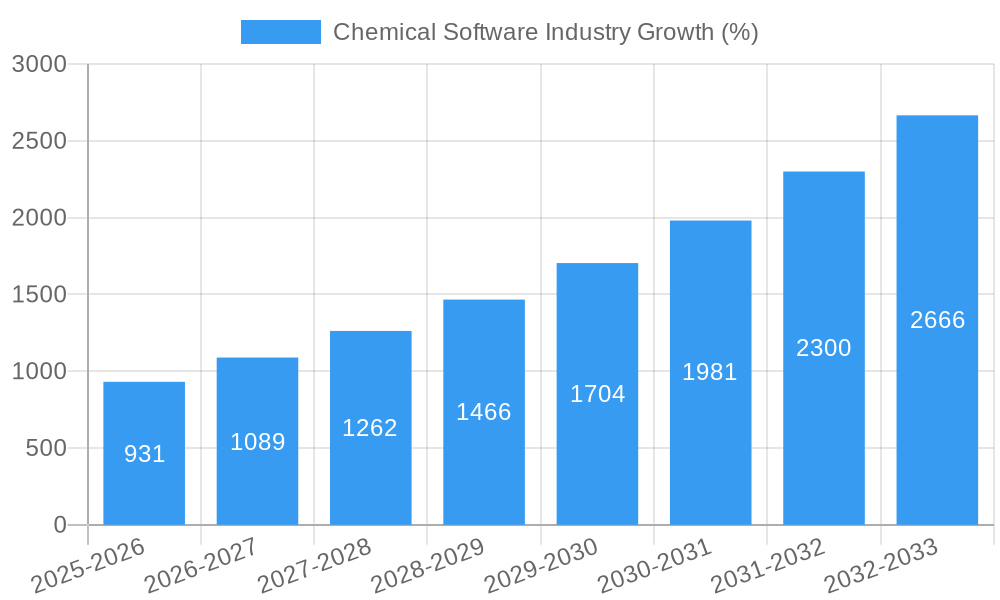
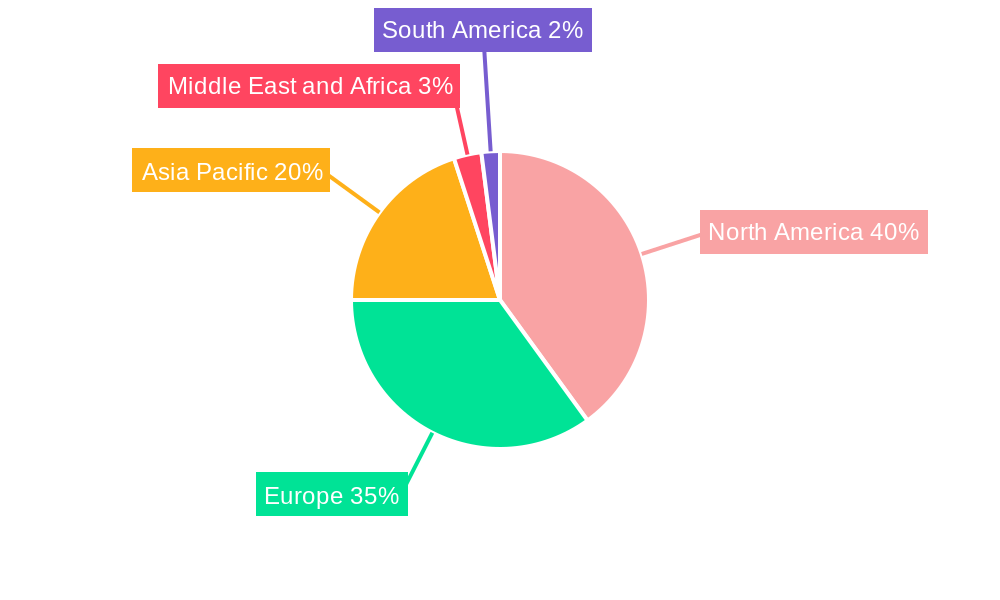
The chemical software market, valued at $6.10 billion in 2025, is experiencing robust growth, projected to expand at a Compound Annual Growth Rate (CAGR) of 15.5% from 2025 to 2033. This expansion is fueled by several key factors. The increasing demand for efficient drug discovery and validation processes within the pharmaceutical industry is a major driver. Virtual screening techniques, enabled by sophisticated chemical software, significantly accelerate lead compound identification, reducing research and development timelines and costs. Furthermore, the growing complexity of chemical reactions and the need for precise simulations are pushing adoption across various chemical analysis applications. The rising adoption of cloud-based solutions and advanced analytical capabilities, such as machine learning integration for predictive modeling, further contribute to market growth. Competition is intense, with established players like Schrödinger, Chemaxon, and BioSolveIT alongside emerging innovative companies continually striving to enhance their offerings. Geographic distribution shows a strong presence in North America and Europe, driven by established research institutions and pharmaceutical companies. However, the Asia-Pacific region, particularly China and India, is showing rapid growth, fueled by increasing R&D investments and a growing pharmaceutical sector. While data privacy concerns and the need for high computational power represent potential restraints, the overall market trajectory suggests a positive outlook for continued expansion in the coming years. The market segmentation, with a significant portion attributed to drug discovery and validation, indicates a strong correlation with the pharmaceutical industry's growth and technological advancements.
The continued development of artificial intelligence (AI) and machine learning (ML) algorithms within chemical software is expected to revolutionize various aspects of chemical research and development. This includes the ability to predict reaction outcomes more accurately, optimize synthesis pathways, and improve the design of novel molecules with desired properties. The integration of these technologies will lead to more efficient workflows, reduced costs associated with experimentation, and faster time-to-market for new chemicals and drugs. Moreover, the rising adoption of high-performance computing (HPC) resources will allow scientists to tackle increasingly complex simulations, ultimately pushing the boundaries of chemical innovation. The market will likely see further consolidation through mergers and acquisitions as companies seek to expand their product portfolios and gain a competitive edge. The focus on user-friendly interfaces and cloud-based accessibility will remain crucial to driving broader adoption across diverse user groups, from academic researchers to large-scale industrial applications.
Chemical Software Industry Market Report: 2019-2033
This comprehensive report provides a detailed analysis of the Chemical Software Industry, covering market trends, key players, and future growth prospects from 2019 to 2033. With a base year of 2025 and an estimated year of 2025, this report offers invaluable insights for industry stakeholders, investors, and researchers seeking to understand and capitalize on opportunities within this dynamic sector. The report incorporates data on market size (in Millions), CAGR, and market share, offering actionable intelligence for strategic decision-making.
Chemical Software Industry Market Concentration & Innovation
The Chemical Software Industry exhibits a moderately concentrated market structure, with several major players controlling a significant portion of the market share. While precise market share figures fluctuate, leading companies like Schrödinger Inc., Dassault Systèmes, and Cadence Design Systems (OpenEye Scientific Software) consistently hold substantial positions. The market is characterized by intense competition driven by continuous innovation in algorithms, artificial intelligence (AI) integration, and cloud-based solutions. Mergers and acquisitions (M&A) play a significant role in shaping the competitive landscape. For example, the xx Million acquisition of X company by Y company in 2022 significantly altered market dynamics. The total M&A value in the industry between 2019 and 2024 is estimated to be around xx Million. Regulatory frameworks, particularly concerning data privacy and intellectual property, significantly influence industry practices. Product substitutes, such as open-source software or in-house developed solutions, present a challenge, but their adoption is limited by the specialized nature of the software and the associated expertise required. End-user trends show a growing preference for cloud-based solutions and AI-powered tools to streamline workflows and improve efficiency.
- High Barrier to Entry: Significant capital investment and specialized expertise are required.
- Innovation Focus: AI integration, cloud computing, and advanced algorithms drive innovation.
- M&A Activity: Consolidation continues with strategic acquisitions impacting market share.
- Regulatory Landscape: Data privacy and intellectual property laws significantly impact operations.
Chemical Software Industry Industry Trends & Insights
The Chemical Software Industry is experiencing robust growth, driven by several key factors. The increasing demand for efficient drug discovery and development processes, coupled with the rising adoption of AI and machine learning in the chemical industry are key drivers for market expansion. The compound annual growth rate (CAGR) for the forecast period (2025-2033) is projected to be xx%, indicating substantial market expansion. Market penetration of advanced chemical software solutions is steadily increasing, particularly in the pharmaceutical and materials science sectors. Technological disruptions, such as the development of advanced algorithms and the increasing accessibility of high-performance computing, are continuously reshaping the industry landscape. Consumer preferences are shifting towards cloud-based, user-friendly platforms that facilitate collaboration and data sharing. Competitive dynamics remain intense, with companies focusing on differentiation through innovative features, superior customer support, and strategic partnerships.
Dominant Markets & Segments in Chemical Software Industry
The North American region currently holds the dominant position in the Chemical Software Industry, driven by strong R&D investments in the pharmaceutical and biotechnology sectors, robust infrastructure, and favorable economic policies. The Drug Discovery and Validation segment within Chemical Analysis shows the most significant growth potential.
- North America Dominance:
- High R&D spending in pharmaceuticals and biotechnology.
- Advanced infrastructure and computational resources.
- Supportive regulatory environment.
- Drug Discovery and Validation Segment:
- High demand for accelerated drug development.
- Growing adoption of AI and machine learning.
- Significant investment in computational chemistry.
- Virtual Screening: Rapid growth due to its ability to expedite drug discovery processes and reduce costs.
- Other Applications: Growth driven by expanding adoption across diverse chemical engineering applications.
Chemical Software Industry Product Developments
Recent product innovations showcase advancements in AI-powered molecular design, improved virtual screening capabilities, and enhanced data visualization tools. These developments offer enhanced accuracy, speed, and collaboration opportunities. The integration of cloud computing platforms further enhances accessibility and scalability. The market is witnessing a clear trend towards integrated software suites offering comprehensive solutions for various chemical processes, optimizing workflows and reducing the need for multiple disparate applications. This trend reflects a key competitive advantage for providers offering comprehensive solutions compared to niche players.
Report Scope & Segmentation Analysis
This report segments the Chemical Software Industry by application: Chemical Analysis, Drug Discovery and Validation, Virtual Screening, and Other Applications. Each segment is analyzed based on market size, growth projections, and competitive dynamics. The Drug Discovery and Validation segment is projected to witness the highest growth rate, driven by the increasing demand for efficient and cost-effective drug development processes. The Chemical Analysis segment is expected to maintain steady growth, propelled by the continuous advancements in analytical techniques and the need for accurate and reliable chemical analysis data. The virtual screening segment exhibits strong growth potential due to its efficiency in identifying potential drug candidates. Other applications represent a diverse range of industries and applications, contributing to overall market growth.
Key Drivers of Chemical Software Industry Growth
The Chemical Software Industry's growth is propelled by several key drivers, including:
- Technological Advancements: AI, machine learning, and cloud computing are revolutionizing chemical processes.
- Demand for Efficient Drug Discovery: The pharmaceutical industry’s need for faster and more cost-effective drug development fuels the demand for advanced software solutions.
- Stringent Regulatory Requirements: Increasing regulatory scrutiny necessitates the use of sophisticated software for data management and compliance.
Challenges in the Chemical Software Industry Sector
The industry faces several challenges, including:
- High Software Costs: Implementing and maintaining these advanced software solutions can be expensive, especially for smaller companies.
- Data Security Concerns: Sensitive chemical data necessitates robust security measures to prevent breaches and ensure compliance with data privacy regulations.
- Competition: The market is characterized by intense competition among established players and emerging startups, leading to pricing pressures.
Emerging Opportunities in Chemical Software Industry
Emerging opportunities abound in the Chemical Software Industry, particularly in:
- AI-driven Drug Design: Increased use of AI and machine learning in drug development offers significant opportunities for innovation.
- Expansion into New Markets: Growing demand in sectors like materials science and environmental monitoring creates new market opportunities.
- Development of Integrated Platforms: Offering comprehensive, integrated solutions presents a significant advantage in this competitive space.
Leading Players in the Chemical Software Industry Market
- Chemaxon Ltd
- BioSolveIT GmbH
- Chemical Computing Group ULC
- Molecular Discovery Ltd
- Scilligence
- Collaborative Drug Discovery Inc
- Jubilant Biosys Ltd
- Cadence Design Systems Inc (OpenEye Scientific Software Inc)
- Schrödinger Inc
- Dassault Systemes
Key Developments in Chemical Software Industry Industry
- October 2023: Cadence Molecular Sciences (OpenEye) announced an expanded agreement with Pfizer Inc. for access to its molecular design software. This highlights the increasing reliance on advanced software in early-stage drug discovery.
- June 2023: Vox Biomedical secured funding from NIGMS to develop an AI-based chemical identification library using GC-DMS technology, indicating growing interest in AI-driven analytical chemistry.
Strategic Outlook for Chemical Software Industry Market
The Chemical Software Industry is poised for continued growth, driven by technological advancements and increasing demand for efficient chemical processes across various sectors. The integration of AI and machine learning will continue to be a key driver of innovation, offering opportunities for enhanced accuracy, speed, and automation. Companies that can effectively leverage these technologies and adapt to the evolving needs of their customers will be best positioned for success in this competitive landscape. The market will continue to consolidate through mergers and acquisitions, and the emergence of cloud-based platforms and user-friendly interfaces will redefine how chemists and researchers utilize chemical software.
Chemical Software Industry Segmentation
-
1. Application
-
1.1. Chemical Analysis
- 1.1.1. Chemical Databases
- 1.1.2. Chemometrics
- 1.1.3. Molecular Modelling
- 1.1.4. Other Chemical Analysis
- 1.2. Drug Discovery and Validation
- 1.3. Virtual Screening
- 1.4. Other Applications
-
1.1. Chemical Analysis
Chemical Software Industry Segmentation By Geography
-
1. North America
- 1.1. United States
- 1.2. Canada
- 1.3. Mexico
-
2. Europe
- 2.1. Germany
- 2.2. United Kingdom
- 2.3. France
- 2.4. Italy
- 2.5. Spain
- 2.6. Rest of Europe
-
3. Asia Pacific
- 3.1. China
- 3.2. Japan
- 3.3. India
- 3.4. Australia
- 3.5. South Korea
- 3.6. Rest of Asia Pacific
-
4. Middle East and Africa
- 4.1. GCC
- 4.2. South Africa
- 4.3. Rest of Middle East and Africa
-
5. South America
- 5.1. Brazil
- 5.2. Argentina
- 5.3. Rest of South America
Chemical Software Industry REPORT HIGHLIGHTS
| Aspects | Details |
|---|---|
| Study Period | 2019-2033 |
| Base Year | 2024 |
| Estimated Year | 2025 |
| Forecast Period | 2025-2033 |
| Historical Period | 2019-2024 |
| Growth Rate | CAGR of 15.50% from 2019-2033 |
| Segmentation |
|
Table of Contents
- 1. Introduction
- 1.1. Research Scope
- 1.2. Market Segmentation
- 1.3. Research Methodology
- 1.4. Definitions and Assumptions
- 2. Executive Summary
- 2.1. Introduction
- 3. Market Dynamics
- 3.1. Introduction
- 3.2. Market Drivers
- 3.2.1. Innovations and Advancements in the Drug Development Process; Increased Demand of Personalized Medicine
- 3.3. Market Restrains
- 3.3.1. Lack of Skilled Labors
- 3.4. Market Trends
- 3.4.1. Virtual Screening Segment is Expected to Witness Growth in the Market Over the Forecast Period
- 4. Market Factor Analysis
- 4.1. Porters Five Forces
- 4.2. Supply/Value Chain
- 4.3. PESTEL analysis
- 4.4. Market Entropy
- 4.5. Patent/Trademark Analysis
- 5. Global Chemical Software Industry Analysis, Insights and Forecast, 2019-2031
- 5.1. Market Analysis, Insights and Forecast - by Application
- 5.1.1. Chemical Analysis
- 5.1.1.1. Chemical Databases
- 5.1.1.2. Chemometrics
- 5.1.1.3. Molecular Modelling
- 5.1.1.4. Other Chemical Analysis
- 5.1.2. Drug Discovery and Validation
- 5.1.3. Virtual Screening
- 5.1.4. Other Applications
- 5.1.1. Chemical Analysis
- 5.2. Market Analysis, Insights and Forecast - by Region
- 5.2.1. North America
- 5.2.2. Europe
- 5.2.3. Asia Pacific
- 5.2.4. Middle East and Africa
- 5.2.5. South America
- 5.1. Market Analysis, Insights and Forecast - by Application
- 6. North America Chemical Software Industry Analysis, Insights and Forecast, 2019-2031
- 6.1. Market Analysis, Insights and Forecast - by Application
- 6.1.1. Chemical Analysis
- 6.1.1.1. Chemical Databases
- 6.1.1.2. Chemometrics
- 6.1.1.3. Molecular Modelling
- 6.1.1.4. Other Chemical Analysis
- 6.1.2. Drug Discovery and Validation
- 6.1.3. Virtual Screening
- 6.1.4. Other Applications
- 6.1.1. Chemical Analysis
- 6.1. Market Analysis, Insights and Forecast - by Application
- 7. Europe Chemical Software Industry Analysis, Insights and Forecast, 2019-2031
- 7.1. Market Analysis, Insights and Forecast - by Application
- 7.1.1. Chemical Analysis
- 7.1.1.1. Chemical Databases
- 7.1.1.2. Chemometrics
- 7.1.1.3. Molecular Modelling
- 7.1.1.4. Other Chemical Analysis
- 7.1.2. Drug Discovery and Validation
- 7.1.3. Virtual Screening
- 7.1.4. Other Applications
- 7.1.1. Chemical Analysis
- 7.1. Market Analysis, Insights and Forecast - by Application
- 8. Asia Pacific Chemical Software Industry Analysis, Insights and Forecast, 2019-2031
- 8.1. Market Analysis, Insights and Forecast - by Application
- 8.1.1. Chemical Analysis
- 8.1.1.1. Chemical Databases
- 8.1.1.2. Chemometrics
- 8.1.1.3. Molecular Modelling
- 8.1.1.4. Other Chemical Analysis
- 8.1.2. Drug Discovery and Validation
- 8.1.3. Virtual Screening
- 8.1.4. Other Applications
- 8.1.1. Chemical Analysis
- 8.1. Market Analysis, Insights and Forecast - by Application
- 9. Middle East and Africa Chemical Software Industry Analysis, Insights and Forecast, 2019-2031
- 9.1. Market Analysis, Insights and Forecast - by Application
- 9.1.1. Chemical Analysis
- 9.1.1.1. Chemical Databases
- 9.1.1.2. Chemometrics
- 9.1.1.3. Molecular Modelling
- 9.1.1.4. Other Chemical Analysis
- 9.1.2. Drug Discovery and Validation
- 9.1.3. Virtual Screening
- 9.1.4. Other Applications
- 9.1.1. Chemical Analysis
- 9.1. Market Analysis, Insights and Forecast - by Application
- 10. South America Chemical Software Industry Analysis, Insights and Forecast, 2019-2031
- 10.1. Market Analysis, Insights and Forecast - by Application
- 10.1.1. Chemical Analysis
- 10.1.1.1. Chemical Databases
- 10.1.1.2. Chemometrics
- 10.1.1.3. Molecular Modelling
- 10.1.1.4. Other Chemical Analysis
- 10.1.2. Drug Discovery and Validation
- 10.1.3. Virtual Screening
- 10.1.4. Other Applications
- 10.1.1. Chemical Analysis
- 10.1. Market Analysis, Insights and Forecast - by Application
- 11. North America Chemical Software Industry Analysis, Insights and Forecast, 2019-2031
- 11.1. Market Analysis, Insights and Forecast - By Country/Sub-region
- 11.1.1 United States
- 11.1.2 Canada
- 11.1.3 Mexico
- 12. Europe Chemical Software Industry Analysis, Insights and Forecast, 2019-2031
- 12.1. Market Analysis, Insights and Forecast - By Country/Sub-region
- 12.1.1 Germany
- 12.1.2 United Kingdom
- 12.1.3 France
- 12.1.4 Italy
- 12.1.5 Spain
- 12.1.6 Rest of Europe
- 13. Asia Pacific Chemical Software Industry Analysis, Insights and Forecast, 2019-2031
- 13.1. Market Analysis, Insights and Forecast - By Country/Sub-region
- 13.1.1 China
- 13.1.2 Japan
- 13.1.3 India
- 13.1.4 Australia
- 13.1.5 South Korea
- 13.1.6 Rest of Asia Pacific
- 14. Middle East and Africa Chemical Software Industry Analysis, Insights and Forecast, 2019-2031
- 14.1. Market Analysis, Insights and Forecast - By Country/Sub-region
- 14.1.1 GCC
- 14.1.2 South Africa
- 14.1.3 Rest of Middle East and Africa
- 15. South America Chemical Software Industry Analysis, Insights and Forecast, 2019-2031
- 15.1. Market Analysis, Insights and Forecast - By Country/Sub-region
- 15.1.1 Brazil
- 15.1.2 Argentina
- 15.1.3 Rest of South America
- 16. Competitive Analysis
- 16.1. Global Market Share Analysis 2024
- 16.2. Company Profiles
- 16.2.1 Chemaxon Ltd
- 16.2.1.1. Overview
- 16.2.1.2. Products
- 16.2.1.3. SWOT Analysis
- 16.2.1.4. Recent Developments
- 16.2.1.5. Financials (Based on Availability)
- 16.2.2 BioSolveIT GmbH
- 16.2.2.1. Overview
- 16.2.2.2. Products
- 16.2.2.3. SWOT Analysis
- 16.2.2.4. Recent Developments
- 16.2.2.5. Financials (Based on Availability)
- 16.2.3 Chemical Computing Group ULC
- 16.2.3.1. Overview
- 16.2.3.2. Products
- 16.2.3.3. SWOT Analysis
- 16.2.3.4. Recent Developments
- 16.2.3.5. Financials (Based on Availability)
- 16.2.4 Molecular Discovery Ltd
- 16.2.4.1. Overview
- 16.2.4.2. Products
- 16.2.4.3. SWOT Analysis
- 16.2.4.4. Recent Developments
- 16.2.4.5. Financials (Based on Availability)
- 16.2.5 Scilligence
- 16.2.5.1. Overview
- 16.2.5.2. Products
- 16.2.5.3. SWOT Analysis
- 16.2.5.4. Recent Developments
- 16.2.5.5. Financials (Based on Availability)
- 16.2.6 Collaborative Drug Discovery Inc
- 16.2.6.1. Overview
- 16.2.6.2. Products
- 16.2.6.3. SWOT Analysis
- 16.2.6.4. Recent Developments
- 16.2.6.5. Financials (Based on Availability)
- 16.2.7 Jubilant Biosys Ltd
- 16.2.7.1. Overview
- 16.2.7.2. Products
- 16.2.7.3. SWOT Analysis
- 16.2.7.4. Recent Developments
- 16.2.7.5. Financials (Based on Availability)
- 16.2.8 Cadence Design Systems Inc (OpenEye Scientific Software Inc )
- 16.2.8.1. Overview
- 16.2.8.2. Products
- 16.2.8.3. SWOT Analysis
- 16.2.8.4. Recent Developments
- 16.2.8.5. Financials (Based on Availability)
- 16.2.9 Schrödinger Inc
- 16.2.9.1. Overview
- 16.2.9.2. Products
- 16.2.9.3. SWOT Analysis
- 16.2.9.4. Recent Developments
- 16.2.9.5. Financials (Based on Availability)
- 16.2.10 Dassault Systemes
- 16.2.10.1. Overview
- 16.2.10.2. Products
- 16.2.10.3. SWOT Analysis
- 16.2.10.4. Recent Developments
- 16.2.10.5. Financials (Based on Availability)
- 16.2.1 Chemaxon Ltd
List of Figures
- Figure 1: Global Chemical Software Industry Revenue Breakdown (Million, %) by Region 2024 & 2032
- Figure 2: North America Chemical Software Industry Revenue (Million), by Country 2024 & 2032
- Figure 3: North America Chemical Software Industry Revenue Share (%), by Country 2024 & 2032
- Figure 4: Europe Chemical Software Industry Revenue (Million), by Country 2024 & 2032
- Figure 5: Europe Chemical Software Industry Revenue Share (%), by Country 2024 & 2032
- Figure 6: Asia Pacific Chemical Software Industry Revenue (Million), by Country 2024 & 2032
- Figure 7: Asia Pacific Chemical Software Industry Revenue Share (%), by Country 2024 & 2032
- Figure 8: Middle East and Africa Chemical Software Industry Revenue (Million), by Country 2024 & 2032
- Figure 9: Middle East and Africa Chemical Software Industry Revenue Share (%), by Country 2024 & 2032
- Figure 10: South America Chemical Software Industry Revenue (Million), by Country 2024 & 2032
- Figure 11: South America Chemical Software Industry Revenue Share (%), by Country 2024 & 2032
- Figure 12: North America Chemical Software Industry Revenue (Million), by Application 2024 & 2032
- Figure 13: North America Chemical Software Industry Revenue Share (%), by Application 2024 & 2032
- Figure 14: North America Chemical Software Industry Revenue (Million), by Country 2024 & 2032
- Figure 15: North America Chemical Software Industry Revenue Share (%), by Country 2024 & 2032
- Figure 16: Europe Chemical Software Industry Revenue (Million), by Application 2024 & 2032
- Figure 17: Europe Chemical Software Industry Revenue Share (%), by Application 2024 & 2032
- Figure 18: Europe Chemical Software Industry Revenue (Million), by Country 2024 & 2032
- Figure 19: Europe Chemical Software Industry Revenue Share (%), by Country 2024 & 2032
- Figure 20: Asia Pacific Chemical Software Industry Revenue (Million), by Application 2024 & 2032
- Figure 21: Asia Pacific Chemical Software Industry Revenue Share (%), by Application 2024 & 2032
- Figure 22: Asia Pacific Chemical Software Industry Revenue (Million), by Country 2024 & 2032
- Figure 23: Asia Pacific Chemical Software Industry Revenue Share (%), by Country 2024 & 2032
- Figure 24: Middle East and Africa Chemical Software Industry Revenue (Million), by Application 2024 & 2032
- Figure 25: Middle East and Africa Chemical Software Industry Revenue Share (%), by Application 2024 & 2032
- Figure 26: Middle East and Africa Chemical Software Industry Revenue (Million), by Country 2024 & 2032
- Figure 27: Middle East and Africa Chemical Software Industry Revenue Share (%), by Country 2024 & 2032
- Figure 28: South America Chemical Software Industry Revenue (Million), by Application 2024 & 2032
- Figure 29: South America Chemical Software Industry Revenue Share (%), by Application 2024 & 2032
- Figure 30: South America Chemical Software Industry Revenue (Million), by Country 2024 & 2032
- Figure 31: South America Chemical Software Industry Revenue Share (%), by Country 2024 & 2032
List of Tables
- Table 1: Global Chemical Software Industry Revenue Million Forecast, by Region 2019 & 2032
- Table 2: Global Chemical Software Industry Revenue Million Forecast, by Application 2019 & 2032
- Table 3: Global Chemical Software Industry Revenue Million Forecast, by Region 2019 & 2032
- Table 4: Global Chemical Software Industry Revenue Million Forecast, by Country 2019 & 2032
- Table 5: United States Chemical Software Industry Revenue (Million) Forecast, by Application 2019 & 2032
- Table 6: Canada Chemical Software Industry Revenue (Million) Forecast, by Application 2019 & 2032
- Table 7: Mexico Chemical Software Industry Revenue (Million) Forecast, by Application 2019 & 2032
- Table 8: Global Chemical Software Industry Revenue Million Forecast, by Country 2019 & 2032
- Table 9: Germany Chemical Software Industry Revenue (Million) Forecast, by Application 2019 & 2032
- Table 10: United Kingdom Chemical Software Industry Revenue (Million) Forecast, by Application 2019 & 2032
- Table 11: France Chemical Software Industry Revenue (Million) Forecast, by Application 2019 & 2032
- Table 12: Italy Chemical Software Industry Revenue (Million) Forecast, by Application 2019 & 2032
- Table 13: Spain Chemical Software Industry Revenue (Million) Forecast, by Application 2019 & 2032
- Table 14: Rest of Europe Chemical Software Industry Revenue (Million) Forecast, by Application 2019 & 2032
- Table 15: Global Chemical Software Industry Revenue Million Forecast, by Country 2019 & 2032
- Table 16: China Chemical Software Industry Revenue (Million) Forecast, by Application 2019 & 2032
- Table 17: Japan Chemical Software Industry Revenue (Million) Forecast, by Application 2019 & 2032
- Table 18: India Chemical Software Industry Revenue (Million) Forecast, by Application 2019 & 2032
- Table 19: Australia Chemical Software Industry Revenue (Million) Forecast, by Application 2019 & 2032
- Table 20: South Korea Chemical Software Industry Revenue (Million) Forecast, by Application 2019 & 2032
- Table 21: Rest of Asia Pacific Chemical Software Industry Revenue (Million) Forecast, by Application 2019 & 2032
- Table 22: Global Chemical Software Industry Revenue Million Forecast, by Country 2019 & 2032
- Table 23: GCC Chemical Software Industry Revenue (Million) Forecast, by Application 2019 & 2032
- Table 24: South Africa Chemical Software Industry Revenue (Million) Forecast, by Application 2019 & 2032
- Table 25: Rest of Middle East and Africa Chemical Software Industry Revenue (Million) Forecast, by Application 2019 & 2032
- Table 26: Global Chemical Software Industry Revenue Million Forecast, by Country 2019 & 2032
- Table 27: Brazil Chemical Software Industry Revenue (Million) Forecast, by Application 2019 & 2032
- Table 28: Argentina Chemical Software Industry Revenue (Million) Forecast, by Application 2019 & 2032
- Table 29: Rest of South America Chemical Software Industry Revenue (Million) Forecast, by Application 2019 & 2032
- Table 30: Global Chemical Software Industry Revenue Million Forecast, by Application 2019 & 2032
- Table 31: Global Chemical Software Industry Revenue Million Forecast, by Country 2019 & 2032
- Table 32: United States Chemical Software Industry Revenue (Million) Forecast, by Application 2019 & 2032
- Table 33: Canada Chemical Software Industry Revenue (Million) Forecast, by Application 2019 & 2032
- Table 34: Mexico Chemical Software Industry Revenue (Million) Forecast, by Application 2019 & 2032
- Table 35: Global Chemical Software Industry Revenue Million Forecast, by Application 2019 & 2032
- Table 36: Global Chemical Software Industry Revenue Million Forecast, by Country 2019 & 2032
- Table 37: Germany Chemical Software Industry Revenue (Million) Forecast, by Application 2019 & 2032
- Table 38: United Kingdom Chemical Software Industry Revenue (Million) Forecast, by Application 2019 & 2032
- Table 39: France Chemical Software Industry Revenue (Million) Forecast, by Application 2019 & 2032
- Table 40: Italy Chemical Software Industry Revenue (Million) Forecast, by Application 2019 & 2032
- Table 41: Spain Chemical Software Industry Revenue (Million) Forecast, by Application 2019 & 2032
- Table 42: Rest of Europe Chemical Software Industry Revenue (Million) Forecast, by Application 2019 & 2032
- Table 43: Global Chemical Software Industry Revenue Million Forecast, by Application 2019 & 2032
- Table 44: Global Chemical Software Industry Revenue Million Forecast, by Country 2019 & 2032
- Table 45: China Chemical Software Industry Revenue (Million) Forecast, by Application 2019 & 2032
- Table 46: Japan Chemical Software Industry Revenue (Million) Forecast, by Application 2019 & 2032
- Table 47: India Chemical Software Industry Revenue (Million) Forecast, by Application 2019 & 2032
- Table 48: Australia Chemical Software Industry Revenue (Million) Forecast, by Application 2019 & 2032
- Table 49: South Korea Chemical Software Industry Revenue (Million) Forecast, by Application 2019 & 2032
- Table 50: Rest of Asia Pacific Chemical Software Industry Revenue (Million) Forecast, by Application 2019 & 2032
- Table 51: Global Chemical Software Industry Revenue Million Forecast, by Application 2019 & 2032
- Table 52: Global Chemical Software Industry Revenue Million Forecast, by Country 2019 & 2032
- Table 53: GCC Chemical Software Industry Revenue (Million) Forecast, by Application 2019 & 2032
- Table 54: South Africa Chemical Software Industry Revenue (Million) Forecast, by Application 2019 & 2032
- Table 55: Rest of Middle East and Africa Chemical Software Industry Revenue (Million) Forecast, by Application 2019 & 2032
- Table 56: Global Chemical Software Industry Revenue Million Forecast, by Application 2019 & 2032
- Table 57: Global Chemical Software Industry Revenue Million Forecast, by Country 2019 & 2032
- Table 58: Brazil Chemical Software Industry Revenue (Million) Forecast, by Application 2019 & 2032
- Table 59: Argentina Chemical Software Industry Revenue (Million) Forecast, by Application 2019 & 2032
- Table 60: Rest of South America Chemical Software Industry Revenue (Million) Forecast, by Application 2019 & 2032
Frequently Asked Questions
1. What is the projected Compound Annual Growth Rate (CAGR) of the Chemical Software Industry?
The projected CAGR is approximately 15.50%.
2. Which companies are prominent players in the Chemical Software Industry?
Key companies in the market include Chemaxon Ltd, BioSolveIT GmbH, Chemical Computing Group ULC, Molecular Discovery Ltd, Scilligence, Collaborative Drug Discovery Inc, Jubilant Biosys Ltd, Cadence Design Systems Inc (OpenEye Scientific Software Inc ), Schrödinger Inc, Dassault Systemes.
3. What are the main segments of the Chemical Software Industry?
The market segments include Application.
4. Can you provide details about the market size?
The market size is estimated to be USD 6.10 Million as of 2022.
5. What are some drivers contributing to market growth?
Innovations and Advancements in the Drug Development Process; Increased Demand of Personalized Medicine.
6. What are the notable trends driving market growth?
Virtual Screening Segment is Expected to Witness Growth in the Market Over the Forecast Period.
7. Are there any restraints impacting market growth?
Lack of Skilled Labors.
8. Can you provide examples of recent developments in the market?
In October 2023, Cadence Molecular Sciences (OpenEye) announced that Pfizer Inc. has signed an agreement to extend and expand access to Cadence products and programming toolkits for advanced molecular design. Cadence Molecular Sciences’ physics-and AI-based modelling and cheminformatics computational software is an enabler of early-stage drug discovery innovation.
9. What pricing options are available for accessing the report?
Pricing options include single-user, multi-user, and enterprise licenses priced at USD 4750, USD 5250, and USD 8750 respectively.
10. Is the market size provided in terms of value or volume?
The market size is provided in terms of value, measured in Million.
11. Are there any specific market keywords associated with the report?
Yes, the market keyword associated with the report is "Chemical Software Industry," which aids in identifying and referencing the specific market segment covered.
12. How do I determine which pricing option suits my needs best?
The pricing options vary based on user requirements and access needs. Individual users may opt for single-user licenses, while businesses requiring broader access may choose multi-user or enterprise licenses for cost-effective access to the report.
13. Are there any additional resources or data provided in the Chemical Software Industry report?
While the report offers comprehensive insights, it's advisable to review the specific contents or supplementary materials provided to ascertain if additional resources or data are available.
14. How can I stay updated on further developments or reports in the Chemical Software Industry?
To stay informed about further developments, trends, and reports in the Chemical Software Industry, consider subscribing to industry newsletters, following relevant companies and organizations, or regularly checking reputable industry news sources and publications.
Methodology
Step 1 - Identification of Relevant Samples Size from Population Database


Step 2 - Approaches for Defining Global Market Size (Value, Volume* & Price*)

Note*: In applicable scenarios
Step 3 - Data Sources
Primary Research
- Web Analytics
- Survey Reports
- Research Institute
- Latest Research Reports
- Opinion Leaders
Secondary Research
- Annual Reports
- White Paper
- Latest Press Release
- Industry Association
- Paid Database
- Investor Presentations

Step 4 - Data Triangulation
Involves using different sources of information in order to increase the validity of a study
These sources are likely to be stakeholders in a program - participants, other researchers, program staff, other community members, and so on.
Then we put all data in single framework & apply various statistical tools to find out the dynamic on the market.
During the analysis stage, feedback from the stakeholder groups would be compared to determine areas of agreement as well as areas of divergence


