
Key Insights
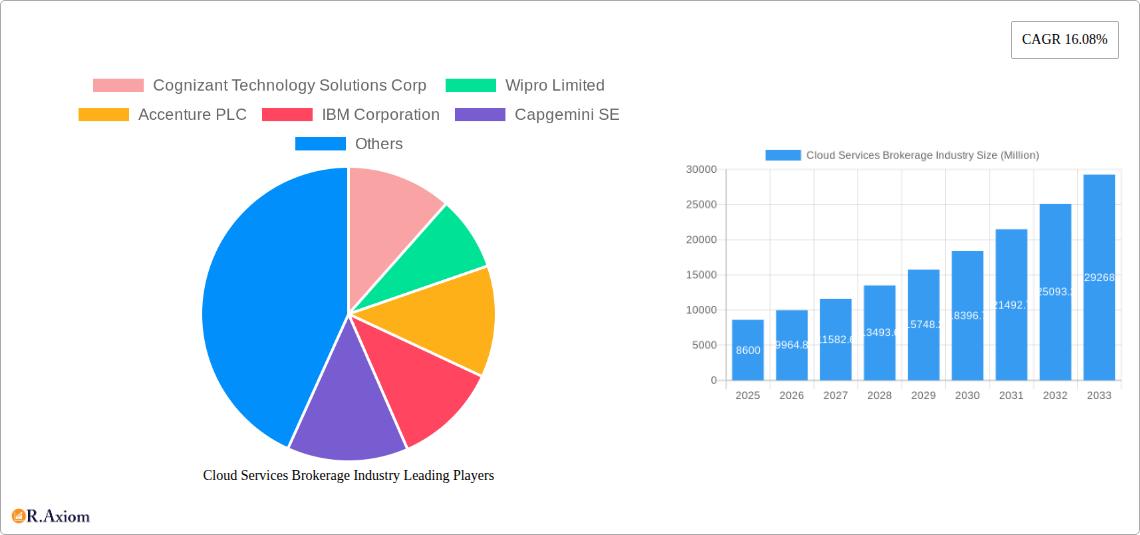
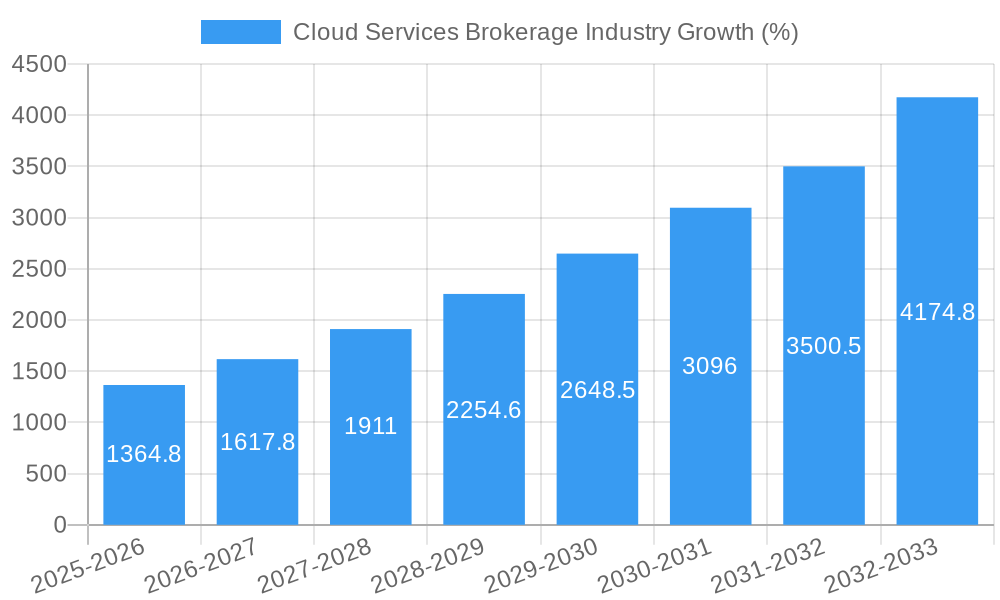
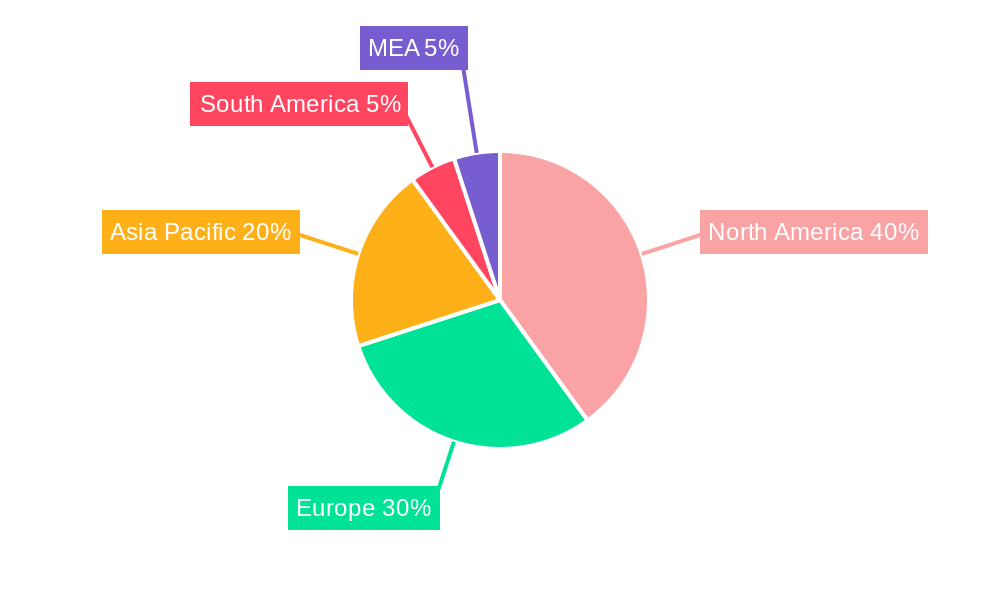
The Cloud Services Brokerage (CSB) market is experiencing robust growth, projected to reach $8.60 billion in 2025 and maintain a Compound Annual Growth Rate (CAGR) of 16.08% from 2025 to 2033. This expansion is fueled by several key drivers. The increasing adoption of cloud computing across various industries, coupled with the rising need for efficient cloud resource management and cost optimization, is creating significant demand for CSB services. Businesses are increasingly seeking specialized expertise to navigate the complexities of multi-cloud environments, security concerns, and compliance regulations, thereby fueling the growth of this market. Furthermore, the shift towards hybrid and multi-cloud strategies is a prominent trend, further bolstering the demand for CSB solutions that enable seamless integration and management across different cloud platforms. While potential restraints like security breaches and data privacy concerns exist, the overall market outlook remains positive, particularly with the continued growth of cloud adoption in sectors such as IT & Telecom, BFSI, and Healthcare. The segmentation highlights the diverse application of CSB across deployment models (public, private, hybrid), enterprise sizes (SME, large enterprise), and industry verticals. The competitive landscape is characterized by established players like Cognizant, Wipro, Accenture, IBM, and Capgemini, alongside specialized CSB providers like Rightscale. The geographical distribution reveals strong growth potential across North America, Europe, and the Asia-Pacific region, driven by factors like advanced digital infrastructure and high cloud adoption rates.
The projected market size beyond 2025 can be estimated by applying the CAGR. Assuming a consistent growth rate, we can project a substantial increase in market value over the forecast period (2025-2033). Regional growth will likely vary, with North America and Asia-Pacific potentially leading the charge due to factors such as technological advancements and high levels of digital transformation initiatives in those regions. The continued evolution of cloud technologies and increasing sophistication of CSB solutions will drive further innovation, enhancing the capabilities of these services and expanding their applicability across diverse industries and use cases. The market's success depends on vendors' ability to address evolving security needs and comply with stringent data privacy regulations, providing businesses with reliable, secure, and cost-effective solutions for managing their cloud environments.
Cloud Services Brokerage Industry: A Comprehensive Market Report (2019-2033)
This in-depth report provides a comprehensive analysis of the Cloud Services Brokerage industry, covering market size, segmentation, growth drivers, challenges, key players, and future outlook. The study period spans from 2019 to 2033, with 2025 as the base and estimated year. The report leverages extensive data analysis and expert insights to offer actionable intelligence for industry stakeholders, investors, and strategic decision-makers. The global market is projected to reach xx Million by 2033, exhibiting a robust CAGR of xx% during the forecast period (2025-2033).
Cloud Services Brokerage Industry Market Concentration & Innovation
This section delves into the competitive landscape of the Cloud Services Brokerage industry, analyzing market concentration, innovation drivers, and regulatory dynamics. The market is characterized by a moderate level of concentration, with a few dominant players holding significant market share. However, the emergence of niche players and innovative startups is continuously reshaping the competitive dynamics.
Market Concentration: The top five players—Cognizant Technology Solutions Corp, Wipro Limited, Accenture PLC, IBM Corporation, and Capgemini SE—collectively account for approximately xx% of the global market share in 2025. Smaller players and specialized cloud brokers compete for remaining market share.
Innovation Drivers: Key drivers of innovation include advancements in AI, machine learning, and automation within cloud management platforms. The increasing demand for secure and cost-effective cloud solutions fuels innovation in areas such as multi-cloud management, security protocols, and service optimization. Furthermore, the development of new cloud-based technologies, such as serverless computing and edge computing, is creating new opportunities for innovation and growth.
Regulatory Frameworks: The evolving regulatory landscape, particularly concerning data privacy and security, is shaping the industry’s development. Compliance with regulations like GDPR and CCPA influences investment in security features and data management solutions within cloud brokerage services.
Product Substitutes: The primary substitutes for cloud services brokerage are in-house cloud management teams and direct cloud provider contracts. However, the increasing complexity of managing multi-cloud environments favors the expertise and cost efficiencies offered by cloud brokers.
End-User Trends: Increasing adoption of cloud services across various industries is a major growth driver. Businesses are increasingly seeking flexibility, scalability, and cost optimization offered by cloud solutions, propelling the demand for expert cloud brokerage services.
M&A Activities: The industry has witnessed significant M&A activity in recent years, with deal values totaling xx Million in 2024. These mergers and acquisitions often aim to expand service portfolios, enhance technological capabilities, and achieve greater market reach.
Cloud Services Brokerage Industry Industry Trends & Insights
The Cloud Services Brokerage industry is experiencing rapid growth, driven by several key factors. The increasing adoption of cloud computing across various industries is a major driver. Businesses of all sizes are migrating their IT infrastructure to the cloud to reduce costs, improve efficiency, and gain access to advanced technologies. This trend is fueled by the growing availability of cloud services, decreasing costs, and enhanced security measures.
Technological disruptions are transforming the industry, with advancements in AI, machine learning, and automation playing a significant role. The rise of multi-cloud environments and the need for efficient cloud management tools are driving innovation and creating new opportunities for cloud brokers.
Consumer preferences are shifting towards cloud-based solutions that are flexible, scalable, and cost-effective. Businesses are seeking solutions that can be easily integrated with their existing IT infrastructure and that provide a high level of security. The demand for customized cloud solutions tailored to specific business needs is also growing.
Competitive dynamics are characterized by a combination of established players and new entrants. Established players possess significant market share and extensive expertise, while new entrants are disrupting the market by offering innovative and cost-competitive solutions. The increasing adoption of hybrid and multi-cloud environments is creating opportunities for specialized cloud brokerage services. The market is expected to experience a CAGR of xx% during the forecast period (2025-2033), with market penetration increasing from xx% in 2025 to xx% by 2033.
Dominant Markets & Segments in Cloud Services Brokerage Industry
The Public Cloud segment currently dominates the Cloud Services Brokerage market, accounting for the largest share of revenue. This is driven by its scalability, cost-effectiveness, and ease of access. However, the Hybrid Cloud segment is exhibiting strong growth potential, as organizations seek to combine the benefits of public and private clouds.
By Deployment Model: Public Cloud remains dominant due to its flexibility and cost-effectiveness. Hybrid Cloud is experiencing rapid growth as organizations balance security needs with cost optimization. Private cloud deployment remains a niche segment primarily used by organizations with stringent security or compliance requirements.
By Enterprise: Large Enterprises are the key drivers of the market, given their substantial IT budgets and extensive requirements. However, the SME segment is also exhibiting significant growth as cloud adoption becomes more accessible and affordable.
By End-user Industry: The IT and Telecom sector is currently the largest end-user segment, driven by its early adoption of cloud technologies. However, BFSI, Retail, and Healthcare are demonstrating strong growth potential, driven by their increasing need for secure, scalable, and efficient cloud solutions. Government and Manufacturing sectors are steadily increasing cloud adoption, which translates into opportunities for cloud brokerage services.
By Platform: External Cloud Services Brokerage is currently more prevalent than Internal Cloud Services Brokerage. This is due to the specialization and expertise that external providers can offer. However, the Internal Cloud Services Brokerage segment is gaining traction as organizations seek greater control and customization of their cloud environments.
The North American region currently holds the largest market share, driven by high cloud adoption rates and advanced IT infrastructure. However, the Asia Pacific region is projected to experience the fastest growth rate during the forecast period, driven by rapid economic growth and increasing digitization. Key drivers in these regions include favorable government policies promoting cloud adoption, robust IT infrastructure development, and a growing pool of skilled IT professionals.
Cloud Services Brokerage Industry Product Developments
Recent product innovations focus on enhancing cloud management platforms with advanced features, including AI-driven automation, enhanced security protocols, and multi-cloud integration capabilities. The emphasis is on providing comprehensive solutions that simplify cloud management, optimize costs, and improve security posture. These advancements are directly addressing the market need for streamlined cloud operations and heightened security in an increasingly complex cloud environment. The market fit is strong, as the value proposition caters to the demand for efficient and secure cloud management across various deployment models and industries.
Report Scope & Segmentation Analysis
This report comprehensively covers the Cloud Services Brokerage industry, segmented by Deployment Model (Public, Private, Hybrid), Enterprise (SME, Large Enterprise), End-user Industry (IT & Telecom, BFSI, Retail, Healthcare, Government, Manufacturing, Other), and Platform (Internal, External). Each segment provides detailed analysis of market size, growth projections, and competitive dynamics. The growth projections indicate substantial expansion across all segments, with hybrid cloud and large enterprise segments showing particularly strong growth trajectories. The competitive dynamics highlight the presence of both established players and emerging niche providers.
Key Drivers of Cloud Services Brokerage Industry Growth
The Cloud Services Brokerage industry's growth is primarily fueled by several key factors: the increasing adoption of cloud computing across industries seeking enhanced scalability and cost optimization; advancements in AI and automation technologies leading to more efficient cloud management; favorable government regulations promoting cloud adoption; and the rising need for secure and reliable cloud solutions for sensitive data management across multiple deployment models.
Challenges in the Cloud Services Brokerage Industry Sector
Several challenges hinder the Cloud Services Brokerage industry's growth. These include the complexity of managing multi-cloud environments, the need to maintain high security standards, the increasing competition from cloud providers offering direct brokerage services, and regulatory uncertainties concerning data privacy and security compliance which can impact operating costs. These factors pose challenges in terms of both operational efficiency and regulatory compliance.
Emerging Opportunities in Cloud Services Brokerage Industry
The industry presents significant opportunities for growth. The expansion of cloud adoption into new sectors such as education and agriculture represents considerable market potential. The integration of emerging technologies, including blockchain for enhanced security and IoT for optimized device management, opens exciting avenues. The increasing demand for customized and specialized cloud brokerage services based on specific industry needs offers further opportunity for growth.
Leading Players in the Cloud Services Brokerage Industry Market
- Cognizant Technology Solutions Corp
- Wipro Limited
- Accenture PLC
- IBM Corporation
- Capgemini SE
- NTT Data Inc
- Rightscale Inc
- DXC Technology Company
- NEC Corporation
Key Developments in Cloud Services Brokerage Industry Industry
October 2022: Deloitte launched SuperLedger, an AI-powered platform for transaction processing, FP&A, and sub-ledger reporting, enhancing efficiency and cost savings in financial operations. This signifies a move toward autonomous and intelligent cloud management solutions.
January 2023: EY unveiled a retail solution leveraging Microsoft Cloud, seamlessly integrating online, mobile, and in-store experiences. This highlights the increasing use of cloud brokerage to enhance customer experiences and data analytics across diverse touchpoints.
Strategic Outlook for Cloud Services Brokerage Industry Market
The future of the Cloud Services Brokerage industry is bright, driven by continuous technological advancements, increasing cloud adoption, and the growing need for efficient cloud management solutions. The industry is poised for strong growth, propelled by the expansion into new markets, the integration of cutting-edge technologies, and the ongoing demand for customized and secure cloud solutions. The focus will continue to be on leveraging AI, automation, and enhanced security features to offer sophisticated and cost-effective solutions to an ever-growing customer base.
Cloud Services Brokerage Industry Segmentation
-
1. Platform
- 1.1. Internal Cloud Services Brokerage
- 1.2. External Cloud Services Brokerage
-
2. Deployment Model
- 2.1. Public
- 2.2. Private
- 2.3. Hybrid
-
3. Enterprise
- 3.1. Small and Medium Enterprise (SME)
- 3.2. Large Enterprise
-
4. End-user Industry
- 4.1. IT and Telecom
- 4.2. BFSI
- 4.3. Retail
- 4.4. Healthcare
- 4.5. Government
- 4.6. Manufacturing
- 4.7. Other End-user Industries
Cloud Services Brokerage Industry Segmentation By Geography
-
1. North America
- 1.1. United States
- 1.2. Canada
-
2. Europe
- 2.1. Germany
- 2.2. United Kingdom
- 2.3. France
-
3. Asia
- 3.1. China
- 3.2. Japan
- 3.3. India
- 4. Australia and New Zealand
-
5. Latin America
- 5.1. Mexico
- 5.2. Brazil
- 5.3. Argentina
-
6. Middle East and Africa
- 6.1. United Arab Emirates
- 6.2. Saudi Arabia
Cloud Services Brokerage Industry REPORT HIGHLIGHTS
| Aspects | Details |
|---|---|
| Study Period | 2019-2033 |
| Base Year | 2024 |
| Estimated Year | 2025 |
| Forecast Period | 2025-2033 |
| Historical Period | 2019-2024 |
| Growth Rate | CAGR of 16.08% from 2019-2033 |
| Segmentation |
|
Table of Contents
- 1. Introduction
- 1.1. Research Scope
- 1.2. Market Segmentation
- 1.3. Research Methodology
- 1.4. Definitions and Assumptions
- 2. Executive Summary
- 2.1. Introduction
- 3. Market Dynamics
- 3.1. Introduction
- 3.2. Market Drivers
- 3.2.1. Increasing Adoption of Hybrid and Multi-cloud Environment; Increasing Adoption of Cloud Computing Services
- 3.3. Market Restrains
- 3.3.1. Lack of Awareness and Security Concerns
- 3.4. Market Trends
- 3.4.1. Internal Cloud Services Brokerage is Expected to Hold the Major Share
- 4. Market Factor Analysis
- 4.1. Porters Five Forces
- 4.2. Supply/Value Chain
- 4.3. PESTEL analysis
- 4.4. Market Entropy
- 4.5. Patent/Trademark Analysis
- 5. Global Cloud Services Brokerage Industry Analysis, Insights and Forecast, 2019-2031
- 5.1. Market Analysis, Insights and Forecast - by Platform
- 5.1.1. Internal Cloud Services Brokerage
- 5.1.2. External Cloud Services Brokerage
- 5.2. Market Analysis, Insights and Forecast - by Deployment Model
- 5.2.1. Public
- 5.2.2. Private
- 5.2.3. Hybrid
- 5.3. Market Analysis, Insights and Forecast - by Enterprise
- 5.3.1. Small and Medium Enterprise (SME)
- 5.3.2. Large Enterprise
- 5.4. Market Analysis, Insights and Forecast - by End-user Industry
- 5.4.1. IT and Telecom
- 5.4.2. BFSI
- 5.4.3. Retail
- 5.4.4. Healthcare
- 5.4.5. Government
- 5.4.6. Manufacturing
- 5.4.7. Other End-user Industries
- 5.5. Market Analysis, Insights and Forecast - by Region
- 5.5.1. North America
- 5.5.2. Europe
- 5.5.3. Asia
- 5.5.4. Australia and New Zealand
- 5.5.5. Latin America
- 5.5.6. Middle East and Africa
- 5.1. Market Analysis, Insights and Forecast - by Platform
- 6. North America Cloud Services Brokerage Industry Analysis, Insights and Forecast, 2019-2031
- 6.1. Market Analysis, Insights and Forecast - by Platform
- 6.1.1. Internal Cloud Services Brokerage
- 6.1.2. External Cloud Services Brokerage
- 6.2. Market Analysis, Insights and Forecast - by Deployment Model
- 6.2.1. Public
- 6.2.2. Private
- 6.2.3. Hybrid
- 6.3. Market Analysis, Insights and Forecast - by Enterprise
- 6.3.1. Small and Medium Enterprise (SME)
- 6.3.2. Large Enterprise
- 6.4. Market Analysis, Insights and Forecast - by End-user Industry
- 6.4.1. IT and Telecom
- 6.4.2. BFSI
- 6.4.3. Retail
- 6.4.4. Healthcare
- 6.4.5. Government
- 6.4.6. Manufacturing
- 6.4.7. Other End-user Industries
- 6.1. Market Analysis, Insights and Forecast - by Platform
- 7. Europe Cloud Services Brokerage Industry Analysis, Insights and Forecast, 2019-2031
- 7.1. Market Analysis, Insights and Forecast - by Platform
- 7.1.1. Internal Cloud Services Brokerage
- 7.1.2. External Cloud Services Brokerage
- 7.2. Market Analysis, Insights and Forecast - by Deployment Model
- 7.2.1. Public
- 7.2.2. Private
- 7.2.3. Hybrid
- 7.3. Market Analysis, Insights and Forecast - by Enterprise
- 7.3.1. Small and Medium Enterprise (SME)
- 7.3.2. Large Enterprise
- 7.4. Market Analysis, Insights and Forecast - by End-user Industry
- 7.4.1. IT and Telecom
- 7.4.2. BFSI
- 7.4.3. Retail
- 7.4.4. Healthcare
- 7.4.5. Government
- 7.4.6. Manufacturing
- 7.4.7. Other End-user Industries
- 7.1. Market Analysis, Insights and Forecast - by Platform
- 8. Asia Cloud Services Brokerage Industry Analysis, Insights and Forecast, 2019-2031
- 8.1. Market Analysis, Insights and Forecast - by Platform
- 8.1.1. Internal Cloud Services Brokerage
- 8.1.2. External Cloud Services Brokerage
- 8.2. Market Analysis, Insights and Forecast - by Deployment Model
- 8.2.1. Public
- 8.2.2. Private
- 8.2.3. Hybrid
- 8.3. Market Analysis, Insights and Forecast - by Enterprise
- 8.3.1. Small and Medium Enterprise (SME)
- 8.3.2. Large Enterprise
- 8.4. Market Analysis, Insights and Forecast - by End-user Industry
- 8.4.1. IT and Telecom
- 8.4.2. BFSI
- 8.4.3. Retail
- 8.4.4. Healthcare
- 8.4.5. Government
- 8.4.6. Manufacturing
- 8.4.7. Other End-user Industries
- 8.1. Market Analysis, Insights and Forecast - by Platform
- 9. Australia and New Zealand Cloud Services Brokerage Industry Analysis, Insights and Forecast, 2019-2031
- 9.1. Market Analysis, Insights and Forecast - by Platform
- 9.1.1. Internal Cloud Services Brokerage
- 9.1.2. External Cloud Services Brokerage
- 9.2. Market Analysis, Insights and Forecast - by Deployment Model
- 9.2.1. Public
- 9.2.2. Private
- 9.2.3. Hybrid
- 9.3. Market Analysis, Insights and Forecast - by Enterprise
- 9.3.1. Small and Medium Enterprise (SME)
- 9.3.2. Large Enterprise
- 9.4. Market Analysis, Insights and Forecast - by End-user Industry
- 9.4.1. IT and Telecom
- 9.4.2. BFSI
- 9.4.3. Retail
- 9.4.4. Healthcare
- 9.4.5. Government
- 9.4.6. Manufacturing
- 9.4.7. Other End-user Industries
- 9.1. Market Analysis, Insights and Forecast - by Platform
- 10. Latin America Cloud Services Brokerage Industry Analysis, Insights and Forecast, 2019-2031
- 10.1. Market Analysis, Insights and Forecast - by Platform
- 10.1.1. Internal Cloud Services Brokerage
- 10.1.2. External Cloud Services Brokerage
- 10.2. Market Analysis, Insights and Forecast - by Deployment Model
- 10.2.1. Public
- 10.2.2. Private
- 10.2.3. Hybrid
- 10.3. Market Analysis, Insights and Forecast - by Enterprise
- 10.3.1. Small and Medium Enterprise (SME)
- 10.3.2. Large Enterprise
- 10.4. Market Analysis, Insights and Forecast - by End-user Industry
- 10.4.1. IT and Telecom
- 10.4.2. BFSI
- 10.4.3. Retail
- 10.4.4. Healthcare
- 10.4.5. Government
- 10.4.6. Manufacturing
- 10.4.7. Other End-user Industries
- 10.1. Market Analysis, Insights and Forecast - by Platform
- 11. Middle East and Africa Cloud Services Brokerage Industry Analysis, Insights and Forecast, 2019-2031
- 11.1. Market Analysis, Insights and Forecast - by Platform
- 11.1.1. Internal Cloud Services Brokerage
- 11.1.2. External Cloud Services Brokerage
- 11.2. Market Analysis, Insights and Forecast - by Deployment Model
- 11.2.1. Public
- 11.2.2. Private
- 11.2.3. Hybrid
- 11.3. Market Analysis, Insights and Forecast - by Enterprise
- 11.3.1. Small and Medium Enterprise (SME)
- 11.3.2. Large Enterprise
- 11.4. Market Analysis, Insights and Forecast - by End-user Industry
- 11.4.1. IT and Telecom
- 11.4.2. BFSI
- 11.4.3. Retail
- 11.4.4. Healthcare
- 11.4.5. Government
- 11.4.6. Manufacturing
- 11.4.7. Other End-user Industries
- 11.1. Market Analysis, Insights and Forecast - by Platform
- 12. North America Cloud Services Brokerage Industry Analysis, Insights and Forecast, 2019-2031
- 12.1. Market Analysis, Insights and Forecast - By Country/Sub-region
- 12.1.1 United States
- 12.1.2 Canada
- 12.1.3 Mexico
- 13. Europe Cloud Services Brokerage Industry Analysis, Insights and Forecast, 2019-2031
- 13.1. Market Analysis, Insights and Forecast - By Country/Sub-region
- 13.1.1 Germany
- 13.1.2 United Kingdom
- 13.1.3 France
- 13.1.4 Spain
- 13.1.5 Italy
- 13.1.6 Spain
- 13.1.7 Belgium
- 13.1.8 Netherland
- 13.1.9 Nordics
- 13.1.10 Rest of Europe
- 14. Asia Pacific Cloud Services Brokerage Industry Analysis, Insights and Forecast, 2019-2031
- 14.1. Market Analysis, Insights and Forecast - By Country/Sub-region
- 14.1.1 China
- 14.1.2 Japan
- 14.1.3 India
- 14.1.4 South Korea
- 14.1.5 Southeast Asia
- 14.1.6 Australia
- 14.1.7 Indonesia
- 14.1.8 Phillipes
- 14.1.9 Singapore
- 14.1.10 Thailandc
- 14.1.11 Rest of Asia Pacific
- 15. South America Cloud Services Brokerage Industry Analysis, Insights and Forecast, 2019-2031
- 15.1. Market Analysis, Insights and Forecast - By Country/Sub-region
- 15.1.1 Brazil
- 15.1.2 Argentina
- 15.1.3 Peru
- 15.1.4 Chile
- 15.1.5 Colombia
- 15.1.6 Ecuador
- 15.1.7 Venezuela
- 15.1.8 Rest of South America
- 16. North America Cloud Services Brokerage Industry Analysis, Insights and Forecast, 2019-2031
- 16.1. Market Analysis, Insights and Forecast - By Country/Sub-region
- 16.1.1 United States
- 16.1.2 Canada
- 16.1.3 Mexico
- 17. MEA Cloud Services Brokerage Industry Analysis, Insights and Forecast, 2019-2031
- 17.1. Market Analysis, Insights and Forecast - By Country/Sub-region
- 17.1.1 United Arab Emirates
- 17.1.2 Saudi Arabia
- 17.1.3 South Africa
- 17.1.4 Rest of Middle East and Africa
- 18. Competitive Analysis
- 18.1. Global Market Share Analysis 2024
- 18.2. Company Profiles
- 18.2.1 Cognizant Technology Solutions Corp
- 18.2.1.1. Overview
- 18.2.1.2. Products
- 18.2.1.3. SWOT Analysis
- 18.2.1.4. Recent Developments
- 18.2.1.5. Financials (Based on Availability)
- 18.2.2 Wipro Limited
- 18.2.2.1. Overview
- 18.2.2.2. Products
- 18.2.2.3. SWOT Analysis
- 18.2.2.4. Recent Developments
- 18.2.2.5. Financials (Based on Availability)
- 18.2.3 Accenture PLC
- 18.2.3.1. Overview
- 18.2.3.2. Products
- 18.2.3.3. SWOT Analysis
- 18.2.3.4. Recent Developments
- 18.2.3.5. Financials (Based on Availability)
- 18.2.4 IBM Corporation
- 18.2.4.1. Overview
- 18.2.4.2. Products
- 18.2.4.3. SWOT Analysis
- 18.2.4.4. Recent Developments
- 18.2.4.5. Financials (Based on Availability)
- 18.2.5 Capgemini SE
- 18.2.5.1. Overview
- 18.2.5.2. Products
- 18.2.5.3. SWOT Analysis
- 18.2.5.4. Recent Developments
- 18.2.5.5. Financials (Based on Availability)
- 18.2.6 NTT Data Inc
- 18.2.6.1. Overview
- 18.2.6.2. Products
- 18.2.6.3. SWOT Analysis
- 18.2.6.4. Recent Developments
- 18.2.6.5. Financials (Based on Availability)
- 18.2.7 Rightscale Inc
- 18.2.7.1. Overview
- 18.2.7.2. Products
- 18.2.7.3. SWOT Analysis
- 18.2.7.4. Recent Developments
- 18.2.7.5. Financials (Based on Availability)
- 18.2.8 DXC Technology Company
- 18.2.8.1. Overview
- 18.2.8.2. Products
- 18.2.8.3. SWOT Analysis
- 18.2.8.4. Recent Developments
- 18.2.8.5. Financials (Based on Availability)
- 18.2.9 NEC Corporation
- 18.2.9.1. Overview
- 18.2.9.2. Products
- 18.2.9.3. SWOT Analysis
- 18.2.9.4. Recent Developments
- 18.2.9.5. Financials (Based on Availability)
- 18.2.1 Cognizant Technology Solutions Corp
List of Figures
- Figure 1: Global Cloud Services Brokerage Industry Revenue Breakdown (Million, %) by Region 2024 & 2032
- Figure 2: Global Cloud Services Brokerage Industry Volume Breakdown (K Unit, %) by Region 2024 & 2032
- Figure 3: North America Cloud Services Brokerage Industry Revenue (Million), by Country 2024 & 2032
- Figure 4: North America Cloud Services Brokerage Industry Volume (K Unit), by Country 2024 & 2032
- Figure 5: North America Cloud Services Brokerage Industry Revenue Share (%), by Country 2024 & 2032
- Figure 6: North America Cloud Services Brokerage Industry Volume Share (%), by Country 2024 & 2032
- Figure 7: Europe Cloud Services Brokerage Industry Revenue (Million), by Country 2024 & 2032
- Figure 8: Europe Cloud Services Brokerage Industry Volume (K Unit), by Country 2024 & 2032
- Figure 9: Europe Cloud Services Brokerage Industry Revenue Share (%), by Country 2024 & 2032
- Figure 10: Europe Cloud Services Brokerage Industry Volume Share (%), by Country 2024 & 2032
- Figure 11: Asia Pacific Cloud Services Brokerage Industry Revenue (Million), by Country 2024 & 2032
- Figure 12: Asia Pacific Cloud Services Brokerage Industry Volume (K Unit), by Country 2024 & 2032
- Figure 13: Asia Pacific Cloud Services Brokerage Industry Revenue Share (%), by Country 2024 & 2032
- Figure 14: Asia Pacific Cloud Services Brokerage Industry Volume Share (%), by Country 2024 & 2032
- Figure 15: South America Cloud Services Brokerage Industry Revenue (Million), by Country 2024 & 2032
- Figure 16: South America Cloud Services Brokerage Industry Volume (K Unit), by Country 2024 & 2032
- Figure 17: South America Cloud Services Brokerage Industry Revenue Share (%), by Country 2024 & 2032
- Figure 18: South America Cloud Services Brokerage Industry Volume Share (%), by Country 2024 & 2032
- Figure 19: North America Cloud Services Brokerage Industry Revenue (Million), by Country 2024 & 2032
- Figure 20: North America Cloud Services Brokerage Industry Volume (K Unit), by Country 2024 & 2032
- Figure 21: North America Cloud Services Brokerage Industry Revenue Share (%), by Country 2024 & 2032
- Figure 22: North America Cloud Services Brokerage Industry Volume Share (%), by Country 2024 & 2032
- Figure 23: MEA Cloud Services Brokerage Industry Revenue (Million), by Country 2024 & 2032
- Figure 24: MEA Cloud Services Brokerage Industry Volume (K Unit), by Country 2024 & 2032
- Figure 25: MEA Cloud Services Brokerage Industry Revenue Share (%), by Country 2024 & 2032
- Figure 26: MEA Cloud Services Brokerage Industry Volume Share (%), by Country 2024 & 2032
- Figure 27: North America Cloud Services Brokerage Industry Revenue (Million), by Platform 2024 & 2032
- Figure 28: North America Cloud Services Brokerage Industry Volume (K Unit), by Platform 2024 & 2032
- Figure 29: North America Cloud Services Brokerage Industry Revenue Share (%), by Platform 2024 & 2032
- Figure 30: North America Cloud Services Brokerage Industry Volume Share (%), by Platform 2024 & 2032
- Figure 31: North America Cloud Services Brokerage Industry Revenue (Million), by Deployment Model 2024 & 2032
- Figure 32: North America Cloud Services Brokerage Industry Volume (K Unit), by Deployment Model 2024 & 2032
- Figure 33: North America Cloud Services Brokerage Industry Revenue Share (%), by Deployment Model 2024 & 2032
- Figure 34: North America Cloud Services Brokerage Industry Volume Share (%), by Deployment Model 2024 & 2032
- Figure 35: North America Cloud Services Brokerage Industry Revenue (Million), by Enterprise 2024 & 2032
- Figure 36: North America Cloud Services Brokerage Industry Volume (K Unit), by Enterprise 2024 & 2032
- Figure 37: North America Cloud Services Brokerage Industry Revenue Share (%), by Enterprise 2024 & 2032
- Figure 38: North America Cloud Services Brokerage Industry Volume Share (%), by Enterprise 2024 & 2032
- Figure 39: North America Cloud Services Brokerage Industry Revenue (Million), by End-user Industry 2024 & 2032
- Figure 40: North America Cloud Services Brokerage Industry Volume (K Unit), by End-user Industry 2024 & 2032
- Figure 41: North America Cloud Services Brokerage Industry Revenue Share (%), by End-user Industry 2024 & 2032
- Figure 42: North America Cloud Services Brokerage Industry Volume Share (%), by End-user Industry 2024 & 2032
- Figure 43: North America Cloud Services Brokerage Industry Revenue (Million), by Country 2024 & 2032
- Figure 44: North America Cloud Services Brokerage Industry Volume (K Unit), by Country 2024 & 2032
- Figure 45: North America Cloud Services Brokerage Industry Revenue Share (%), by Country 2024 & 2032
- Figure 46: North America Cloud Services Brokerage Industry Volume Share (%), by Country 2024 & 2032
- Figure 47: Europe Cloud Services Brokerage Industry Revenue (Million), by Platform 2024 & 2032
- Figure 48: Europe Cloud Services Brokerage Industry Volume (K Unit), by Platform 2024 & 2032
- Figure 49: Europe Cloud Services Brokerage Industry Revenue Share (%), by Platform 2024 & 2032
- Figure 50: Europe Cloud Services Brokerage Industry Volume Share (%), by Platform 2024 & 2032
- Figure 51: Europe Cloud Services Brokerage Industry Revenue (Million), by Deployment Model 2024 & 2032
- Figure 52: Europe Cloud Services Brokerage Industry Volume (K Unit), by Deployment Model 2024 & 2032
- Figure 53: Europe Cloud Services Brokerage Industry Revenue Share (%), by Deployment Model 2024 & 2032
- Figure 54: Europe Cloud Services Brokerage Industry Volume Share (%), by Deployment Model 2024 & 2032
- Figure 55: Europe Cloud Services Brokerage Industry Revenue (Million), by Enterprise 2024 & 2032
- Figure 56: Europe Cloud Services Brokerage Industry Volume (K Unit), by Enterprise 2024 & 2032
- Figure 57: Europe Cloud Services Brokerage Industry Revenue Share (%), by Enterprise 2024 & 2032
- Figure 58: Europe Cloud Services Brokerage Industry Volume Share (%), by Enterprise 2024 & 2032
- Figure 59: Europe Cloud Services Brokerage Industry Revenue (Million), by End-user Industry 2024 & 2032
- Figure 60: Europe Cloud Services Brokerage Industry Volume (K Unit), by End-user Industry 2024 & 2032
- Figure 61: Europe Cloud Services Brokerage Industry Revenue Share (%), by End-user Industry 2024 & 2032
- Figure 62: Europe Cloud Services Brokerage Industry Volume Share (%), by End-user Industry 2024 & 2032
- Figure 63: Europe Cloud Services Brokerage Industry Revenue (Million), by Country 2024 & 2032
- Figure 64: Europe Cloud Services Brokerage Industry Volume (K Unit), by Country 2024 & 2032
- Figure 65: Europe Cloud Services Brokerage Industry Revenue Share (%), by Country 2024 & 2032
- Figure 66: Europe Cloud Services Brokerage Industry Volume Share (%), by Country 2024 & 2032
- Figure 67: Asia Cloud Services Brokerage Industry Revenue (Million), by Platform 2024 & 2032
- Figure 68: Asia Cloud Services Brokerage Industry Volume (K Unit), by Platform 2024 & 2032
- Figure 69: Asia Cloud Services Brokerage Industry Revenue Share (%), by Platform 2024 & 2032
- Figure 70: Asia Cloud Services Brokerage Industry Volume Share (%), by Platform 2024 & 2032
- Figure 71: Asia Cloud Services Brokerage Industry Revenue (Million), by Deployment Model 2024 & 2032
- Figure 72: Asia Cloud Services Brokerage Industry Volume (K Unit), by Deployment Model 2024 & 2032
- Figure 73: Asia Cloud Services Brokerage Industry Revenue Share (%), by Deployment Model 2024 & 2032
- Figure 74: Asia Cloud Services Brokerage Industry Volume Share (%), by Deployment Model 2024 & 2032
- Figure 75: Asia Cloud Services Brokerage Industry Revenue (Million), by Enterprise 2024 & 2032
- Figure 76: Asia Cloud Services Brokerage Industry Volume (K Unit), by Enterprise 2024 & 2032
- Figure 77: Asia Cloud Services Brokerage Industry Revenue Share (%), by Enterprise 2024 & 2032
- Figure 78: Asia Cloud Services Brokerage Industry Volume Share (%), by Enterprise 2024 & 2032
- Figure 79: Asia Cloud Services Brokerage Industry Revenue (Million), by End-user Industry 2024 & 2032
- Figure 80: Asia Cloud Services Brokerage Industry Volume (K Unit), by End-user Industry 2024 & 2032
- Figure 81: Asia Cloud Services Brokerage Industry Revenue Share (%), by End-user Industry 2024 & 2032
- Figure 82: Asia Cloud Services Brokerage Industry Volume Share (%), by End-user Industry 2024 & 2032
- Figure 83: Asia Cloud Services Brokerage Industry Revenue (Million), by Country 2024 & 2032
- Figure 84: Asia Cloud Services Brokerage Industry Volume (K Unit), by Country 2024 & 2032
- Figure 85: Asia Cloud Services Brokerage Industry Revenue Share (%), by Country 2024 & 2032
- Figure 86: Asia Cloud Services Brokerage Industry Volume Share (%), by Country 2024 & 2032
- Figure 87: Australia and New Zealand Cloud Services Brokerage Industry Revenue (Million), by Platform 2024 & 2032
- Figure 88: Australia and New Zealand Cloud Services Brokerage Industry Volume (K Unit), by Platform 2024 & 2032
- Figure 89: Australia and New Zealand Cloud Services Brokerage Industry Revenue Share (%), by Platform 2024 & 2032
- Figure 90: Australia and New Zealand Cloud Services Brokerage Industry Volume Share (%), by Platform 2024 & 2032
- Figure 91: Australia and New Zealand Cloud Services Brokerage Industry Revenue (Million), by Deployment Model 2024 & 2032
- Figure 92: Australia and New Zealand Cloud Services Brokerage Industry Volume (K Unit), by Deployment Model 2024 & 2032
- Figure 93: Australia and New Zealand Cloud Services Brokerage Industry Revenue Share (%), by Deployment Model 2024 & 2032
- Figure 94: Australia and New Zealand Cloud Services Brokerage Industry Volume Share (%), by Deployment Model 2024 & 2032
- Figure 95: Australia and New Zealand Cloud Services Brokerage Industry Revenue (Million), by Enterprise 2024 & 2032
- Figure 96: Australia and New Zealand Cloud Services Brokerage Industry Volume (K Unit), by Enterprise 2024 & 2032
- Figure 97: Australia and New Zealand Cloud Services Brokerage Industry Revenue Share (%), by Enterprise 2024 & 2032
- Figure 98: Australia and New Zealand Cloud Services Brokerage Industry Volume Share (%), by Enterprise 2024 & 2032
- Figure 99: Australia and New Zealand Cloud Services Brokerage Industry Revenue (Million), by End-user Industry 2024 & 2032
- Figure 100: Australia and New Zealand Cloud Services Brokerage Industry Volume (K Unit), by End-user Industry 2024 & 2032
- Figure 101: Australia and New Zealand Cloud Services Brokerage Industry Revenue Share (%), by End-user Industry 2024 & 2032
- Figure 102: Australia and New Zealand Cloud Services Brokerage Industry Volume Share (%), by End-user Industry 2024 & 2032
- Figure 103: Australia and New Zealand Cloud Services Brokerage Industry Revenue (Million), by Country 2024 & 2032
- Figure 104: Australia and New Zealand Cloud Services Brokerage Industry Volume (K Unit), by Country 2024 & 2032
- Figure 105: Australia and New Zealand Cloud Services Brokerage Industry Revenue Share (%), by Country 2024 & 2032
- Figure 106: Australia and New Zealand Cloud Services Brokerage Industry Volume Share (%), by Country 2024 & 2032
- Figure 107: Latin America Cloud Services Brokerage Industry Revenue (Million), by Platform 2024 & 2032
- Figure 108: Latin America Cloud Services Brokerage Industry Volume (K Unit), by Platform 2024 & 2032
- Figure 109: Latin America Cloud Services Brokerage Industry Revenue Share (%), by Platform 2024 & 2032
- Figure 110: Latin America Cloud Services Brokerage Industry Volume Share (%), by Platform 2024 & 2032
- Figure 111: Latin America Cloud Services Brokerage Industry Revenue (Million), by Deployment Model 2024 & 2032
- Figure 112: Latin America Cloud Services Brokerage Industry Volume (K Unit), by Deployment Model 2024 & 2032
- Figure 113: Latin America Cloud Services Brokerage Industry Revenue Share (%), by Deployment Model 2024 & 2032
- Figure 114: Latin America Cloud Services Brokerage Industry Volume Share (%), by Deployment Model 2024 & 2032
- Figure 115: Latin America Cloud Services Brokerage Industry Revenue (Million), by Enterprise 2024 & 2032
- Figure 116: Latin America Cloud Services Brokerage Industry Volume (K Unit), by Enterprise 2024 & 2032
- Figure 117: Latin America Cloud Services Brokerage Industry Revenue Share (%), by Enterprise 2024 & 2032
- Figure 118: Latin America Cloud Services Brokerage Industry Volume Share (%), by Enterprise 2024 & 2032
- Figure 119: Latin America Cloud Services Brokerage Industry Revenue (Million), by End-user Industry 2024 & 2032
- Figure 120: Latin America Cloud Services Brokerage Industry Volume (K Unit), by End-user Industry 2024 & 2032
- Figure 121: Latin America Cloud Services Brokerage Industry Revenue Share (%), by End-user Industry 2024 & 2032
- Figure 122: Latin America Cloud Services Brokerage Industry Volume Share (%), by End-user Industry 2024 & 2032
- Figure 123: Latin America Cloud Services Brokerage Industry Revenue (Million), by Country 2024 & 2032
- Figure 124: Latin America Cloud Services Brokerage Industry Volume (K Unit), by Country 2024 & 2032
- Figure 125: Latin America Cloud Services Brokerage Industry Revenue Share (%), by Country 2024 & 2032
- Figure 126: Latin America Cloud Services Brokerage Industry Volume Share (%), by Country 2024 & 2032
- Figure 127: Middle East and Africa Cloud Services Brokerage Industry Revenue (Million), by Platform 2024 & 2032
- Figure 128: Middle East and Africa Cloud Services Brokerage Industry Volume (K Unit), by Platform 2024 & 2032
- Figure 129: Middle East and Africa Cloud Services Brokerage Industry Revenue Share (%), by Platform 2024 & 2032
- Figure 130: Middle East and Africa Cloud Services Brokerage Industry Volume Share (%), by Platform 2024 & 2032
- Figure 131: Middle East and Africa Cloud Services Brokerage Industry Revenue (Million), by Deployment Model 2024 & 2032
- Figure 132: Middle East and Africa Cloud Services Brokerage Industry Volume (K Unit), by Deployment Model 2024 & 2032
- Figure 133: Middle East and Africa Cloud Services Brokerage Industry Revenue Share (%), by Deployment Model 2024 & 2032
- Figure 134: Middle East and Africa Cloud Services Brokerage Industry Volume Share (%), by Deployment Model 2024 & 2032
- Figure 135: Middle East and Africa Cloud Services Brokerage Industry Revenue (Million), by Enterprise 2024 & 2032
- Figure 136: Middle East and Africa Cloud Services Brokerage Industry Volume (K Unit), by Enterprise 2024 & 2032
- Figure 137: Middle East and Africa Cloud Services Brokerage Industry Revenue Share (%), by Enterprise 2024 & 2032
- Figure 138: Middle East and Africa Cloud Services Brokerage Industry Volume Share (%), by Enterprise 2024 & 2032
- Figure 139: Middle East and Africa Cloud Services Brokerage Industry Revenue (Million), by End-user Industry 2024 & 2032
- Figure 140: Middle East and Africa Cloud Services Brokerage Industry Volume (K Unit), by End-user Industry 2024 & 2032
- Figure 141: Middle East and Africa Cloud Services Brokerage Industry Revenue Share (%), by End-user Industry 2024 & 2032
- Figure 142: Middle East and Africa Cloud Services Brokerage Industry Volume Share (%), by End-user Industry 2024 & 2032
- Figure 143: Middle East and Africa Cloud Services Brokerage Industry Revenue (Million), by Country 2024 & 2032
- Figure 144: Middle East and Africa Cloud Services Brokerage Industry Volume (K Unit), by Country 2024 & 2032
- Figure 145: Middle East and Africa Cloud Services Brokerage Industry Revenue Share (%), by Country 2024 & 2032
- Figure 146: Middle East and Africa Cloud Services Brokerage Industry Volume Share (%), by Country 2024 & 2032
List of Tables
- Table 1: Global Cloud Services Brokerage Industry Revenue Million Forecast, by Region 2019 & 2032
- Table 2: Global Cloud Services Brokerage Industry Volume K Unit Forecast, by Region 2019 & 2032
- Table 3: Global Cloud Services Brokerage Industry Revenue Million Forecast, by Platform 2019 & 2032
- Table 4: Global Cloud Services Brokerage Industry Volume K Unit Forecast, by Platform 2019 & 2032
- Table 5: Global Cloud Services Brokerage Industry Revenue Million Forecast, by Deployment Model 2019 & 2032
- Table 6: Global Cloud Services Brokerage Industry Volume K Unit Forecast, by Deployment Model 2019 & 2032
- Table 7: Global Cloud Services Brokerage Industry Revenue Million Forecast, by Enterprise 2019 & 2032
- Table 8: Global Cloud Services Brokerage Industry Volume K Unit Forecast, by Enterprise 2019 & 2032
- Table 9: Global Cloud Services Brokerage Industry Revenue Million Forecast, by End-user Industry 2019 & 2032
- Table 10: Global Cloud Services Brokerage Industry Volume K Unit Forecast, by End-user Industry 2019 & 2032
- Table 11: Global Cloud Services Brokerage Industry Revenue Million Forecast, by Region 2019 & 2032
- Table 12: Global Cloud Services Brokerage Industry Volume K Unit Forecast, by Region 2019 & 2032
- Table 13: Global Cloud Services Brokerage Industry Revenue Million Forecast, by Country 2019 & 2032
- Table 14: Global Cloud Services Brokerage Industry Volume K Unit Forecast, by Country 2019 & 2032
- Table 15: United States Cloud Services Brokerage Industry Revenue (Million) Forecast, by Application 2019 & 2032
- Table 16: United States Cloud Services Brokerage Industry Volume (K Unit) Forecast, by Application 2019 & 2032
- Table 17: Canada Cloud Services Brokerage Industry Revenue (Million) Forecast, by Application 2019 & 2032
- Table 18: Canada Cloud Services Brokerage Industry Volume (K Unit) Forecast, by Application 2019 & 2032
- Table 19: Mexico Cloud Services Brokerage Industry Revenue (Million) Forecast, by Application 2019 & 2032
- Table 20: Mexico Cloud Services Brokerage Industry Volume (K Unit) Forecast, by Application 2019 & 2032
- Table 21: Global Cloud Services Brokerage Industry Revenue Million Forecast, by Country 2019 & 2032
- Table 22: Global Cloud Services Brokerage Industry Volume K Unit Forecast, by Country 2019 & 2032
- Table 23: Germany Cloud Services Brokerage Industry Revenue (Million) Forecast, by Application 2019 & 2032
- Table 24: Germany Cloud Services Brokerage Industry Volume (K Unit) Forecast, by Application 2019 & 2032
- Table 25: United Kingdom Cloud Services Brokerage Industry Revenue (Million) Forecast, by Application 2019 & 2032
- Table 26: United Kingdom Cloud Services Brokerage Industry Volume (K Unit) Forecast, by Application 2019 & 2032
- Table 27: France Cloud Services Brokerage Industry Revenue (Million) Forecast, by Application 2019 & 2032
- Table 28: France Cloud Services Brokerage Industry Volume (K Unit) Forecast, by Application 2019 & 2032
- Table 29: Spain Cloud Services Brokerage Industry Revenue (Million) Forecast, by Application 2019 & 2032
- Table 30: Spain Cloud Services Brokerage Industry Volume (K Unit) Forecast, by Application 2019 & 2032
- Table 31: Italy Cloud Services Brokerage Industry Revenue (Million) Forecast, by Application 2019 & 2032
- Table 32: Italy Cloud Services Brokerage Industry Volume (K Unit) Forecast, by Application 2019 & 2032
- Table 33: Spain Cloud Services Brokerage Industry Revenue (Million) Forecast, by Application 2019 & 2032
- Table 34: Spain Cloud Services Brokerage Industry Volume (K Unit) Forecast, by Application 2019 & 2032
- Table 35: Belgium Cloud Services Brokerage Industry Revenue (Million) Forecast, by Application 2019 & 2032
- Table 36: Belgium Cloud Services Brokerage Industry Volume (K Unit) Forecast, by Application 2019 & 2032
- Table 37: Netherland Cloud Services Brokerage Industry Revenue (Million) Forecast, by Application 2019 & 2032
- Table 38: Netherland Cloud Services Brokerage Industry Volume (K Unit) Forecast, by Application 2019 & 2032
- Table 39: Nordics Cloud Services Brokerage Industry Revenue (Million) Forecast, by Application 2019 & 2032
- Table 40: Nordics Cloud Services Brokerage Industry Volume (K Unit) Forecast, by Application 2019 & 2032
- Table 41: Rest of Europe Cloud Services Brokerage Industry Revenue (Million) Forecast, by Application 2019 & 2032
- Table 42: Rest of Europe Cloud Services Brokerage Industry Volume (K Unit) Forecast, by Application 2019 & 2032
- Table 43: Global Cloud Services Brokerage Industry Revenue Million Forecast, by Country 2019 & 2032
- Table 44: Global Cloud Services Brokerage Industry Volume K Unit Forecast, by Country 2019 & 2032
- Table 45: China Cloud Services Brokerage Industry Revenue (Million) Forecast, by Application 2019 & 2032
- Table 46: China Cloud Services Brokerage Industry Volume (K Unit) Forecast, by Application 2019 & 2032
- Table 47: Japan Cloud Services Brokerage Industry Revenue (Million) Forecast, by Application 2019 & 2032
- Table 48: Japan Cloud Services Brokerage Industry Volume (K Unit) Forecast, by Application 2019 & 2032
- Table 49: India Cloud Services Brokerage Industry Revenue (Million) Forecast, by Application 2019 & 2032
- Table 50: India Cloud Services Brokerage Industry Volume (K Unit) Forecast, by Application 2019 & 2032
- Table 51: South Korea Cloud Services Brokerage Industry Revenue (Million) Forecast, by Application 2019 & 2032
- Table 52: South Korea Cloud Services Brokerage Industry Volume (K Unit) Forecast, by Application 2019 & 2032
- Table 53: Southeast Asia Cloud Services Brokerage Industry Revenue (Million) Forecast, by Application 2019 & 2032
- Table 54: Southeast Asia Cloud Services Brokerage Industry Volume (K Unit) Forecast, by Application 2019 & 2032
- Table 55: Australia Cloud Services Brokerage Industry Revenue (Million) Forecast, by Application 2019 & 2032
- Table 56: Australia Cloud Services Brokerage Industry Volume (K Unit) Forecast, by Application 2019 & 2032
- Table 57: Indonesia Cloud Services Brokerage Industry Revenue (Million) Forecast, by Application 2019 & 2032
- Table 58: Indonesia Cloud Services Brokerage Industry Volume (K Unit) Forecast, by Application 2019 & 2032
- Table 59: Phillipes Cloud Services Brokerage Industry Revenue (Million) Forecast, by Application 2019 & 2032
- Table 60: Phillipes Cloud Services Brokerage Industry Volume (K Unit) Forecast, by Application 2019 & 2032
- Table 61: Singapore Cloud Services Brokerage Industry Revenue (Million) Forecast, by Application 2019 & 2032
- Table 62: Singapore Cloud Services Brokerage Industry Volume (K Unit) Forecast, by Application 2019 & 2032
- Table 63: Thailandc Cloud Services Brokerage Industry Revenue (Million) Forecast, by Application 2019 & 2032
- Table 64: Thailandc Cloud Services Brokerage Industry Volume (K Unit) Forecast, by Application 2019 & 2032
- Table 65: Rest of Asia Pacific Cloud Services Brokerage Industry Revenue (Million) Forecast, by Application 2019 & 2032
- Table 66: Rest of Asia Pacific Cloud Services Brokerage Industry Volume (K Unit) Forecast, by Application 2019 & 2032
- Table 67: Global Cloud Services Brokerage Industry Revenue Million Forecast, by Country 2019 & 2032
- Table 68: Global Cloud Services Brokerage Industry Volume K Unit Forecast, by Country 2019 & 2032
- Table 69: Brazil Cloud Services Brokerage Industry Revenue (Million) Forecast, by Application 2019 & 2032
- Table 70: Brazil Cloud Services Brokerage Industry Volume (K Unit) Forecast, by Application 2019 & 2032
- Table 71: Argentina Cloud Services Brokerage Industry Revenue (Million) Forecast, by Application 2019 & 2032
- Table 72: Argentina Cloud Services Brokerage Industry Volume (K Unit) Forecast, by Application 2019 & 2032
- Table 73: Peru Cloud Services Brokerage Industry Revenue (Million) Forecast, by Application 2019 & 2032
- Table 74: Peru Cloud Services Brokerage Industry Volume (K Unit) Forecast, by Application 2019 & 2032
- Table 75: Chile Cloud Services Brokerage Industry Revenue (Million) Forecast, by Application 2019 & 2032
- Table 76: Chile Cloud Services Brokerage Industry Volume (K Unit) Forecast, by Application 2019 & 2032
- Table 77: Colombia Cloud Services Brokerage Industry Revenue (Million) Forecast, by Application 2019 & 2032
- Table 78: Colombia Cloud Services Brokerage Industry Volume (K Unit) Forecast, by Application 2019 & 2032
- Table 79: Ecuador Cloud Services Brokerage Industry Revenue (Million) Forecast, by Application 2019 & 2032
- Table 80: Ecuador Cloud Services Brokerage Industry Volume (K Unit) Forecast, by Application 2019 & 2032
- Table 81: Venezuela Cloud Services Brokerage Industry Revenue (Million) Forecast, by Application 2019 & 2032
- Table 82: Venezuela Cloud Services Brokerage Industry Volume (K Unit) Forecast, by Application 2019 & 2032
- Table 83: Rest of South America Cloud Services Brokerage Industry Revenue (Million) Forecast, by Application 2019 & 2032
- Table 84: Rest of South America Cloud Services Brokerage Industry Volume (K Unit) Forecast, by Application 2019 & 2032
- Table 85: Global Cloud Services Brokerage Industry Revenue Million Forecast, by Country 2019 & 2032
- Table 86: Global Cloud Services Brokerage Industry Volume K Unit Forecast, by Country 2019 & 2032
- Table 87: United States Cloud Services Brokerage Industry Revenue (Million) Forecast, by Application 2019 & 2032
- Table 88: United States Cloud Services Brokerage Industry Volume (K Unit) Forecast, by Application 2019 & 2032
- Table 89: Canada Cloud Services Brokerage Industry Revenue (Million) Forecast, by Application 2019 & 2032
- Table 90: Canada Cloud Services Brokerage Industry Volume (K Unit) Forecast, by Application 2019 & 2032
- Table 91: Mexico Cloud Services Brokerage Industry Revenue (Million) Forecast, by Application 2019 & 2032
- Table 92: Mexico Cloud Services Brokerage Industry Volume (K Unit) Forecast, by Application 2019 & 2032
- Table 93: Global Cloud Services Brokerage Industry Revenue Million Forecast, by Country 2019 & 2032
- Table 94: Global Cloud Services Brokerage Industry Volume K Unit Forecast, by Country 2019 & 2032
- Table 95: United Arab Emirates Cloud Services Brokerage Industry Revenue (Million) Forecast, by Application 2019 & 2032
- Table 96: United Arab Emirates Cloud Services Brokerage Industry Volume (K Unit) Forecast, by Application 2019 & 2032
- Table 97: Saudi Arabia Cloud Services Brokerage Industry Revenue (Million) Forecast, by Application 2019 & 2032
- Table 98: Saudi Arabia Cloud Services Brokerage Industry Volume (K Unit) Forecast, by Application 2019 & 2032
- Table 99: South Africa Cloud Services Brokerage Industry Revenue (Million) Forecast, by Application 2019 & 2032
- Table 100: South Africa Cloud Services Brokerage Industry Volume (K Unit) Forecast, by Application 2019 & 2032
- Table 101: Rest of Middle East and Africa Cloud Services Brokerage Industry Revenue (Million) Forecast, by Application 2019 & 2032
- Table 102: Rest of Middle East and Africa Cloud Services Brokerage Industry Volume (K Unit) Forecast, by Application 2019 & 2032
- Table 103: Global Cloud Services Brokerage Industry Revenue Million Forecast, by Platform 2019 & 2032
- Table 104: Global Cloud Services Brokerage Industry Volume K Unit Forecast, by Platform 2019 & 2032
- Table 105: Global Cloud Services Brokerage Industry Revenue Million Forecast, by Deployment Model 2019 & 2032
- Table 106: Global Cloud Services Brokerage Industry Volume K Unit Forecast, by Deployment Model 2019 & 2032
- Table 107: Global Cloud Services Brokerage Industry Revenue Million Forecast, by Enterprise 2019 & 2032
- Table 108: Global Cloud Services Brokerage Industry Volume K Unit Forecast, by Enterprise 2019 & 2032
- Table 109: Global Cloud Services Brokerage Industry Revenue Million Forecast, by End-user Industry 2019 & 2032
- Table 110: Global Cloud Services Brokerage Industry Volume K Unit Forecast, by End-user Industry 2019 & 2032
- Table 111: Global Cloud Services Brokerage Industry Revenue Million Forecast, by Country 2019 & 2032
- Table 112: Global Cloud Services Brokerage Industry Volume K Unit Forecast, by Country 2019 & 2032
- Table 113: United States Cloud Services Brokerage Industry Revenue (Million) Forecast, by Application 2019 & 2032
- Table 114: United States Cloud Services Brokerage Industry Volume (K Unit) Forecast, by Application 2019 & 2032
- Table 115: Canada Cloud Services Brokerage Industry Revenue (Million) Forecast, by Application 2019 & 2032
- Table 116: Canada Cloud Services Brokerage Industry Volume (K Unit) Forecast, by Application 2019 & 2032
- Table 117: Global Cloud Services Brokerage Industry Revenue Million Forecast, by Platform 2019 & 2032
- Table 118: Global Cloud Services Brokerage Industry Volume K Unit Forecast, by Platform 2019 & 2032
- Table 119: Global Cloud Services Brokerage Industry Revenue Million Forecast, by Deployment Model 2019 & 2032
- Table 120: Global Cloud Services Brokerage Industry Volume K Unit Forecast, by Deployment Model 2019 & 2032
- Table 121: Global Cloud Services Brokerage Industry Revenue Million Forecast, by Enterprise 2019 & 2032
- Table 122: Global Cloud Services Brokerage Industry Volume K Unit Forecast, by Enterprise 2019 & 2032
- Table 123: Global Cloud Services Brokerage Industry Revenue Million Forecast, by End-user Industry 2019 & 2032
- Table 124: Global Cloud Services Brokerage Industry Volume K Unit Forecast, by End-user Industry 2019 & 2032
- Table 125: Global Cloud Services Brokerage Industry Revenue Million Forecast, by Country 2019 & 2032
- Table 126: Global Cloud Services Brokerage Industry Volume K Unit Forecast, by Country 2019 & 2032
- Table 127: Germany Cloud Services Brokerage Industry Revenue (Million) Forecast, by Application 2019 & 2032
- Table 128: Germany Cloud Services Brokerage Industry Volume (K Unit) Forecast, by Application 2019 & 2032
- Table 129: United Kingdom Cloud Services Brokerage Industry Revenue (Million) Forecast, by Application 2019 & 2032
- Table 130: United Kingdom Cloud Services Brokerage Industry Volume (K Unit) Forecast, by Application 2019 & 2032
- Table 131: France Cloud Services Brokerage Industry Revenue (Million) Forecast, by Application 2019 & 2032
- Table 132: France Cloud Services Brokerage Industry Volume (K Unit) Forecast, by Application 2019 & 2032
- Table 133: Global Cloud Services Brokerage Industry Revenue Million Forecast, by Platform 2019 & 2032
- Table 134: Global Cloud Services Brokerage Industry Volume K Unit Forecast, by Platform 2019 & 2032
- Table 135: Global Cloud Services Brokerage Industry Revenue Million Forecast, by Deployment Model 2019 & 2032
- Table 136: Global Cloud Services Brokerage Industry Volume K Unit Forecast, by Deployment Model 2019 & 2032
- Table 137: Global Cloud Services Brokerage Industry Revenue Million Forecast, by Enterprise 2019 & 2032
- Table 138: Global Cloud Services Brokerage Industry Volume K Unit Forecast, by Enterprise 2019 & 2032
- Table 139: Global Cloud Services Brokerage Industry Revenue Million Forecast, by End-user Industry 2019 & 2032
- Table 140: Global Cloud Services Brokerage Industry Volume K Unit Forecast, by End-user Industry 2019 & 2032
- Table 141: Global Cloud Services Brokerage Industry Revenue Million Forecast, by Country 2019 & 2032
- Table 142: Global Cloud Services Brokerage Industry Volume K Unit Forecast, by Country 2019 & 2032
- Table 143: China Cloud Services Brokerage Industry Revenue (Million) Forecast, by Application 2019 & 2032
- Table 144: China Cloud Services Brokerage Industry Volume (K Unit) Forecast, by Application 2019 & 2032
- Table 145: Japan Cloud Services Brokerage Industry Revenue (Million) Forecast, by Application 2019 & 2032
- Table 146: Japan Cloud Services Brokerage Industry Volume (K Unit) Forecast, by Application 2019 & 2032
- Table 147: India Cloud Services Brokerage Industry Revenue (Million) Forecast, by Application 2019 & 2032
- Table 148: India Cloud Services Brokerage Industry Volume (K Unit) Forecast, by Application 2019 & 2032
- Table 149: Global Cloud Services Brokerage Industry Revenue Million Forecast, by Platform 2019 & 2032
- Table 150: Global Cloud Services Brokerage Industry Volume K Unit Forecast, by Platform 2019 & 2032
- Table 151: Global Cloud Services Brokerage Industry Revenue Million Forecast, by Deployment Model 2019 & 2032
- Table 152: Global Cloud Services Brokerage Industry Volume K Unit Forecast, by Deployment Model 2019 & 2032
- Table 153: Global Cloud Services Brokerage Industry Revenue Million Forecast, by Enterprise 2019 & 2032
- Table 154: Global Cloud Services Brokerage Industry Volume K Unit Forecast, by Enterprise 2019 & 2032
- Table 155: Global Cloud Services Brokerage Industry Revenue Million Forecast, by End-user Industry 2019 & 2032
- Table 156: Global Cloud Services Brokerage Industry Volume K Unit Forecast, by End-user Industry 2019 & 2032
- Table 157: Global Cloud Services Brokerage Industry Revenue Million Forecast, by Country 2019 & 2032
- Table 158: Global Cloud Services Brokerage Industry Volume K Unit Forecast, by Country 2019 & 2032
- Table 159: Global Cloud Services Brokerage Industry Revenue Million Forecast, by Platform 2019 & 2032
- Table 160: Global Cloud Services Brokerage Industry Volume K Unit Forecast, by Platform 2019 & 2032
- Table 161: Global Cloud Services Brokerage Industry Revenue Million Forecast, by Deployment Model 2019 & 2032
- Table 162: Global Cloud Services Brokerage Industry Volume K Unit Forecast, by Deployment Model 2019 & 2032
- Table 163: Global Cloud Services Brokerage Industry Revenue Million Forecast, by Enterprise 2019 & 2032
- Table 164: Global Cloud Services Brokerage Industry Volume K Unit Forecast, by Enterprise 2019 & 2032
- Table 165: Global Cloud Services Brokerage Industry Revenue Million Forecast, by End-user Industry 2019 & 2032
- Table 166: Global Cloud Services Brokerage Industry Volume K Unit Forecast, by End-user Industry 2019 & 2032
- Table 167: Global Cloud Services Brokerage Industry Revenue Million Forecast, by Country 2019 & 2032
- Table 168: Global Cloud Services Brokerage Industry Volume K Unit Forecast, by Country 2019 & 2032
- Table 169: Mexico Cloud Services Brokerage Industry Revenue (Million) Forecast, by Application 2019 & 2032
- Table 170: Mexico Cloud Services Brokerage Industry Volume (K Unit) Forecast, by Application 2019 & 2032
- Table 171: Brazil Cloud Services Brokerage Industry Revenue (Million) Forecast, by Application 2019 & 2032
- Table 172: Brazil Cloud Services Brokerage Industry Volume (K Unit) Forecast, by Application 2019 & 2032
- Table 173: Argentina Cloud Services Brokerage Industry Revenue (Million) Forecast, by Application 2019 & 2032
- Table 174: Argentina Cloud Services Brokerage Industry Volume (K Unit) Forecast, by Application 2019 & 2032
- Table 175: Global Cloud Services Brokerage Industry Revenue Million Forecast, by Platform 2019 & 2032
- Table 176: Global Cloud Services Brokerage Industry Volume K Unit Forecast, by Platform 2019 & 2032
- Table 177: Global Cloud Services Brokerage Industry Revenue Million Forecast, by Deployment Model 2019 & 2032
- Table 178: Global Cloud Services Brokerage Industry Volume K Unit Forecast, by Deployment Model 2019 & 2032
- Table 179: Global Cloud Services Brokerage Industry Revenue Million Forecast, by Enterprise 2019 & 2032
- Table 180: Global Cloud Services Brokerage Industry Volume K Unit Forecast, by Enterprise 2019 & 2032
- Table 181: Global Cloud Services Brokerage Industry Revenue Million Forecast, by End-user Industry 2019 & 2032
- Table 182: Global Cloud Services Brokerage Industry Volume K Unit Forecast, by End-user Industry 2019 & 2032
- Table 183: Global Cloud Services Brokerage Industry Revenue Million Forecast, by Country 2019 & 2032
- Table 184: Global Cloud Services Brokerage Industry Volume K Unit Forecast, by Country 2019 & 2032
- Table 185: United Arab Emirates Cloud Services Brokerage Industry Revenue (Million) Forecast, by Application 2019 & 2032
- Table 186: United Arab Emirates Cloud Services Brokerage Industry Volume (K Unit) Forecast, by Application 2019 & 2032
- Table 187: Saudi Arabia Cloud Services Brokerage Industry Revenue (Million) Forecast, by Application 2019 & 2032
- Table 188: Saudi Arabia Cloud Services Brokerage Industry Volume (K Unit) Forecast, by Application 2019 & 2032
Frequently Asked Questions
1. What is the projected Compound Annual Growth Rate (CAGR) of the Cloud Services Brokerage Industry?
The projected CAGR is approximately 16.08%.
2. Which companies are prominent players in the Cloud Services Brokerage Industry?
Key companies in the market include Cognizant Technology Solutions Corp , Wipro Limited, Accenture PLC, IBM Corporation, Capgemini SE, NTT Data Inc, Rightscale Inc, DXC Technology Company, NEC Corporation.
3. What are the main segments of the Cloud Services Brokerage Industry?
The market segments include Platform, Deployment Model, Enterprise, End-user Industry.
4. Can you provide details about the market size?
The market size is estimated to be USD 8.60 Million as of 2022.
5. What are some drivers contributing to market growth?
Increasing Adoption of Hybrid and Multi-cloud Environment; Increasing Adoption of Cloud Computing Services.
6. What are the notable trends driving market growth?
Internal Cloud Services Brokerage is Expected to Hold the Major Share.
7. Are there any restraints impacting market growth?
Lack of Awareness and Security Concerns.
8. Can you provide examples of recent developments in the market?
January 2023: EY unveiled its innovative retail solution, which leverages the power of the Microsoft Cloud to enhance the seamlessness of the user shopping experience. This integrated solution seamlessly connects all consumer touchpoints, enabling shoppers to effortlessly transition between online shopping, mobile apps, physical stores, or contact centers at any time. By harnessing the capabilities of Microsoft Cloud and Cloud for Retail, this system gathers data from various channels. It transforms it into valuable insights using cutting-edge technologies such as artificial intelligence (AI), image recognition, and advanced analytics.
9. What pricing options are available for accessing the report?
Pricing options include single-user, multi-user, and enterprise licenses priced at USD 4750, USD 5250, and USD 8750 respectively.
10. Is the market size provided in terms of value or volume?
The market size is provided in terms of value, measured in Million and volume, measured in K Unit.
11. Are there any specific market keywords associated with the report?
Yes, the market keyword associated with the report is "Cloud Services Brokerage Industry," which aids in identifying and referencing the specific market segment covered.
12. How do I determine which pricing option suits my needs best?
The pricing options vary based on user requirements and access needs. Individual users may opt for single-user licenses, while businesses requiring broader access may choose multi-user or enterprise licenses for cost-effective access to the report.
13. Are there any additional resources or data provided in the Cloud Services Brokerage Industry report?
While the report offers comprehensive insights, it's advisable to review the specific contents or supplementary materials provided to ascertain if additional resources or data are available.
14. How can I stay updated on further developments or reports in the Cloud Services Brokerage Industry?
To stay informed about further developments, trends, and reports in the Cloud Services Brokerage Industry, consider subscribing to industry newsletters, following relevant companies and organizations, or regularly checking reputable industry news sources and publications.
Methodology
Step 1 - Identification of Relevant Samples Size from Population Database


Step 2 - Approaches for Defining Global Market Size (Value, Volume* & Price*)

Note*: In applicable scenarios
Step 3 - Data Sources
Primary Research
- Web Analytics
- Survey Reports
- Research Institute
- Latest Research Reports
- Opinion Leaders
Secondary Research
- Annual Reports
- White Paper
- Latest Press Release
- Industry Association
- Paid Database
- Investor Presentations

Step 4 - Data Triangulation
Involves using different sources of information in order to increase the validity of a study
These sources are likely to be stakeholders in a program - participants, other researchers, program staff, other community members, and so on.
Then we put all data in single framework & apply various statistical tools to find out the dynamic on the market.
During the analysis stage, feedback from the stakeholder groups would be compared to determine areas of agreement as well as areas of divergence


