
Key Insights
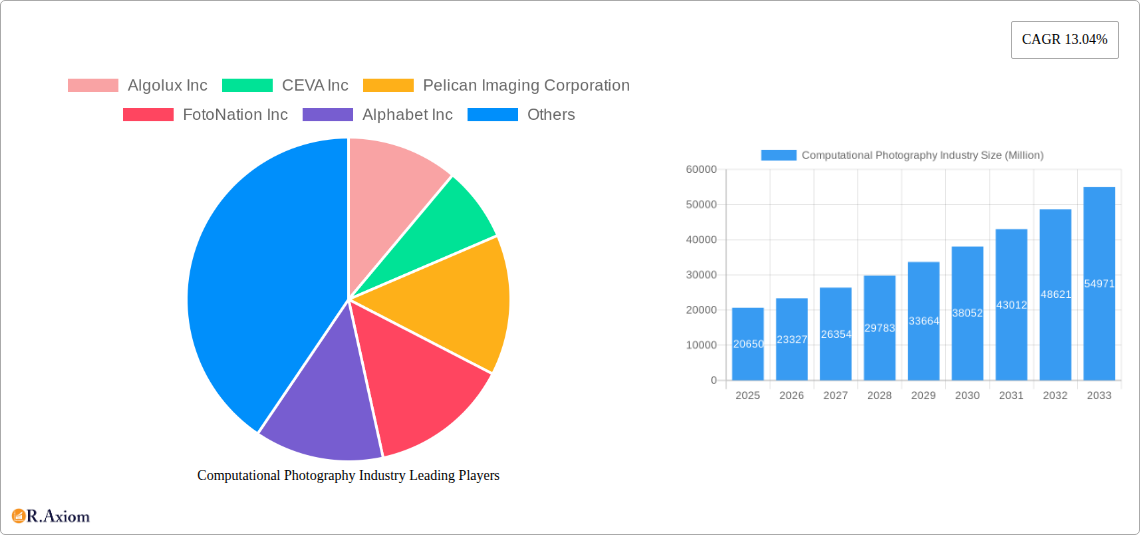
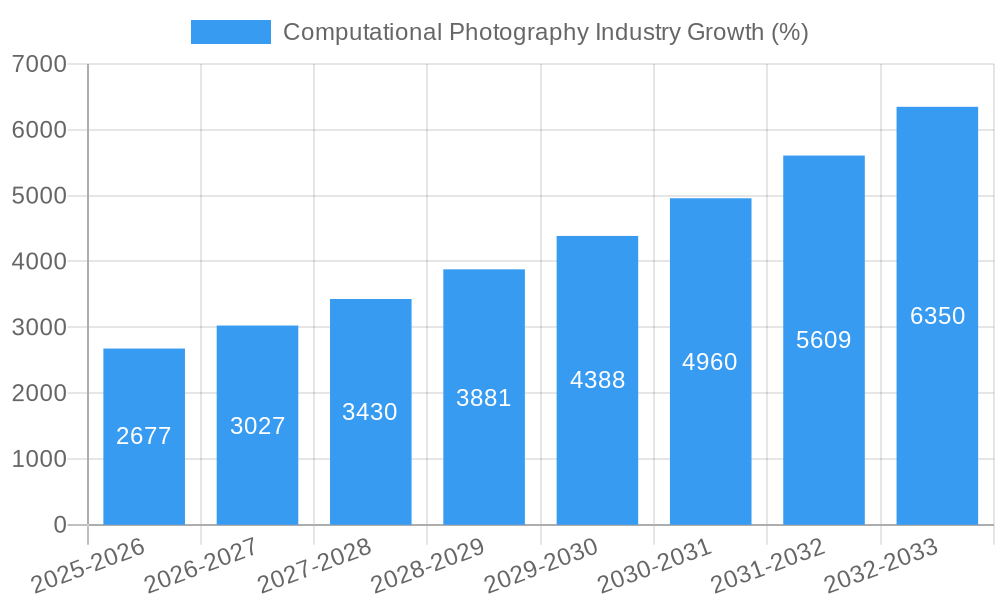
The computational photography market is experiencing robust growth, projected to reach $20.65 billion in 2025 and exhibiting a Compound Annual Growth Rate (CAGR) of 13.04%. This expansion is driven by several key factors. The increasing demand for high-quality images and videos in smartphones is a major catalyst, fueling innovation in camera module technology. Advancements in artificial intelligence (AI) and machine learning (ML) algorithms are enabling sophisticated features like enhanced low-light performance, computational zoom, and bokeh effects, further driving market growth. The integration of computational photography into machine vision applications, such as robotics and autonomous vehicles, is another significant driver. These applications require precise and reliable image processing capabilities that computational photography solutions effectively deliver. Finally, the continuous development of new camera technologies, including multi-lens systems and novel sensor designs, is creating opportunities for market expansion. The market is segmented by camera type (single/dual-lens, 16-lens, etc.), application (smartphone cameras, machine vision, other), and offerings (camera modules and software).
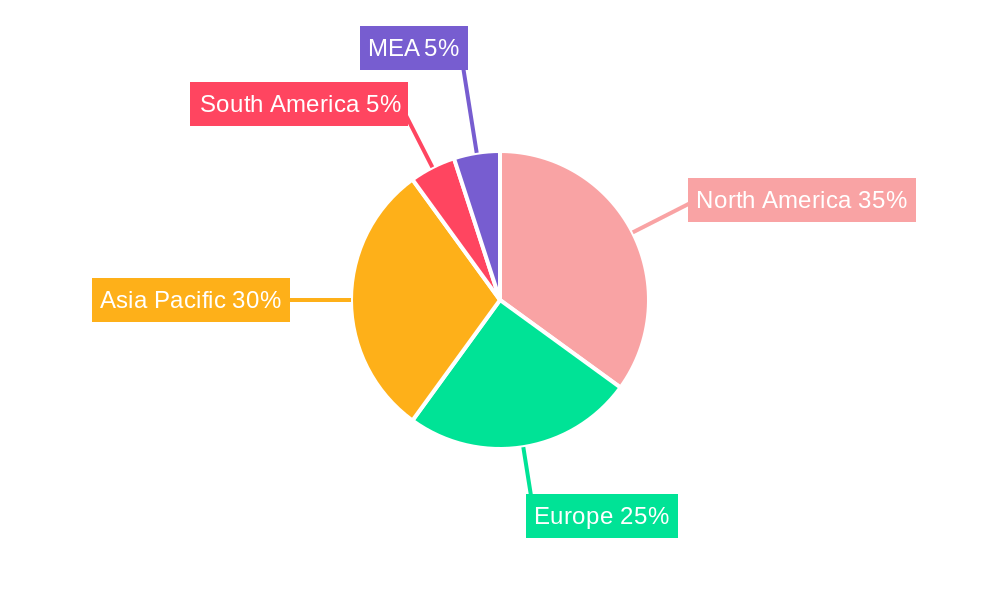
Despite this positive outlook, challenges remain. High development and manufacturing costs associated with advanced camera technologies could impede market penetration, particularly in price-sensitive segments. Furthermore, the complexity of integrating computational photography algorithms into diverse hardware platforms and software ecosystems can pose significant hurdles. Competition among established players like Apple, Qualcomm, and Google, along with innovative startups, is intense, leading to pressure on pricing and profit margins. However, ongoing technological advancements and increasing consumer demand for advanced imaging capabilities are expected to outweigh these restraints, resulting in sustained market growth throughout the forecast period (2025-2033). Regional growth will be diverse; North America and Asia-Pacific will likely dominate due to high smartphone penetration and technological advancements in these regions.
Computational Photography Industry Market Report: 2019-2033
This comprehensive report provides a detailed analysis of the Computational Photography industry, covering market size, segmentation, growth drivers, challenges, and key players. The study period spans from 2019 to 2033, with 2025 as the base and estimated year. The report offers actionable insights for industry stakeholders, including manufacturers, investors, and researchers. The global Computational Photography market is projected to reach xx Million by 2033, exhibiting a CAGR of xx% during the forecast period (2025-2033).
Computational Photography Industry Market Concentration & Innovation
The Computational Photography market exhibits a moderately concentrated landscape, with a few dominant players holding significant market share. Key players such as Qualcomm Technologies Inc and Apple Inc. account for a substantial portion of the overall revenue. However, the market also features several smaller, innovative companies contributing to technological advancements. The industry is characterized by intense competition, fueled by rapid technological innovations and evolving consumer demands.
Market Concentration Metrics (2024 Estimates):
- Top 5 players: xx% market share
- Top 10 players: xx% market share
Innovation Drivers:
- Advancements in AI and machine learning algorithms are enabling superior image processing and computational photography features.
- Miniaturization of camera sensors and lenses is facilitating the integration of advanced features into smaller devices.
- Increased demand for high-quality images and videos across diverse applications, particularly in smartphones and machine vision.
Regulatory Frameworks:
Regulatory bodies globally are increasingly focusing on data privacy and security related to image capture and processing. This drives companies to implement robust data protection measures.
Product Substitutes:
Traditional photography methods pose minimal threat, given the advanced capabilities and convenience of computational photography.
End-User Trends:
Consumers increasingly demand superior image quality, advanced features (like night mode and portrait mode), and seamless integration across devices.
M&A Activities:
The industry has witnessed several mergers and acquisitions (M&A) in recent years, with deal values ranging from xx Million to xx Million. These activities have resulted in enhanced product portfolios and market consolidation.
Computational Photography Industry Industry Trends & Insights
The Computational Photography market is experiencing robust growth, driven by several key factors. The rising adoption of smartphones with advanced camera features is a major catalyst, along with the increasing demand for high-quality images in various applications like machine vision, augmented reality (AR), and virtual reality (VR). Technological advancements, such as the development of more sophisticated algorithms and sensors, are further fueling market expansion. Consumer preferences are shifting toward devices with superior imaging capabilities, prompting manufacturers to invest heavily in R&D. The competitive landscape is marked by intense rivalry among established players and emerging startups, leading to continuous innovation and product diversification.
Market Growth Drivers:
- Increasing smartphone penetration globally
- Growing demand for high-quality images in diverse applications
- Advancements in AI and machine learning
- Development of new sensor technologies
- Rising adoption of AR/VR technologies
Technological Disruptions:
- The integration of AI and machine learning capabilities is revolutionizing image processing and enhancing image quality significantly.
- Development of advanced sensor technologies, such as multi-lens cameras and high-resolution sensors, is driving market growth.
Consumer Preferences:
- Consumers prioritize high-quality image and video capture, advanced features, and user-friendly interfaces.
- The demand for computational photography features such as HDR, night mode, and portrait mode continues to grow.
Competitive Dynamics:
- The market is highly competitive, with several established players and emerging startups vying for market share.
- Intense competition is driving innovation and continuous improvement of camera technology.
Dominant Markets & Segments in Computational Photography Industry
The smartphone camera segment dominates the Computational Photography market, accounting for the largest share of overall revenue. The North American and Asian regions are leading markets due to high smartphone penetration and strong consumer demand for advanced camera features.
Dominant Segments:
- Type: Single- and dual-lens cameras hold the largest market share currently, but the adoption of multi-lens cameras (e.g., 16-lens) is increasing.
- Application: Smartphone cameras contribute significantly to market revenue, followed by machine vision cameras, which are rapidly gaining traction in industrial automation and security applications.
- Offerings: Both camera modules and software contribute substantially to market value.
Key Drivers for Dominant Segments:
- Smartphone Cameras: High smartphone penetration, increasing demand for high-quality images, and continuous technological advancements.
- Machine Vision Cameras: Growth in industrial automation, security surveillance, and autonomous vehicle applications.
Regional Dominance:
- North America and Asia are the leading regions due to high smartphone adoption rates, advanced technological infrastructure, and strong consumer demand. Europe follows, with significant growth potential in developing economies.
Computational Photography Industry Product Developments
Recent product innovations focus on enhancing image quality, expanding functionality, and improving energy efficiency. New camera modules are incorporating advanced sensor technologies, including larger sensor sizes and higher resolutions. Software developments are leveraging AI and machine learning algorithms to improve image processing and introduce new features like computational photography capabilities. These innovations cater to the growing consumer demand for superior imaging performance in smartphones and other applications. The market fit is strong, as these advancements address key consumer needs and expectations.
Report Scope & Segmentation Analysis
This report segments the Computational Photography market by Type (Single- and Dual-Lens Cameras, 16-Lens Cameras), Application (Smartphone Cameras, Machine Vision Cameras, Other Applications), and Offerings (Camera Modules, Software). Each segment's growth projections, market size, and competitive dynamics are analyzed in detail. The market size is expected to grow at a significant rate during the forecast period, with smartphone cameras continuing to dominate, followed by machine vision cameras.
Key Drivers of Computational Photography Industry Growth
The Computational Photography industry's growth is fueled by several key factors: the increasing demand for high-quality images and videos across various applications; technological advancements, including the development of sophisticated algorithms and sensor technologies; and rising smartphone penetration globally. Government initiatives promoting technological innovation and digitalization are also stimulating industry growth.
Challenges in the Computational Photography Industry Sector
Key challenges include intense competition among established players and new entrants, requiring continuous innovation and product differentiation. Supply chain disruptions and component shortages can impact manufacturing and product availability. Moreover, the industry faces regulatory hurdles related to data privacy and intellectual property. These factors, together with cost pressures, can potentially constrain industry growth in the short term.
Emerging Opportunities in Computational Photography Industry
Emerging opportunities exist in expanding into new applications such as AR/VR, autonomous vehicles, and medical imaging. The development of novel sensor technologies and algorithms promises to enhance image quality, processing speed, and energy efficiency. Focusing on user-friendly interfaces and integrating advanced features into everyday devices offers further growth potential.
Leading Players in the Computational Photography Industry Market
- Algolux Inc
- CEVA Inc
- Pelican Imaging Corporation
- FotoNation Inc
- Alphabet Inc
- Light Labs Inc
- Qualcomm Technologies Inc
- Almalence Inc
- Nvidia Corporation
- Apple Inc
Key Developments in Computational Photography Industry Industry
- February 2023: Qualcomm Technologies announced its 6th generation modem-to-antenna solution, supporting 5G Advanced. This boosts connectivity, impacting smartphone and other device camera capabilities.
- September 2022: Nvidia Corporation launched Jetson Orin Nano system-on-modules, significantly increasing performance for edge AI and robotics applications, impacting machine vision camera development.
Strategic Outlook for Computational Photography Industry Market
The Computational Photography market is poised for continued growth, driven by ongoing technological advancements, rising demand for high-quality images across diverse applications, and increasing smartphone penetration. The focus on developing innovative camera technologies, incorporating AI and machine learning, and expanding into new applications will be critical for success in this dynamic market. Companies that can effectively address consumer preferences and adapt to evolving technological trends are likely to gain a competitive advantage.
Computational Photography Industry Segmentation
-
1. Offerings
- 1.1. Camera Modules
- 1.2. Software
-
2. Type
- 2.1. Single- and Dual-Lens Cameras
- 2.2. 16-Lens Cameras
-
3. Application
- 3.1. Smartphone Cameras
- 3.2. Machine Vision Cameras
- 3.3. Other Applications
Computational Photography Industry Segmentation By Geography
- 1. North America
- 2. Europe
- 3. Asia Pacific
- 4. South America
- 5. Rest of the World
Computational Photography Industry REPORT HIGHLIGHTS
| Aspects | Details |
|---|---|
| Study Period | 2019-2033 |
| Base Year | 2024 |
| Estimated Year | 2025 |
| Forecast Period | 2025-2033 |
| Historical Period | 2019-2024 |
| Growth Rate | CAGR of 13.04% from 2019-2033 |
| Segmentation |
|
Table of Contents
- 1. Introduction
- 1.1. Research Scope
- 1.2. Market Segmentation
- 1.3. Research Methodology
- 1.4. Definitions and Assumptions
- 2. Executive Summary
- 2.1. Introduction
- 3. Market Dynamics
- 3.1. Introduction
- 3.2. Market Drivers
- 3.2.1. Growing Adoption of Image Fusion Technique to Achieve High-quality Image; Increasing Demand for High-resolution Computational Cameras in Machine Vision for Autonomous Vehicle
- 3.3. Market Restrains
- 3.3.1. High Manufacturing and Maintenance Costs
- 3.4. Market Trends
- 3.4.1. Smartphone Cameras to Witness Significant Market Growth
- 4. Market Factor Analysis
- 4.1. Porters Five Forces
- 4.2. Supply/Value Chain
- 4.3. PESTEL analysis
- 4.4. Market Entropy
- 4.5. Patent/Trademark Analysis
- 5. Global Computational Photography Industry Analysis, Insights and Forecast, 2019-2031
- 5.1. Market Analysis, Insights and Forecast - by Offerings
- 5.1.1. Camera Modules
- 5.1.2. Software
- 5.2. Market Analysis, Insights and Forecast - by Type
- 5.2.1. Single- and Dual-Lens Cameras
- 5.2.2. 16-Lens Cameras
- 5.3. Market Analysis, Insights and Forecast - by Application
- 5.3.1. Smartphone Cameras
- 5.3.2. Machine Vision Cameras
- 5.3.3. Other Applications
- 5.4. Market Analysis, Insights and Forecast - by Region
- 5.4.1. North America
- 5.4.2. Europe
- 5.4.3. Asia Pacific
- 5.4.4. South America
- 5.4.5. Rest of the World
- 5.1. Market Analysis, Insights and Forecast - by Offerings
- 6. North America Computational Photography Industry Analysis, Insights and Forecast, 2019-2031
- 6.1. Market Analysis, Insights and Forecast - by Offerings
- 6.1.1. Camera Modules
- 6.1.2. Software
- 6.2. Market Analysis, Insights and Forecast - by Type
- 6.2.1. Single- and Dual-Lens Cameras
- 6.2.2. 16-Lens Cameras
- 6.3. Market Analysis, Insights and Forecast - by Application
- 6.3.1. Smartphone Cameras
- 6.3.2. Machine Vision Cameras
- 6.3.3. Other Applications
- 6.1. Market Analysis, Insights and Forecast - by Offerings
- 7. Europe Computational Photography Industry Analysis, Insights and Forecast, 2019-2031
- 7.1. Market Analysis, Insights and Forecast - by Offerings
- 7.1.1. Camera Modules
- 7.1.2. Software
- 7.2. Market Analysis, Insights and Forecast - by Type
- 7.2.1. Single- and Dual-Lens Cameras
- 7.2.2. 16-Lens Cameras
- 7.3. Market Analysis, Insights and Forecast - by Application
- 7.3.1. Smartphone Cameras
- 7.3.2. Machine Vision Cameras
- 7.3.3. Other Applications
- 7.1. Market Analysis, Insights and Forecast - by Offerings
- 8. Asia Pacific Computational Photography Industry Analysis, Insights and Forecast, 2019-2031
- 8.1. Market Analysis, Insights and Forecast - by Offerings
- 8.1.1. Camera Modules
- 8.1.2. Software
- 8.2. Market Analysis, Insights and Forecast - by Type
- 8.2.1. Single- and Dual-Lens Cameras
- 8.2.2. 16-Lens Cameras
- 8.3. Market Analysis, Insights and Forecast - by Application
- 8.3.1. Smartphone Cameras
- 8.3.2. Machine Vision Cameras
- 8.3.3. Other Applications
- 8.1. Market Analysis, Insights and Forecast - by Offerings
- 9. South America Computational Photography Industry Analysis, Insights and Forecast, 2019-2031
- 9.1. Market Analysis, Insights and Forecast - by Offerings
- 9.1.1. Camera Modules
- 9.1.2. Software
- 9.2. Market Analysis, Insights and Forecast - by Type
- 9.2.1. Single- and Dual-Lens Cameras
- 9.2.2. 16-Lens Cameras
- 9.3. Market Analysis, Insights and Forecast - by Application
- 9.3.1. Smartphone Cameras
- 9.3.2. Machine Vision Cameras
- 9.3.3. Other Applications
- 9.1. Market Analysis, Insights and Forecast - by Offerings
- 10. Rest of the World Computational Photography Industry Analysis, Insights and Forecast, 2019-2031
- 10.1. Market Analysis, Insights and Forecast - by Offerings
- 10.1.1. Camera Modules
- 10.1.2. Software
- 10.2. Market Analysis, Insights and Forecast - by Type
- 10.2.1. Single- and Dual-Lens Cameras
- 10.2.2. 16-Lens Cameras
- 10.3. Market Analysis, Insights and Forecast - by Application
- 10.3.1. Smartphone Cameras
- 10.3.2. Machine Vision Cameras
- 10.3.3. Other Applications
- 10.1. Market Analysis, Insights and Forecast - by Offerings
- 11. North America Computational Photography Industry Analysis, Insights and Forecast, 2019-2031
- 11.1. Market Analysis, Insights and Forecast - By Country/Sub-region
- 11.1.1 United States
- 11.1.2 Canada
- 11.1.3 Mexico
- 12. Europe Computational Photography Industry Analysis, Insights and Forecast, 2019-2031
- 12.1. Market Analysis, Insights and Forecast - By Country/Sub-region
- 12.1.1 Germany
- 12.1.2 United Kingdom
- 12.1.3 France
- 12.1.4 Spain
- 12.1.5 Italy
- 12.1.6 Spain
- 12.1.7 Belgium
- 12.1.8 Netherland
- 12.1.9 Nordics
- 12.1.10 Rest of Europe
- 13. Asia Pacific Computational Photography Industry Analysis, Insights and Forecast, 2019-2031
- 13.1. Market Analysis, Insights and Forecast - By Country/Sub-region
- 13.1.1 China
- 13.1.2 Japan
- 13.1.3 India
- 13.1.4 South Korea
- 13.1.5 Southeast Asia
- 13.1.6 Australia
- 13.1.7 Indonesia
- 13.1.8 Phillipes
- 13.1.9 Singapore
- 13.1.10 Thailandc
- 13.1.11 Rest of Asia Pacific
- 14. South America Computational Photography Industry Analysis, Insights and Forecast, 2019-2031
- 14.1. Market Analysis, Insights and Forecast - By Country/Sub-region
- 14.1.1 Brazil
- 14.1.2 Argentina
- 14.1.3 Peru
- 14.1.4 Chile
- 14.1.5 Colombia
- 14.1.6 Ecuador
- 14.1.7 Venezuela
- 14.1.8 Rest of South America
- 15. MEA Computational Photography Industry Analysis, Insights and Forecast, 2019-2031
- 15.1. Market Analysis, Insights and Forecast - By Country/Sub-region
- 15.1.1 United Arab Emirates
- 15.1.2 Saudi Arabia
- 15.1.3 South Africa
- 15.1.4 Rest of Middle East and Africa
- 16. Competitive Analysis
- 16.1. Global Market Share Analysis 2024
- 16.2. Company Profiles
- 16.2.1 Algolux Inc
- 16.2.1.1. Overview
- 16.2.1.2. Products
- 16.2.1.3. SWOT Analysis
- 16.2.1.4. Recent Developments
- 16.2.1.5. Financials (Based on Availability)
- 16.2.2 CEVA Inc
- 16.2.2.1. Overview
- 16.2.2.2. Products
- 16.2.2.3. SWOT Analysis
- 16.2.2.4. Recent Developments
- 16.2.2.5. Financials (Based on Availability)
- 16.2.3 Pelican Imaging Corporation
- 16.2.3.1. Overview
- 16.2.3.2. Products
- 16.2.3.3. SWOT Analysis
- 16.2.3.4. Recent Developments
- 16.2.3.5. Financials (Based on Availability)
- 16.2.4 FotoNation Inc
- 16.2.4.1. Overview
- 16.2.4.2. Products
- 16.2.4.3. SWOT Analysis
- 16.2.4.4. Recent Developments
- 16.2.4.5. Financials (Based on Availability)
- 16.2.5 Alphabet Inc
- 16.2.5.1. Overview
- 16.2.5.2. Products
- 16.2.5.3. SWOT Analysis
- 16.2.5.4. Recent Developments
- 16.2.5.5. Financials (Based on Availability)
- 16.2.6 Light Labs Inc
- 16.2.6.1. Overview
- 16.2.6.2. Products
- 16.2.6.3. SWOT Analysis
- 16.2.6.4. Recent Developments
- 16.2.6.5. Financials (Based on Availability)
- 16.2.7 Qualcomm Technologies Inc
- 16.2.7.1. Overview
- 16.2.7.2. Products
- 16.2.7.3. SWOT Analysis
- 16.2.7.4. Recent Developments
- 16.2.7.5. Financials (Based on Availability)
- 16.2.8 Almalence Inc
- 16.2.8.1. Overview
- 16.2.8.2. Products
- 16.2.8.3. SWOT Analysis
- 16.2.8.4. Recent Developments
- 16.2.8.5. Financials (Based on Availability)
- 16.2.9 Nvidia Corporation
- 16.2.9.1. Overview
- 16.2.9.2. Products
- 16.2.9.3. SWOT Analysis
- 16.2.9.4. Recent Developments
- 16.2.9.5. Financials (Based on Availability)
- 16.2.10 Apple Inc
- 16.2.10.1. Overview
- 16.2.10.2. Products
- 16.2.10.3. SWOT Analysis
- 16.2.10.4. Recent Developments
- 16.2.10.5. Financials (Based on Availability)
- 16.2.1 Algolux Inc
List of Figures
- Figure 1: Global Computational Photography Industry Revenue Breakdown (Million, %) by Region 2024 & 2032
- Figure 2: North America Computational Photography Industry Revenue (Million), by Country 2024 & 2032
- Figure 3: North America Computational Photography Industry Revenue Share (%), by Country 2024 & 2032
- Figure 4: Europe Computational Photography Industry Revenue (Million), by Country 2024 & 2032
- Figure 5: Europe Computational Photography Industry Revenue Share (%), by Country 2024 & 2032
- Figure 6: Asia Pacific Computational Photography Industry Revenue (Million), by Country 2024 & 2032
- Figure 7: Asia Pacific Computational Photography Industry Revenue Share (%), by Country 2024 & 2032
- Figure 8: South America Computational Photography Industry Revenue (Million), by Country 2024 & 2032
- Figure 9: South America Computational Photography Industry Revenue Share (%), by Country 2024 & 2032
- Figure 10: MEA Computational Photography Industry Revenue (Million), by Country 2024 & 2032
- Figure 11: MEA Computational Photography Industry Revenue Share (%), by Country 2024 & 2032
- Figure 12: North America Computational Photography Industry Revenue (Million), by Offerings 2024 & 2032
- Figure 13: North America Computational Photography Industry Revenue Share (%), by Offerings 2024 & 2032
- Figure 14: North America Computational Photography Industry Revenue (Million), by Type 2024 & 2032
- Figure 15: North America Computational Photography Industry Revenue Share (%), by Type 2024 & 2032
- Figure 16: North America Computational Photography Industry Revenue (Million), by Application 2024 & 2032
- Figure 17: North America Computational Photography Industry Revenue Share (%), by Application 2024 & 2032
- Figure 18: North America Computational Photography Industry Revenue (Million), by Country 2024 & 2032
- Figure 19: North America Computational Photography Industry Revenue Share (%), by Country 2024 & 2032
- Figure 20: Europe Computational Photography Industry Revenue (Million), by Offerings 2024 & 2032
- Figure 21: Europe Computational Photography Industry Revenue Share (%), by Offerings 2024 & 2032
- Figure 22: Europe Computational Photography Industry Revenue (Million), by Type 2024 & 2032
- Figure 23: Europe Computational Photography Industry Revenue Share (%), by Type 2024 & 2032
- Figure 24: Europe Computational Photography Industry Revenue (Million), by Application 2024 & 2032
- Figure 25: Europe Computational Photography Industry Revenue Share (%), by Application 2024 & 2032
- Figure 26: Europe Computational Photography Industry Revenue (Million), by Country 2024 & 2032
- Figure 27: Europe Computational Photography Industry Revenue Share (%), by Country 2024 & 2032
- Figure 28: Asia Pacific Computational Photography Industry Revenue (Million), by Offerings 2024 & 2032
- Figure 29: Asia Pacific Computational Photography Industry Revenue Share (%), by Offerings 2024 & 2032
- Figure 30: Asia Pacific Computational Photography Industry Revenue (Million), by Type 2024 & 2032
- Figure 31: Asia Pacific Computational Photography Industry Revenue Share (%), by Type 2024 & 2032
- Figure 32: Asia Pacific Computational Photography Industry Revenue (Million), by Application 2024 & 2032
- Figure 33: Asia Pacific Computational Photography Industry Revenue Share (%), by Application 2024 & 2032
- Figure 34: Asia Pacific Computational Photography Industry Revenue (Million), by Country 2024 & 2032
- Figure 35: Asia Pacific Computational Photography Industry Revenue Share (%), by Country 2024 & 2032
- Figure 36: South America Computational Photography Industry Revenue (Million), by Offerings 2024 & 2032
- Figure 37: South America Computational Photography Industry Revenue Share (%), by Offerings 2024 & 2032
- Figure 38: South America Computational Photography Industry Revenue (Million), by Type 2024 & 2032
- Figure 39: South America Computational Photography Industry Revenue Share (%), by Type 2024 & 2032
- Figure 40: South America Computational Photography Industry Revenue (Million), by Application 2024 & 2032
- Figure 41: South America Computational Photography Industry Revenue Share (%), by Application 2024 & 2032
- Figure 42: South America Computational Photography Industry Revenue (Million), by Country 2024 & 2032
- Figure 43: South America Computational Photography Industry Revenue Share (%), by Country 2024 & 2032
- Figure 44: Rest of the World Computational Photography Industry Revenue (Million), by Offerings 2024 & 2032
- Figure 45: Rest of the World Computational Photography Industry Revenue Share (%), by Offerings 2024 & 2032
- Figure 46: Rest of the World Computational Photography Industry Revenue (Million), by Type 2024 & 2032
- Figure 47: Rest of the World Computational Photography Industry Revenue Share (%), by Type 2024 & 2032
- Figure 48: Rest of the World Computational Photography Industry Revenue (Million), by Application 2024 & 2032
- Figure 49: Rest of the World Computational Photography Industry Revenue Share (%), by Application 2024 & 2032
- Figure 50: Rest of the World Computational Photography Industry Revenue (Million), by Country 2024 & 2032
- Figure 51: Rest of the World Computational Photography Industry Revenue Share (%), by Country 2024 & 2032
List of Tables
- Table 1: Global Computational Photography Industry Revenue Million Forecast, by Region 2019 & 2032
- Table 2: Global Computational Photography Industry Revenue Million Forecast, by Offerings 2019 & 2032
- Table 3: Global Computational Photography Industry Revenue Million Forecast, by Type 2019 & 2032
- Table 4: Global Computational Photography Industry Revenue Million Forecast, by Application 2019 & 2032
- Table 5: Global Computational Photography Industry Revenue Million Forecast, by Region 2019 & 2032
- Table 6: Global Computational Photography Industry Revenue Million Forecast, by Country 2019 & 2032
- Table 7: United States Computational Photography Industry Revenue (Million) Forecast, by Application 2019 & 2032
- Table 8: Canada Computational Photography Industry Revenue (Million) Forecast, by Application 2019 & 2032
- Table 9: Mexico Computational Photography Industry Revenue (Million) Forecast, by Application 2019 & 2032
- Table 10: Global Computational Photography Industry Revenue Million Forecast, by Country 2019 & 2032
- Table 11: Germany Computational Photography Industry Revenue (Million) Forecast, by Application 2019 & 2032
- Table 12: United Kingdom Computational Photography Industry Revenue (Million) Forecast, by Application 2019 & 2032
- Table 13: France Computational Photography Industry Revenue (Million) Forecast, by Application 2019 & 2032
- Table 14: Spain Computational Photography Industry Revenue (Million) Forecast, by Application 2019 & 2032
- Table 15: Italy Computational Photography Industry Revenue (Million) Forecast, by Application 2019 & 2032
- Table 16: Spain Computational Photography Industry Revenue (Million) Forecast, by Application 2019 & 2032
- Table 17: Belgium Computational Photography Industry Revenue (Million) Forecast, by Application 2019 & 2032
- Table 18: Netherland Computational Photography Industry Revenue (Million) Forecast, by Application 2019 & 2032
- Table 19: Nordics Computational Photography Industry Revenue (Million) Forecast, by Application 2019 & 2032
- Table 20: Rest of Europe Computational Photography Industry Revenue (Million) Forecast, by Application 2019 & 2032
- Table 21: Global Computational Photography Industry Revenue Million Forecast, by Country 2019 & 2032
- Table 22: China Computational Photography Industry Revenue (Million) Forecast, by Application 2019 & 2032
- Table 23: Japan Computational Photography Industry Revenue (Million) Forecast, by Application 2019 & 2032
- Table 24: India Computational Photography Industry Revenue (Million) Forecast, by Application 2019 & 2032
- Table 25: South Korea Computational Photography Industry Revenue (Million) Forecast, by Application 2019 & 2032
- Table 26: Southeast Asia Computational Photography Industry Revenue (Million) Forecast, by Application 2019 & 2032
- Table 27: Australia Computational Photography Industry Revenue (Million) Forecast, by Application 2019 & 2032
- Table 28: Indonesia Computational Photography Industry Revenue (Million) Forecast, by Application 2019 & 2032
- Table 29: Phillipes Computational Photography Industry Revenue (Million) Forecast, by Application 2019 & 2032
- Table 30: Singapore Computational Photography Industry Revenue (Million) Forecast, by Application 2019 & 2032
- Table 31: Thailandc Computational Photography Industry Revenue (Million) Forecast, by Application 2019 & 2032
- Table 32: Rest of Asia Pacific Computational Photography Industry Revenue (Million) Forecast, by Application 2019 & 2032
- Table 33: Global Computational Photography Industry Revenue Million Forecast, by Country 2019 & 2032
- Table 34: Brazil Computational Photography Industry Revenue (Million) Forecast, by Application 2019 & 2032
- Table 35: Argentina Computational Photography Industry Revenue (Million) Forecast, by Application 2019 & 2032
- Table 36: Peru Computational Photography Industry Revenue (Million) Forecast, by Application 2019 & 2032
- Table 37: Chile Computational Photography Industry Revenue (Million) Forecast, by Application 2019 & 2032
- Table 38: Colombia Computational Photography Industry Revenue (Million) Forecast, by Application 2019 & 2032
- Table 39: Ecuador Computational Photography Industry Revenue (Million) Forecast, by Application 2019 & 2032
- Table 40: Venezuela Computational Photography Industry Revenue (Million) Forecast, by Application 2019 & 2032
- Table 41: Rest of South America Computational Photography Industry Revenue (Million) Forecast, by Application 2019 & 2032
- Table 42: Global Computational Photography Industry Revenue Million Forecast, by Country 2019 & 2032
- Table 43: United Arab Emirates Computational Photography Industry Revenue (Million) Forecast, by Application 2019 & 2032
- Table 44: Saudi Arabia Computational Photography Industry Revenue (Million) Forecast, by Application 2019 & 2032
- Table 45: South Africa Computational Photography Industry Revenue (Million) Forecast, by Application 2019 & 2032
- Table 46: Rest of Middle East and Africa Computational Photography Industry Revenue (Million) Forecast, by Application 2019 & 2032
- Table 47: Global Computational Photography Industry Revenue Million Forecast, by Offerings 2019 & 2032
- Table 48: Global Computational Photography Industry Revenue Million Forecast, by Type 2019 & 2032
- Table 49: Global Computational Photography Industry Revenue Million Forecast, by Application 2019 & 2032
- Table 50: Global Computational Photography Industry Revenue Million Forecast, by Country 2019 & 2032
- Table 51: Global Computational Photography Industry Revenue Million Forecast, by Offerings 2019 & 2032
- Table 52: Global Computational Photography Industry Revenue Million Forecast, by Type 2019 & 2032
- Table 53: Global Computational Photography Industry Revenue Million Forecast, by Application 2019 & 2032
- Table 54: Global Computational Photography Industry Revenue Million Forecast, by Country 2019 & 2032
- Table 55: Global Computational Photography Industry Revenue Million Forecast, by Offerings 2019 & 2032
- Table 56: Global Computational Photography Industry Revenue Million Forecast, by Type 2019 & 2032
- Table 57: Global Computational Photography Industry Revenue Million Forecast, by Application 2019 & 2032
- Table 58: Global Computational Photography Industry Revenue Million Forecast, by Country 2019 & 2032
- Table 59: Global Computational Photography Industry Revenue Million Forecast, by Offerings 2019 & 2032
- Table 60: Global Computational Photography Industry Revenue Million Forecast, by Type 2019 & 2032
- Table 61: Global Computational Photography Industry Revenue Million Forecast, by Application 2019 & 2032
- Table 62: Global Computational Photography Industry Revenue Million Forecast, by Country 2019 & 2032
- Table 63: Global Computational Photography Industry Revenue Million Forecast, by Offerings 2019 & 2032
- Table 64: Global Computational Photography Industry Revenue Million Forecast, by Type 2019 & 2032
- Table 65: Global Computational Photography Industry Revenue Million Forecast, by Application 2019 & 2032
- Table 66: Global Computational Photography Industry Revenue Million Forecast, by Country 2019 & 2032
Frequently Asked Questions
1. What is the projected Compound Annual Growth Rate (CAGR) of the Computational Photography Industry?
The projected CAGR is approximately 13.04%.
2. Which companies are prominent players in the Computational Photography Industry?
Key companies in the market include Algolux Inc, CEVA Inc, Pelican Imaging Corporation, FotoNation Inc, Alphabet Inc, Light Labs Inc, Qualcomm Technologies Inc, Almalence Inc, Nvidia Corporation, Apple Inc.
3. What are the main segments of the Computational Photography Industry?
The market segments include Offerings, Type, Application.
4. Can you provide details about the market size?
The market size is estimated to be USD 20.65 Million as of 2022.
5. What are some drivers contributing to market growth?
Growing Adoption of Image Fusion Technique to Achieve High-quality Image; Increasing Demand for High-resolution Computational Cameras in Machine Vision for Autonomous Vehicle.
6. What are the notable trends driving market growth?
Smartphone Cameras to Witness Significant Market Growth.
7. Are there any restraints impacting market growth?
High Manufacturing and Maintenance Costs.
8. Can you provide examples of recent developments in the market?
February 2023: Qualcomm Technologies has announced the 6th generation modem-to-antenna solution is the first ready to support 5G Advanced, the next phase of 5G. It introduces a new architecture and software suite and includes numerous world's first features to push the boundaries of connectivity, including coverage, latency, power efficiency, and mobility. Snapdragon X75 technologies and innovations empower OEMs to create next-generation experiences across segments, including smartphones, mobile broadband, automotive, compute, industrial IoT, fixed wireless access, and 5G private networks.
9. What pricing options are available for accessing the report?
Pricing options include single-user, multi-user, and enterprise licenses priced at USD 4750, USD 5250, and USD 8750 respectively.
10. Is the market size provided in terms of value or volume?
The market size is provided in terms of value, measured in Million.
11. Are there any specific market keywords associated with the report?
Yes, the market keyword associated with the report is "Computational Photography Industry," which aids in identifying and referencing the specific market segment covered.
12. How do I determine which pricing option suits my needs best?
The pricing options vary based on user requirements and access needs. Individual users may opt for single-user licenses, while businesses requiring broader access may choose multi-user or enterprise licenses for cost-effective access to the report.
13. Are there any additional resources or data provided in the Computational Photography Industry report?
While the report offers comprehensive insights, it's advisable to review the specific contents or supplementary materials provided to ascertain if additional resources or data are available.
14. How can I stay updated on further developments or reports in the Computational Photography Industry?
To stay informed about further developments, trends, and reports in the Computational Photography Industry, consider subscribing to industry newsletters, following relevant companies and organizations, or regularly checking reputable industry news sources and publications.
Methodology
Step 1 - Identification of Relevant Samples Size from Population Database


Step 2 - Approaches for Defining Global Market Size (Value, Volume* & Price*)

Note*: In applicable scenarios
Step 3 - Data Sources
Primary Research
- Web Analytics
- Survey Reports
- Research Institute
- Latest Research Reports
- Opinion Leaders
Secondary Research
- Annual Reports
- White Paper
- Latest Press Release
- Industry Association
- Paid Database
- Investor Presentations

Step 4 - Data Triangulation
Involves using different sources of information in order to increase the validity of a study
These sources are likely to be stakeholders in a program - participants, other researchers, program staff, other community members, and so on.
Then we put all data in single framework & apply various statistical tools to find out the dynamic on the market.
During the analysis stage, feedback from the stakeholder groups would be compared to determine areas of agreement as well as areas of divergence


