
Key Insights
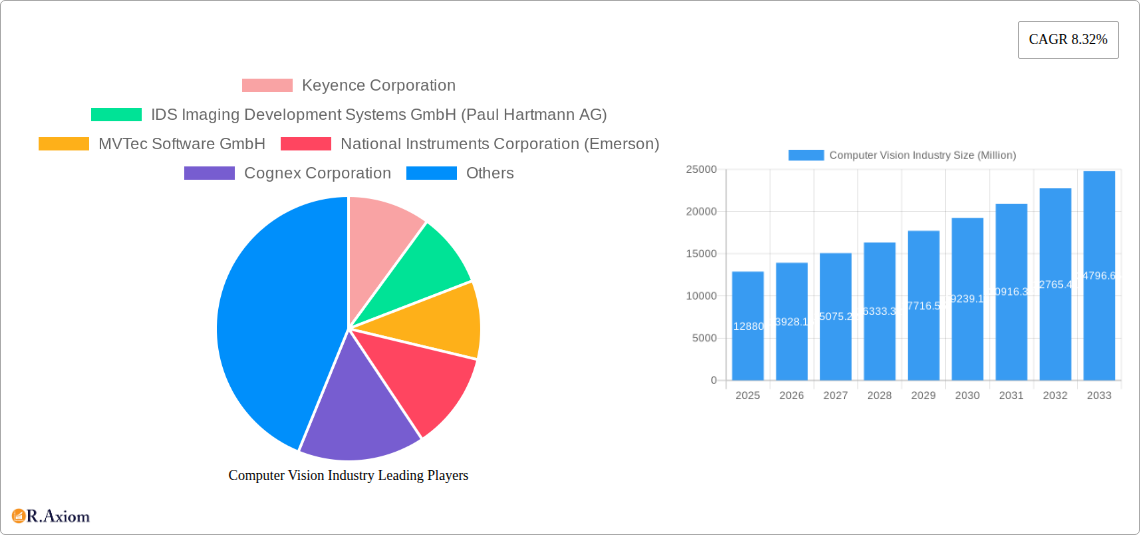
The computer vision market, valued at $12.88 billion in 2025, is projected to experience robust growth, driven by the increasing adoption of automation across diverse industries and advancements in artificial intelligence (AI) and machine learning (ML). This expansion is fueled by several key factors. Firstly, the burgeoning demand for efficient quality control and process optimization in manufacturing, particularly within the electronics and automotive sectors, is a significant driver. Secondly, the rise of smart cities and the associated need for advanced surveillance and traffic management systems is further bolstering market growth. Furthermore, the healthcare and pharmaceutical industries are increasingly leveraging computer vision for medical image analysis, drug discovery, and robotic surgery, significantly contributing to market expansion. Finally, the development of more powerful and cost-effective hardware, including advanced cameras and processing units, coupled with readily available software solutions, is making computer vision accessible to a broader range of applications and businesses.
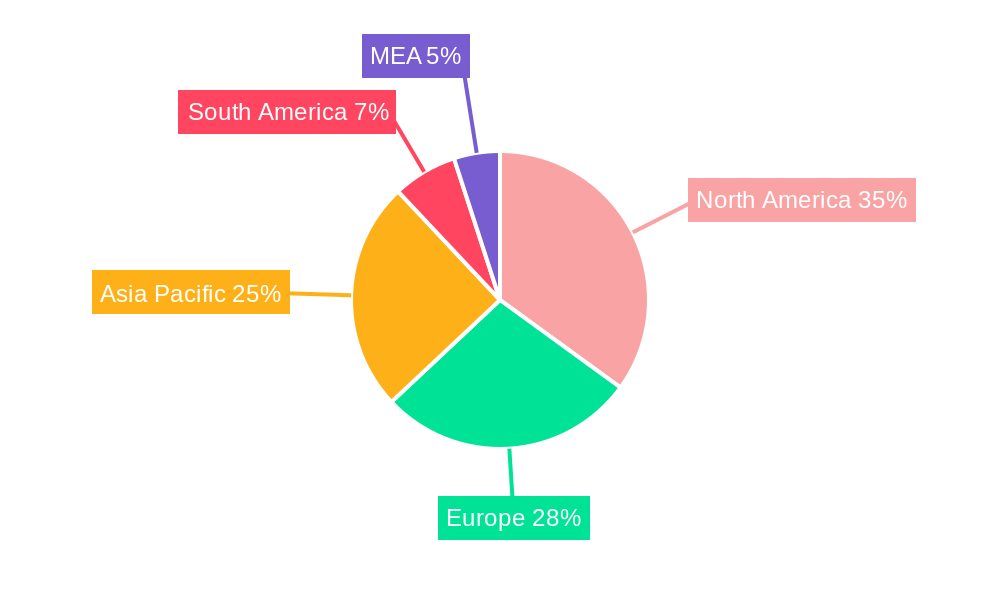
The market segmentation reveals a strong emphasis on software components, reflecting the growing importance of AI algorithms and sophisticated image processing techniques. Smart camera-based systems are gaining traction due to their ease of integration and reduced computational demands compared to PC-based systems. Geographically, North America and Asia-Pacific currently hold significant market share, with China and the United States representing key growth areas. However, Europe is also witnessing substantial growth, driven by advancements in AI research and development and the strong presence of key players within the region. The continued development of robust deep learning algorithms, coupled with the decreasing cost of high-resolution cameras and computing power, is expected to fuel even faster market growth in the coming years. Competitive forces among established players such as Keyence, Cognex, and MVTec, alongside the emergence of new entrants, indicate a dynamic and highly competitive landscape characterized by continuous innovation.
Computer Vision Industry Market Report: 2019-2033
This comprehensive report provides a detailed analysis of the Computer Vision industry, covering market size, segmentation, growth drivers, challenges, and key players. With a study period spanning 2019-2033, a base year of 2025, and a forecast period of 2025-2033, this report offers actionable insights for industry stakeholders, investors, and businesses seeking to navigate this rapidly evolving landscape. The report utilizes a robust methodology incorporating both historical data (2019-2024) and future projections, providing a complete picture of the market's trajectory. Expected market value in Millions is used for all values.
Computer Vision Industry Market Concentration & Innovation
The Computer Vision industry is characterized by a moderately concentrated market, with several major players holding significant market share. Keyence Corporation, Cognex Corporation, and Omron Corporation are among the leading companies, each possessing a substantial portion of the overall market. However, the industry also exhibits a vibrant competitive landscape, with numerous smaller companies specializing in niche applications and technologies contributing to innovation.
Market share distribution in 2025 is estimated as follows:
- Keyence Corporation: xx%
- Cognex Corporation: xx%
- Omron Corporation: xx%
- Others: xx%
Mergers and acquisitions (M&A) activity has played a significant role in shaping the industry landscape. Total M&A deal value for the period 2019-2024 is estimated at $xx Million. These deals have been driven by a combination of factors including the need to expand product portfolios, gain access to new technologies, and consolidate market share.
Innovation is a key driver of growth in the Computer Vision industry. Recent advancements in artificial intelligence (AI), deep learning, and sensor technologies have enabled the development of more sophisticated and powerful Computer Vision systems. Regulatory frameworks, particularly those related to data privacy and security, are increasingly influencing the adoption of Computer Vision technologies. The availability of substitutes, such as traditional manual inspection methods, remains a challenge, but the superior efficiency and accuracy of Computer Vision solutions are continually driving market penetration. End-user trends favor automation and improved efficiency, which strongly benefit Computer Vision applications.
Computer Vision Industry Industry Trends & Insights
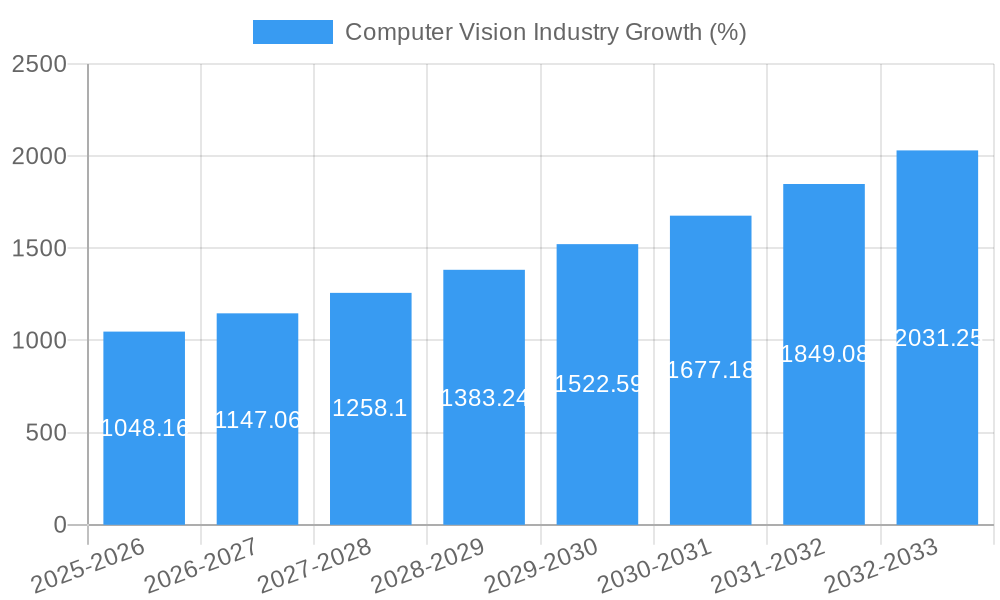
The Computer Vision industry is experiencing robust growth, driven by factors such as the increasing adoption of automation across various end-user industries, the proliferation of smart devices and the Internet of Things (IoT), and advancements in AI and machine learning algorithms. The market is projected to achieve a Compound Annual Growth Rate (CAGR) of xx% during the forecast period (2025-2033). Market penetration is currently at approximately xx%, with significant room for growth in several untapped markets and applications.
Technological disruptions, specifically in areas such as edge computing and 3D vision, are reshaping the competitive dynamics. Consumer preferences are shifting towards more accurate, efficient, and cost-effective Computer Vision solutions, particularly in applications requiring high levels of precision and automation. The industry landscape is characterized by intense competition among established players and emerging startups, pushing innovation and driving down costs. The impact of increased processing power and reduced costs of computing resources has resulted in the expanded usage of AI driven Computer Vision solutions across various industry verticals.
Dominant Markets & Segments in Computer Vision Industry
Leading Region/Country: North America currently holds the dominant position in the Computer Vision industry, owing to its robust technological infrastructure, early adoption of automation, and significant presence of key players.
By Component:
Hardware: The hardware segment, encompassing cameras, sensors, and processing units, constitutes a larger share of the overall market. This is primarily driven by the rising demand for high-performance imaging devices and advanced processing capabilities.
Software: The software segment, including image processing algorithms and analytics software, is also experiencing rapid growth, fueled by the increasing need for sophisticated software solutions to analyze and interpret image data.
By Product:
Smart Camera-based: Smart camera-based systems are gaining popularity due to their ease of integration, cost-effectiveness, and enhanced functionalities.
PC-based: PC-based systems are prevalent in applications requiring more processing power and flexibility.
By End-user Industry:
Automotive: The automotive industry is a major driver of growth due to the increasing adoption of advanced driver-assistance systems (ADAS) and autonomous driving technologies.
Electronics and Semiconductors: The electronics and semiconductor industries leverage Computer Vision for quality control, process optimization, and defect detection.
Healthcare and Pharmaceutical: This sector uses Computer Vision for medical imaging analysis, drug discovery, and robotic surgery.
Food and Beverage: Computer Vision aids in quality control, food sorting, and process automation.
Logistics and Retail: This is further propelled by demand for automated warehousing, inventory management, and security systems.
The dominance of specific segments is fueled by factors such as government policies promoting automation, technological advancements, and specific industry requirements. The automotive sector's strong demand for ADAS and autonomous vehicle technologies, for example, drives strong growth in the hardware segment and specific software applications.
Computer Vision Industry Product Developments
Recent product innovations include advancements in 3D vision, high-resolution cameras, and AI-powered image processing software. These innovations are enabling faster, more accurate, and more versatile Computer Vision solutions across various applications. Companies are focusing on developing compact, energy-efficient, and user-friendly systems to address the diverse needs of various end-user industries. This focus on ease of integration and cost-effectiveness is driving widespread adoption.
Report Scope & Segmentation Analysis
This report comprehensively analyzes the Computer Vision industry across various segments:
By Component: Hardware and Software, each further segmented by type (specific hardware types will be detailed in the full report). The hardware segment projects a xx Million market size by 2033, with a CAGR of xx%, while the software segment is projected at xx Million, with a CAGR of xx%. Competition is intense in both segments, with established and emerging players vying for market share.
By Product: PC-based and Smart Camera-based. Detailed market sizes and growth projections will be provided for each category in the full report.
By End-user Industry: Food and Beverage, Healthcare and Pharmaceutical, Logistics and Retail, Automotive, Electronics and Semiconductors, and Other End-user Industries. Each sector’s market size, growth rate, and competitive dynamics will be examined in detail.
Key Drivers of Computer Vision Industry Growth
Several key factors are driving the expansion of the Computer Vision industry:
- Technological advancements: AI, deep learning, and improved sensor technology are enhancing accuracy and efficiency.
- Increased automation: Industries are increasingly adopting automation to improve productivity and reduce costs.
- Rising demand for data analysis: The need to extract insights from large volumes of visual data fuels the growth of Computer Vision.
Challenges in the Computer Vision Industry Sector
The Computer Vision industry faces several challenges:
- High initial investment costs: Implementing Computer Vision systems can require significant upfront investment.
- Data privacy and security concerns: Protecting sensitive data is a critical concern for many applications.
- Complexity of integration: Integrating Computer Vision systems into existing workflows can be complex. This can lead to project delays and cost overruns, potentially hindering market penetration.
Emerging Opportunities in Computer Vision Industry
Emerging opportunities abound in the Computer Vision industry:
- Expansion into new applications: New applications are emerging in areas such as robotics, autonomous vehicles, and healthcare.
- Development of new technologies: Advancements in 3D vision, edge computing, and AI are opening up new possibilities.
- Growth in developing markets: Developing economies are increasingly adopting Computer Vision technologies.
Leading Players in the Computer Vision Industry Market
- Keyence Corporation
- IDS Imaging Development Systems GmbH (Paul Hartmann AG)
- MVTec Software GmbH
- National Instruments Corporation (Emerson)
- Cognex Corporation
- Teledyne DALSA (Teledyne Technologies Company)
- Isra Vision AG (Atlas Copco Group)
- Omron Corporation
- Toshiba Corporation
- Sony Group Corporation
Key Developments in Computer Vision Industry Industry
October 2023: Keyence Corporation launched its new VS series smart camera vision systems, featuring sophisticated lens control technology. This enhances versatility and ease of use, potentially expanding the market share for smart camera systems.
November 2023: Basler AG and MVTec Software GmbH partnered with Siemens to offer integrated machine vision solutions. This collaboration lowers the barrier to entry for customers, increasing market accessibility and adoption of machine vision.
Strategic Outlook for Computer Vision Industry Market
The Computer Vision industry is poised for sustained growth, driven by ongoing technological advancements, increasing automation across various sectors, and the rising demand for data-driven insights. New applications and emerging markets will continue to fuel market expansion, creating significant opportunities for both established players and new entrants. The strategic focus will be on developing innovative, user-friendly, and cost-effective solutions that address the diverse needs of various industries. This report provides the essential insights to capitalize on this promising future.
Computer Vision Industry Segmentation
-
1. Component
-
1.1. Hardware
- 1.1.1. Vision Systems
- 1.1.2. Cameras
- 1.1.3. Optics and Illumination Systems
- 1.1.4. Frame Grabbers
- 1.1.5. Other Types of Hardware
- 1.2. Software
-
1.1. Hardware
-
2. Product
- 2.1. PC-based
- 2.2. Smart Camera-based
-
3. End-user Industry
- 3.1. Food and Beverage
- 3.2. Healthcare and Pharmaceutical
- 3.3. Logistics and Retail
- 3.4. Automotive
- 3.5. Electronics and Semiconductors
- 3.6. Other End-user Industries
Computer Vision Industry Segmentation By Geography
-
1. North America
- 1.1. United States
- 1.2. Canada
-
2. Europe
- 2.1. Germany
- 2.2. United Kingdom
- 2.3. France
- 2.4. Italy
- 2.5. Spain
-
3. Asia
- 3.1. China
- 3.2. Japan
- 3.3. South Korea
- 3.4. India
- 4. Australia and New Zealand
Computer Vision Industry REPORT HIGHLIGHTS
| Aspects | Details |
|---|---|
| Study Period | 2019-2033 |
| Base Year | 2024 |
| Estimated Year | 2025 |
| Forecast Period | 2025-2033 |
| Historical Period | 2019-2024 |
| Growth Rate | CAGR of 8.32% from 2019-2033 |
| Segmentation |
|
Table of Contents
- 1. Introduction
- 1.1. Research Scope
- 1.2. Market Segmentation
- 1.3. Research Methodology
- 1.4. Definitions and Assumptions
- 2. Executive Summary
- 2.1. Introduction
- 3. Market Dynamics
- 3.1. Introduction
- 3.2. Market Drivers
- 3.2.1. Rising Need for Quality Inspections; Increasing Demand for Vision-guided Robotic Systems
- 3.3. Market Restrains
- 3.3.1. Scarcity of Flexible Machine Vision Solutions
- 3.4. Market Trends
- 3.4.1. Cameras to be the Largest Hardware Segment
- 4. Market Factor Analysis
- 4.1. Porters Five Forces
- 4.2. Supply/Value Chain
- 4.3. PESTEL analysis
- 4.4. Market Entropy
- 4.5. Patent/Trademark Analysis
- 5. Global Computer Vision Industry Analysis, Insights and Forecast, 2019-2031
- 5.1. Market Analysis, Insights and Forecast - by Component
- 5.1.1. Hardware
- 5.1.1.1. Vision Systems
- 5.1.1.2. Cameras
- 5.1.1.3. Optics and Illumination Systems
- 5.1.1.4. Frame Grabbers
- 5.1.1.5. Other Types of Hardware
- 5.1.2. Software
- 5.1.1. Hardware
- 5.2. Market Analysis, Insights and Forecast - by Product
- 5.2.1. PC-based
- 5.2.2. Smart Camera-based
- 5.3. Market Analysis, Insights and Forecast - by End-user Industry
- 5.3.1. Food and Beverage
- 5.3.2. Healthcare and Pharmaceutical
- 5.3.3. Logistics and Retail
- 5.3.4. Automotive
- 5.3.5. Electronics and Semiconductors
- 5.3.6. Other End-user Industries
- 5.4. Market Analysis, Insights and Forecast - by Region
- 5.4.1. North America
- 5.4.2. Europe
- 5.4.3. Asia
- 5.4.4. Australia and New Zealand
- 5.1. Market Analysis, Insights and Forecast - by Component
- 6. North America Computer Vision Industry Analysis, Insights and Forecast, 2019-2031
- 6.1. Market Analysis, Insights and Forecast - by Component
- 6.1.1. Hardware
- 6.1.1.1. Vision Systems
- 6.1.1.2. Cameras
- 6.1.1.3. Optics and Illumination Systems
- 6.1.1.4. Frame Grabbers
- 6.1.1.5. Other Types of Hardware
- 6.1.2. Software
- 6.1.1. Hardware
- 6.2. Market Analysis, Insights and Forecast - by Product
- 6.2.1. PC-based
- 6.2.2. Smart Camera-based
- 6.3. Market Analysis, Insights and Forecast - by End-user Industry
- 6.3.1. Food and Beverage
- 6.3.2. Healthcare and Pharmaceutical
- 6.3.3. Logistics and Retail
- 6.3.4. Automotive
- 6.3.5. Electronics and Semiconductors
- 6.3.6. Other End-user Industries
- 6.1. Market Analysis, Insights and Forecast - by Component
- 7. Europe Computer Vision Industry Analysis, Insights and Forecast, 2019-2031
- 7.1. Market Analysis, Insights and Forecast - by Component
- 7.1.1. Hardware
- 7.1.1.1. Vision Systems
- 7.1.1.2. Cameras
- 7.1.1.3. Optics and Illumination Systems
- 7.1.1.4. Frame Grabbers
- 7.1.1.5. Other Types of Hardware
- 7.1.2. Software
- 7.1.1. Hardware
- 7.2. Market Analysis, Insights and Forecast - by Product
- 7.2.1. PC-based
- 7.2.2. Smart Camera-based
- 7.3. Market Analysis, Insights and Forecast - by End-user Industry
- 7.3.1. Food and Beverage
- 7.3.2. Healthcare and Pharmaceutical
- 7.3.3. Logistics and Retail
- 7.3.4. Automotive
- 7.3.5. Electronics and Semiconductors
- 7.3.6. Other End-user Industries
- 7.1. Market Analysis, Insights and Forecast - by Component
- 8. Asia Computer Vision Industry Analysis, Insights and Forecast, 2019-2031
- 8.1. Market Analysis, Insights and Forecast - by Component
- 8.1.1. Hardware
- 8.1.1.1. Vision Systems
- 8.1.1.2. Cameras
- 8.1.1.3. Optics and Illumination Systems
- 8.1.1.4. Frame Grabbers
- 8.1.1.5. Other Types of Hardware
- 8.1.2. Software
- 8.1.1. Hardware
- 8.2. Market Analysis, Insights and Forecast - by Product
- 8.2.1. PC-based
- 8.2.2. Smart Camera-based
- 8.3. Market Analysis, Insights and Forecast - by End-user Industry
- 8.3.1. Food and Beverage
- 8.3.2. Healthcare and Pharmaceutical
- 8.3.3. Logistics and Retail
- 8.3.4. Automotive
- 8.3.5. Electronics and Semiconductors
- 8.3.6. Other End-user Industries
- 8.1. Market Analysis, Insights and Forecast - by Component
- 9. Australia and New Zealand Computer Vision Industry Analysis, Insights and Forecast, 2019-2031
- 9.1. Market Analysis, Insights and Forecast - by Component
- 9.1.1. Hardware
- 9.1.1.1. Vision Systems
- 9.1.1.2. Cameras
- 9.1.1.3. Optics and Illumination Systems
- 9.1.1.4. Frame Grabbers
- 9.1.1.5. Other Types of Hardware
- 9.1.2. Software
- 9.1.1. Hardware
- 9.2. Market Analysis, Insights and Forecast - by Product
- 9.2.1. PC-based
- 9.2.2. Smart Camera-based
- 9.3. Market Analysis, Insights and Forecast - by End-user Industry
- 9.3.1. Food and Beverage
- 9.3.2. Healthcare and Pharmaceutical
- 9.3.3. Logistics and Retail
- 9.3.4. Automotive
- 9.3.5. Electronics and Semiconductors
- 9.3.6. Other End-user Industries
- 9.1. Market Analysis, Insights and Forecast - by Component
- 10. North America Computer Vision Industry Analysis, Insights and Forecast, 2019-2031
- 10.1. Market Analysis, Insights and Forecast - By Country/Sub-region
- 10.1.1 United States
- 10.1.2 Canada
- 10.1.3 Mexico
- 11. Europe Computer Vision Industry Analysis, Insights and Forecast, 2019-2031
- 11.1. Market Analysis, Insights and Forecast - By Country/Sub-region
- 11.1.1 Germany
- 11.1.2 United Kingdom
- 11.1.3 France
- 11.1.4 Spain
- 11.1.5 Italy
- 11.1.6 Spain
- 11.1.7 Belgium
- 11.1.8 Netherland
- 11.1.9 Nordics
- 11.1.10 Rest of Europe
- 12. Asia Pacific Computer Vision Industry Analysis, Insights and Forecast, 2019-2031
- 12.1. Market Analysis, Insights and Forecast - By Country/Sub-region
- 12.1.1 China
- 12.1.2 Japan
- 12.1.3 India
- 12.1.4 South Korea
- 12.1.5 Southeast Asia
- 12.1.6 Australia
- 12.1.7 Indonesia
- 12.1.8 Phillipes
- 12.1.9 Singapore
- 12.1.10 Thailandc
- 12.1.11 Rest of Asia Pacific
- 13. South America Computer Vision Industry Analysis, Insights and Forecast, 2019-2031
- 13.1. Market Analysis, Insights and Forecast - By Country/Sub-region
- 13.1.1 Brazil
- 13.1.2 Argentina
- 13.1.3 Peru
- 13.1.4 Chile
- 13.1.5 Colombia
- 13.1.6 Ecuador
- 13.1.7 Venezuela
- 13.1.8 Rest of South America
- 14. North America Computer Vision Industry Analysis, Insights and Forecast, 2019-2031
- 14.1. Market Analysis, Insights and Forecast - By Country/Sub-region
- 14.1.1 United States
- 14.1.2 Canada
- 14.1.3 Mexico
- 15. MEA Computer Vision Industry Analysis, Insights and Forecast, 2019-2031
- 15.1. Market Analysis, Insights and Forecast - By Country/Sub-region
- 15.1.1 United Arab Emirates
- 15.1.2 Saudi Arabia
- 15.1.3 South Africa
- 15.1.4 Rest of Middle East and Africa
- 16. Competitive Analysis
- 16.1. Global Market Share Analysis 2024
- 16.2. Company Profiles
- 16.2.1 Keyence Corporation
- 16.2.1.1. Overview
- 16.2.1.2. Products
- 16.2.1.3. SWOT Analysis
- 16.2.1.4. Recent Developments
- 16.2.1.5. Financials (Based on Availability)
- 16.2.2 IDS Imaging Development Systems GmbH (Paul Hartmann AG)
- 16.2.2.1. Overview
- 16.2.2.2. Products
- 16.2.2.3. SWOT Analysis
- 16.2.2.4. Recent Developments
- 16.2.2.5. Financials (Based on Availability)
- 16.2.3 MVTec Software GmbH
- 16.2.3.1. Overview
- 16.2.3.2. Products
- 16.2.3.3. SWOT Analysis
- 16.2.3.4. Recent Developments
- 16.2.3.5. Financials (Based on Availability)
- 16.2.4 National Instruments Corporation (Emerson)
- 16.2.4.1. Overview
- 16.2.4.2. Products
- 16.2.4.3. SWOT Analysis
- 16.2.4.4. Recent Developments
- 16.2.4.5. Financials (Based on Availability)
- 16.2.5 Cognex Corporation
- 16.2.5.1. Overview
- 16.2.5.2. Products
- 16.2.5.3. SWOT Analysis
- 16.2.5.4. Recent Developments
- 16.2.5.5. Financials (Based on Availability)
- 16.2.6 Teledyne DALSA (Teledyne Technologies Company)
- 16.2.6.1. Overview
- 16.2.6.2. Products
- 16.2.6.3. SWOT Analysis
- 16.2.6.4. Recent Developments
- 16.2.6.5. Financials (Based on Availability)
- 16.2.7 Isra Vision AG (Atlas Copco Group)
- 16.2.7.1. Overview
- 16.2.7.2. Products
- 16.2.7.3. SWOT Analysis
- 16.2.7.4. Recent Developments
- 16.2.7.5. Financials (Based on Availability)
- 16.2.8 Omron Corporation
- 16.2.8.1. Overview
- 16.2.8.2. Products
- 16.2.8.3. SWOT Analysis
- 16.2.8.4. Recent Developments
- 16.2.8.5. Financials (Based on Availability)
- 16.2.9 Toshiba Corporation
- 16.2.9.1. Overview
- 16.2.9.2. Products
- 16.2.9.3. SWOT Analysis
- 16.2.9.4. Recent Developments
- 16.2.9.5. Financials (Based on Availability)
- 16.2.10 Sony Group Corporation
- 16.2.10.1. Overview
- 16.2.10.2. Products
- 16.2.10.3. SWOT Analysis
- 16.2.10.4. Recent Developments
- 16.2.10.5. Financials (Based on Availability)
- 16.2.1 Keyence Corporation
List of Figures
- Figure 1: Global Computer Vision Industry Revenue Breakdown (Million, %) by Region 2024 & 2032
- Figure 2: North America Computer Vision Industry Revenue (Million), by Country 2024 & 2032
- Figure 3: North America Computer Vision Industry Revenue Share (%), by Country 2024 & 2032
- Figure 4: Europe Computer Vision Industry Revenue (Million), by Country 2024 & 2032
- Figure 5: Europe Computer Vision Industry Revenue Share (%), by Country 2024 & 2032
- Figure 6: Asia Pacific Computer Vision Industry Revenue (Million), by Country 2024 & 2032
- Figure 7: Asia Pacific Computer Vision Industry Revenue Share (%), by Country 2024 & 2032
- Figure 8: South America Computer Vision Industry Revenue (Million), by Country 2024 & 2032
- Figure 9: South America Computer Vision Industry Revenue Share (%), by Country 2024 & 2032
- Figure 10: North America Computer Vision Industry Revenue (Million), by Country 2024 & 2032
- Figure 11: North America Computer Vision Industry Revenue Share (%), by Country 2024 & 2032
- Figure 12: MEA Computer Vision Industry Revenue (Million), by Country 2024 & 2032
- Figure 13: MEA Computer Vision Industry Revenue Share (%), by Country 2024 & 2032
- Figure 14: North America Computer Vision Industry Revenue (Million), by Component 2024 & 2032
- Figure 15: North America Computer Vision Industry Revenue Share (%), by Component 2024 & 2032
- Figure 16: North America Computer Vision Industry Revenue (Million), by Product 2024 & 2032
- Figure 17: North America Computer Vision Industry Revenue Share (%), by Product 2024 & 2032
- Figure 18: North America Computer Vision Industry Revenue (Million), by End-user Industry 2024 & 2032
- Figure 19: North America Computer Vision Industry Revenue Share (%), by End-user Industry 2024 & 2032
- Figure 20: North America Computer Vision Industry Revenue (Million), by Country 2024 & 2032
- Figure 21: North America Computer Vision Industry Revenue Share (%), by Country 2024 & 2032
- Figure 22: Europe Computer Vision Industry Revenue (Million), by Component 2024 & 2032
- Figure 23: Europe Computer Vision Industry Revenue Share (%), by Component 2024 & 2032
- Figure 24: Europe Computer Vision Industry Revenue (Million), by Product 2024 & 2032
- Figure 25: Europe Computer Vision Industry Revenue Share (%), by Product 2024 & 2032
- Figure 26: Europe Computer Vision Industry Revenue (Million), by End-user Industry 2024 & 2032
- Figure 27: Europe Computer Vision Industry Revenue Share (%), by End-user Industry 2024 & 2032
- Figure 28: Europe Computer Vision Industry Revenue (Million), by Country 2024 & 2032
- Figure 29: Europe Computer Vision Industry Revenue Share (%), by Country 2024 & 2032
- Figure 30: Asia Computer Vision Industry Revenue (Million), by Component 2024 & 2032
- Figure 31: Asia Computer Vision Industry Revenue Share (%), by Component 2024 & 2032
- Figure 32: Asia Computer Vision Industry Revenue (Million), by Product 2024 & 2032
- Figure 33: Asia Computer Vision Industry Revenue Share (%), by Product 2024 & 2032
- Figure 34: Asia Computer Vision Industry Revenue (Million), by End-user Industry 2024 & 2032
- Figure 35: Asia Computer Vision Industry Revenue Share (%), by End-user Industry 2024 & 2032
- Figure 36: Asia Computer Vision Industry Revenue (Million), by Country 2024 & 2032
- Figure 37: Asia Computer Vision Industry Revenue Share (%), by Country 2024 & 2032
- Figure 38: Australia and New Zealand Computer Vision Industry Revenue (Million), by Component 2024 & 2032
- Figure 39: Australia and New Zealand Computer Vision Industry Revenue Share (%), by Component 2024 & 2032
- Figure 40: Australia and New Zealand Computer Vision Industry Revenue (Million), by Product 2024 & 2032
- Figure 41: Australia and New Zealand Computer Vision Industry Revenue Share (%), by Product 2024 & 2032
- Figure 42: Australia and New Zealand Computer Vision Industry Revenue (Million), by End-user Industry 2024 & 2032
- Figure 43: Australia and New Zealand Computer Vision Industry Revenue Share (%), by End-user Industry 2024 & 2032
- Figure 44: Australia and New Zealand Computer Vision Industry Revenue (Million), by Country 2024 & 2032
- Figure 45: Australia and New Zealand Computer Vision Industry Revenue Share (%), by Country 2024 & 2032
List of Tables
- Table 1: Global Computer Vision Industry Revenue Million Forecast, by Region 2019 & 2032
- Table 2: Global Computer Vision Industry Revenue Million Forecast, by Component 2019 & 2032
- Table 3: Global Computer Vision Industry Revenue Million Forecast, by Product 2019 & 2032
- Table 4: Global Computer Vision Industry Revenue Million Forecast, by End-user Industry 2019 & 2032
- Table 5: Global Computer Vision Industry Revenue Million Forecast, by Region 2019 & 2032
- Table 6: Global Computer Vision Industry Revenue Million Forecast, by Country 2019 & 2032
- Table 7: United States Computer Vision Industry Revenue (Million) Forecast, by Application 2019 & 2032
- Table 8: Canada Computer Vision Industry Revenue (Million) Forecast, by Application 2019 & 2032
- Table 9: Mexico Computer Vision Industry Revenue (Million) Forecast, by Application 2019 & 2032
- Table 10: Global Computer Vision Industry Revenue Million Forecast, by Country 2019 & 2032
- Table 11: Germany Computer Vision Industry Revenue (Million) Forecast, by Application 2019 & 2032
- Table 12: United Kingdom Computer Vision Industry Revenue (Million) Forecast, by Application 2019 & 2032
- Table 13: France Computer Vision Industry Revenue (Million) Forecast, by Application 2019 & 2032
- Table 14: Spain Computer Vision Industry Revenue (Million) Forecast, by Application 2019 & 2032
- Table 15: Italy Computer Vision Industry Revenue (Million) Forecast, by Application 2019 & 2032
- Table 16: Spain Computer Vision Industry Revenue (Million) Forecast, by Application 2019 & 2032
- Table 17: Belgium Computer Vision Industry Revenue (Million) Forecast, by Application 2019 & 2032
- Table 18: Netherland Computer Vision Industry Revenue (Million) Forecast, by Application 2019 & 2032
- Table 19: Nordics Computer Vision Industry Revenue (Million) Forecast, by Application 2019 & 2032
- Table 20: Rest of Europe Computer Vision Industry Revenue (Million) Forecast, by Application 2019 & 2032
- Table 21: Global Computer Vision Industry Revenue Million Forecast, by Country 2019 & 2032
- Table 22: China Computer Vision Industry Revenue (Million) Forecast, by Application 2019 & 2032
- Table 23: Japan Computer Vision Industry Revenue (Million) Forecast, by Application 2019 & 2032
- Table 24: India Computer Vision Industry Revenue (Million) Forecast, by Application 2019 & 2032
- Table 25: South Korea Computer Vision Industry Revenue (Million) Forecast, by Application 2019 & 2032
- Table 26: Southeast Asia Computer Vision Industry Revenue (Million) Forecast, by Application 2019 & 2032
- Table 27: Australia Computer Vision Industry Revenue (Million) Forecast, by Application 2019 & 2032
- Table 28: Indonesia Computer Vision Industry Revenue (Million) Forecast, by Application 2019 & 2032
- Table 29: Phillipes Computer Vision Industry Revenue (Million) Forecast, by Application 2019 & 2032
- Table 30: Singapore Computer Vision Industry Revenue (Million) Forecast, by Application 2019 & 2032
- Table 31: Thailandc Computer Vision Industry Revenue (Million) Forecast, by Application 2019 & 2032
- Table 32: Rest of Asia Pacific Computer Vision Industry Revenue (Million) Forecast, by Application 2019 & 2032
- Table 33: Global Computer Vision Industry Revenue Million Forecast, by Country 2019 & 2032
- Table 34: Brazil Computer Vision Industry Revenue (Million) Forecast, by Application 2019 & 2032
- Table 35: Argentina Computer Vision Industry Revenue (Million) Forecast, by Application 2019 & 2032
- Table 36: Peru Computer Vision Industry Revenue (Million) Forecast, by Application 2019 & 2032
- Table 37: Chile Computer Vision Industry Revenue (Million) Forecast, by Application 2019 & 2032
- Table 38: Colombia Computer Vision Industry Revenue (Million) Forecast, by Application 2019 & 2032
- Table 39: Ecuador Computer Vision Industry Revenue (Million) Forecast, by Application 2019 & 2032
- Table 40: Venezuela Computer Vision Industry Revenue (Million) Forecast, by Application 2019 & 2032
- Table 41: Rest of South America Computer Vision Industry Revenue (Million) Forecast, by Application 2019 & 2032
- Table 42: Global Computer Vision Industry Revenue Million Forecast, by Country 2019 & 2032
- Table 43: United States Computer Vision Industry Revenue (Million) Forecast, by Application 2019 & 2032
- Table 44: Canada Computer Vision Industry Revenue (Million) Forecast, by Application 2019 & 2032
- Table 45: Mexico Computer Vision Industry Revenue (Million) Forecast, by Application 2019 & 2032
- Table 46: Global Computer Vision Industry Revenue Million Forecast, by Country 2019 & 2032
- Table 47: United Arab Emirates Computer Vision Industry Revenue (Million) Forecast, by Application 2019 & 2032
- Table 48: Saudi Arabia Computer Vision Industry Revenue (Million) Forecast, by Application 2019 & 2032
- Table 49: South Africa Computer Vision Industry Revenue (Million) Forecast, by Application 2019 & 2032
- Table 50: Rest of Middle East and Africa Computer Vision Industry Revenue (Million) Forecast, by Application 2019 & 2032
- Table 51: Global Computer Vision Industry Revenue Million Forecast, by Component 2019 & 2032
- Table 52: Global Computer Vision Industry Revenue Million Forecast, by Product 2019 & 2032
- Table 53: Global Computer Vision Industry Revenue Million Forecast, by End-user Industry 2019 & 2032
- Table 54: Global Computer Vision Industry Revenue Million Forecast, by Country 2019 & 2032
- Table 55: United States Computer Vision Industry Revenue (Million) Forecast, by Application 2019 & 2032
- Table 56: Canada Computer Vision Industry Revenue (Million) Forecast, by Application 2019 & 2032
- Table 57: Global Computer Vision Industry Revenue Million Forecast, by Component 2019 & 2032
- Table 58: Global Computer Vision Industry Revenue Million Forecast, by Product 2019 & 2032
- Table 59: Global Computer Vision Industry Revenue Million Forecast, by End-user Industry 2019 & 2032
- Table 60: Global Computer Vision Industry Revenue Million Forecast, by Country 2019 & 2032
- Table 61: Germany Computer Vision Industry Revenue (Million) Forecast, by Application 2019 & 2032
- Table 62: United Kingdom Computer Vision Industry Revenue (Million) Forecast, by Application 2019 & 2032
- Table 63: France Computer Vision Industry Revenue (Million) Forecast, by Application 2019 & 2032
- Table 64: Italy Computer Vision Industry Revenue (Million) Forecast, by Application 2019 & 2032
- Table 65: Spain Computer Vision Industry Revenue (Million) Forecast, by Application 2019 & 2032
- Table 66: Global Computer Vision Industry Revenue Million Forecast, by Component 2019 & 2032
- Table 67: Global Computer Vision Industry Revenue Million Forecast, by Product 2019 & 2032
- Table 68: Global Computer Vision Industry Revenue Million Forecast, by End-user Industry 2019 & 2032
- Table 69: Global Computer Vision Industry Revenue Million Forecast, by Country 2019 & 2032
- Table 70: China Computer Vision Industry Revenue (Million) Forecast, by Application 2019 & 2032
- Table 71: Japan Computer Vision Industry Revenue (Million) Forecast, by Application 2019 & 2032
- Table 72: South Korea Computer Vision Industry Revenue (Million) Forecast, by Application 2019 & 2032
- Table 73: India Computer Vision Industry Revenue (Million) Forecast, by Application 2019 & 2032
- Table 74: Global Computer Vision Industry Revenue Million Forecast, by Component 2019 & 2032
- Table 75: Global Computer Vision Industry Revenue Million Forecast, by Product 2019 & 2032
- Table 76: Global Computer Vision Industry Revenue Million Forecast, by End-user Industry 2019 & 2032
- Table 77: Global Computer Vision Industry Revenue Million Forecast, by Country 2019 & 2032
Frequently Asked Questions
1. What is the projected Compound Annual Growth Rate (CAGR) of the Computer Vision Industry?
The projected CAGR is approximately 8.32%.
2. Which companies are prominent players in the Computer Vision Industry?
Key companies in the market include Keyence Corporation, IDS Imaging Development Systems GmbH (Paul Hartmann AG), MVTec Software GmbH, National Instruments Corporation (Emerson), Cognex Corporation, Teledyne DALSA (Teledyne Technologies Company), Isra Vision AG (Atlas Copco Group), Omron Corporation, Toshiba Corporation, Sony Group Corporation.
3. What are the main segments of the Computer Vision Industry?
The market segments include Component, Product, End-user Industry.
4. Can you provide details about the market size?
The market size is estimated to be USD 12.88 Million as of 2022.
5. What are some drivers contributing to market growth?
Rising Need for Quality Inspections; Increasing Demand for Vision-guided Robotic Systems.
6. What are the notable trends driving market growth?
Cameras to be the Largest Hardware Segment.
7. Are there any restraints impacting market growth?
Scarcity of Flexible Machine Vision Solutions.
8. Can you provide examples of recent developments in the market?
November 2023: Basler AG and MVTec Software GmbH partnered with Siemens to bring machine vision solutions directly to customers’ machines and systems. The new partnerships between Basler AG and Siemens enable customers to integrate machine vision apps directly into their automation technology. Siemens’ experience with industrial automation and digitization, combined with MVTec’s expertise in machine vision, reduces the complexity for customers. It significantly reduces the barrier to entry for machine vision solutions.
9. What pricing options are available for accessing the report?
Pricing options include single-user, multi-user, and enterprise licenses priced at USD 4750, USD 5250, and USD 8750 respectively.
10. Is the market size provided in terms of value or volume?
The market size is provided in terms of value, measured in Million.
11. Are there any specific market keywords associated with the report?
Yes, the market keyword associated with the report is "Computer Vision Industry," which aids in identifying and referencing the specific market segment covered.
12. How do I determine which pricing option suits my needs best?
The pricing options vary based on user requirements and access needs. Individual users may opt for single-user licenses, while businesses requiring broader access may choose multi-user or enterprise licenses for cost-effective access to the report.
13. Are there any additional resources or data provided in the Computer Vision Industry report?
While the report offers comprehensive insights, it's advisable to review the specific contents or supplementary materials provided to ascertain if additional resources or data are available.
14. How can I stay updated on further developments or reports in the Computer Vision Industry?
To stay informed about further developments, trends, and reports in the Computer Vision Industry, consider subscribing to industry newsletters, following relevant companies and organizations, or regularly checking reputable industry news sources and publications.
Methodology
Step 1 - Identification of Relevant Samples Size from Population Database


Step 2 - Approaches for Defining Global Market Size (Value, Volume* & Price*)

Note*: In applicable scenarios
Step 3 - Data Sources
Primary Research
- Web Analytics
- Survey Reports
- Research Institute
- Latest Research Reports
- Opinion Leaders
Secondary Research
- Annual Reports
- White Paper
- Latest Press Release
- Industry Association
- Paid Database
- Investor Presentations

Step 4 - Data Triangulation
Involves using different sources of information in order to increase the validity of a study
These sources are likely to be stakeholders in a program - participants, other researchers, program staff, other community members, and so on.
Then we put all data in single framework & apply various statistical tools to find out the dynamic on the market.
During the analysis stage, feedback from the stakeholder groups would be compared to determine areas of agreement as well as areas of divergence


