
Key Insights
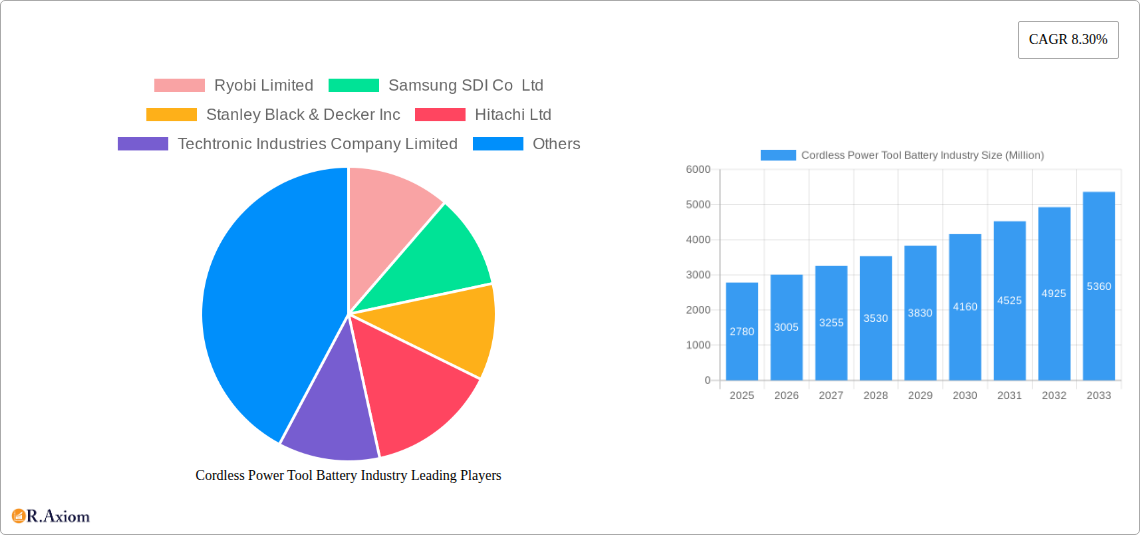
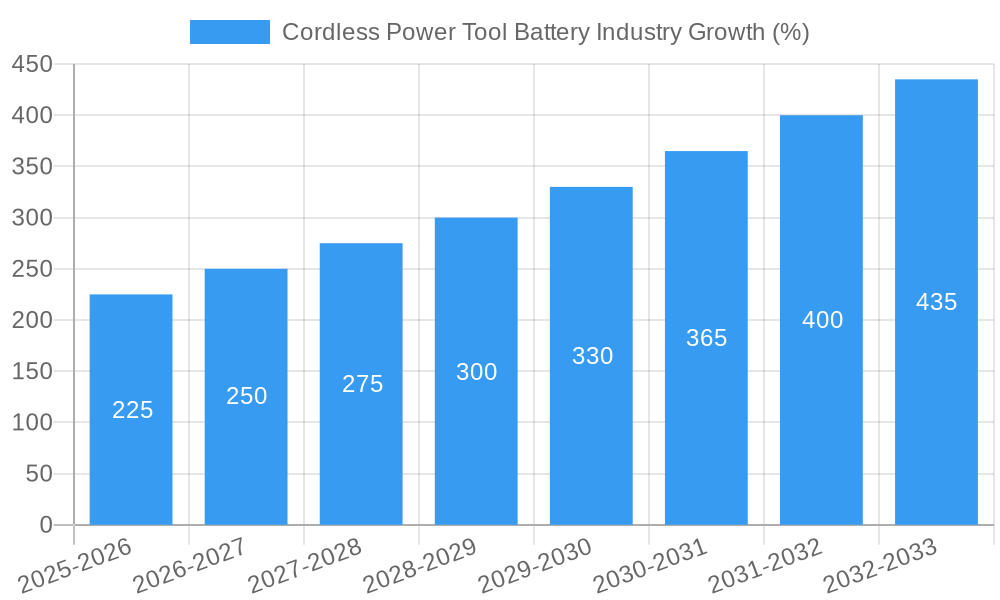
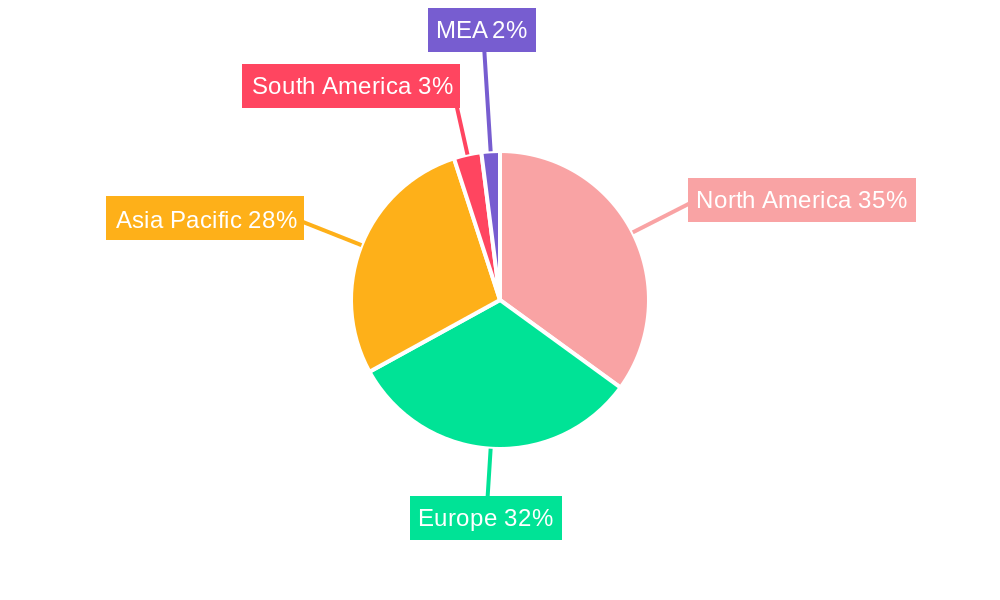
The cordless power tool battery market, valued at $2.78 billion in 2025, is experiencing robust growth, projected to expand at a compound annual growth rate (CAGR) of 8.30% from 2025 to 2033. This growth is fueled by several key factors. The increasing demand for lightweight and portable power tools across various industries, including construction, manufacturing, and DIY, is a primary driver. Furthermore, advancements in battery technology, particularly the development of higher-capacity and longer-lasting lithium-ion batteries, are significantly enhancing the performance and usability of cordless power tools. The shift towards eco-friendly and sustainable practices is also contributing to market expansion, as cordless tools offer reduced emissions compared to their corded counterparts. Regional variations exist, with North America and Europe currently holding significant market share due to established infrastructure and high adoption rates. However, the Asia-Pacific region is poised for substantial growth, driven by rapid industrialization and increasing disposable incomes. Competition is intense, with major players like Ryobi, Samsung SDI, Stanley Black & Decker, and Bosch vying for market dominance through innovation and strategic partnerships. While increasing raw material costs pose a challenge, the overall market outlook remains positive, driven by technological advancements and the growing preference for cordless power tools.
The market segmentation reveals a strong dominance of lithium-ion batteries, owing to their superior energy density and performance characteristics. While nickel-cadmium batteries still maintain a presence, their market share is gradually declining due to environmental concerns and technological limitations. The "other technology types" segment represents emerging technologies like nickel-metal hydride and others, which are expected to witness modest growth in the coming years. Geographical analysis shows a relatively even distribution of market share among North America, Europe, and Asia-Pacific in 2025, with North America slightly leading. However, the Asia-Pacific region is expected to experience the fastest growth, surpassing other regions in the coming years due to the rapid industrial expansion and rising demand in developing economies within the region. Continuous innovation in battery technology and the increasing adoption of cordless power tools across diverse applications will be key determinants of the market’s trajectory over the forecast period.
This comprehensive report provides an in-depth analysis of the global cordless power tool battery industry, offering valuable insights for stakeholders across the value chain. The study covers the period 2019-2033, with a focus on the forecast period 2025-2033, and utilizes 2025 as the base year. The report meticulously examines market dynamics, including technological advancements, competitive landscapes, and key growth drivers, offering actionable intelligence for strategic decision-making. The market size is projected to reach xx Million by 2033.
Cordless Power Tool Battery Industry Market Concentration & Innovation
This section analyzes the market concentration, innovation drivers, regulatory landscape, and competitive dynamics within the cordless power tool battery industry. The analysis incorporates market share data, merger & acquisition (M&A) activity, and emerging technological trends.
Market Concentration: The industry exhibits a moderately concentrated structure, with key players like Stanley Black & Decker Inc, Bosch Ltd, and Makita Corporation holding significant market share. However, the presence of numerous smaller players indicates a competitive landscape. Precise market share data is detailed within the full report, showing a xx% share for the top 6 players as of 2024.
Innovation Drivers: The industry is driven by continuous innovation in battery technology, particularly the development of higher-capacity, longer-lasting lithium-ion batteries. Other key drivers include advancements in power management systems and the integration of smart features in cordless power tools.
Regulatory Frameworks: Stringent environmental regulations, focusing on the responsible disposal of battery waste, are influencing the industry's practices. Compliance with these regulations is becoming a crucial aspect of business operations for major players.
Product Substitutes: While rechargeable batteries dominate, alternative power sources for cordless tools remain niche, offering limited substitution.
End-User Trends: The increasing demand for cordless power tools across various end-use segments (construction, DIY, industrial) fuels the growth of the battery market. Preferences shift towards longer operational times and faster charging capabilities.
M&A Activities: Significant M&A activity has been observed within the cordless power tool and battery sectors in recent years. While specific deal values are confidential, the full report details notable transactions, analyzing their impact on market consolidation and competitive dynamics. Examples include the integration of battery technologies acquired through mergers that significantly boost efficiency and lifespan.
Cordless Power Tool Battery Industry Industry Trends & Insights
This section explores the key industry trends, including market growth drivers, technological disruptions, evolving consumer preferences, and competitive dynamics within the cordless power tool battery sector.
The global cordless power tool battery market is experiencing robust growth, propelled by several factors. The rising demand for portable and convenient power tools in various sectors like construction, DIY, and industrial applications has significantly impacted the market growth. Technological advancements, such as the development of high-energy density lithium-ion batteries with increased lifespan and improved safety features, are another key driver. The increasing adoption of cordless tools across residential and commercial settings has also positively contributed to this growth. The market is witnessing a shift towards eco-friendly battery solutions, with manufacturers focusing on improving the recyclability and sustainability aspects of their products. This trend is driven by growing environmental concerns and stricter government regulations. The market is expected to witness a Compound Annual Growth Rate (CAGR) of xx% during the forecast period (2025-2033), reaching a market size of xx Million by 2033. Market penetration continues to grow across regions, particularly in developing economies where there’s increased infrastructure development and urbanization. However, price competition and the introduction of new players are creating a more dynamic competitive environment that is continuously reshaping the landscape.
Dominant Markets & Segments in Cordless Power Tool Battery Industry
This section identifies the leading regions, countries, and market segments within the cordless power tool battery industry. The analysis focuses on technology type, providing a detailed breakdown of the Lithium-ion, Nickel-cadmium, and Other Technology Types segments.
Leading Region/Country: North America and Europe currently hold significant market share due to high demand for cordless power tools and advanced technologies. However, Asia-Pacific is expected to witness the fastest growth over the forecast period driven by the increasing industrialization and construction activities.
Dominant Segment (Technology Type): Lithium-ion batteries clearly dominate the market due to their higher energy density, longer lifespan, and superior performance compared to Nickel-cadmium batteries. Other Technology Types represent a relatively small but dynamically growing market segment, with potential for innovations to emerge and gain traction.
Key Drivers for Market Dominance (Bullet Points):
- Lithium-ion: Higher energy density, longer lifespan, faster charging times, improved safety features. Increased R&D investment by major manufacturers. Lower environmental impact compared to older battery technologies.
- North America/Europe: Strong established markets for power tools, high disposable incomes, advanced infrastructure.
- Asia-Pacific: Rapid industrialization and construction growth; increasing adoption of cordless tools in both professional and consumer applications. Government initiatives and policies supporting the adoption of technologically advanced equipment.
Cordless Power Tool Battery Industry Product Developments
Recent years have witnessed significant innovations in cordless power tool batteries, leading to improved performance, longer lifespans, and enhanced safety features. The focus is on higher energy density lithium-ion batteries with advanced power management systems. This includes fast charging technology, improved thermal management, and more robust construction to withstand demanding work conditions. These advancements address key market demands for improved efficiency and longer operational times. The increasing integration of smart features, such as battery monitoring systems and connectivity capabilities, further enhances user experience and optimizes battery performance. This aligns with growing consumer preferences for intelligent tools.
Report Scope & Segmentation Analysis
This report segments the cordless power tool battery market based on technology type:
Lithium-ion: This segment holds the largest market share and is projected to experience significant growth due to its superior performance characteristics. Competitive dynamics are characterized by intense innovation and price competition among major battery manufacturers.
Nickel-cadmium: This segment is declining due to environmental concerns and the availability of better alternatives. However, it still holds a small niche market in certain applications.
Other Technology Types: This segment includes emerging technologies such as solid-state batteries and fuel cells which show promising performance but are still at earlier stages of development and commercialization.
Key Drivers of Cordless Power Tool Battery Growth
The cordless power tool battery market's growth is fueled by several key factors:
- Technological advancements: Continuous improvements in battery technology, leading to higher energy density, longer lifespan, and faster charging times.
- Increasing demand for cordless tools: Growing adoption across various sectors such as construction, DIY, and industrial applications.
- Favorable economic conditions: Sustained economic growth in several regions, boosting investment in infrastructure projects and driving demand for power tools.
- Stringent environmental regulations: Pushing manufacturers to develop more sustainable and eco-friendly battery solutions.
Challenges in the Cordless Power Tool Battery Industry Sector
The industry faces several challenges:
- Raw material price volatility: Fluctuations in the prices of key raw materials (e.g., lithium, cobalt) impact manufacturing costs and profitability.
- Supply chain disruptions: Global supply chain issues can lead to delays in production and affect the availability of components.
- Intense competition: The presence of numerous players, including both established brands and emerging companies, creates a highly competitive environment.
Emerging Opportunities in Cordless Power Tool Battery Industry
Several opportunities are emerging in the cordless power tool battery industry:
- Development of next-generation battery technologies: Solid-state batteries and other advanced technologies hold the potential to significantly enhance battery performance.
- Expansion into new markets: Growing demand in developing economies presents significant growth opportunities.
- Focus on sustainability: Meeting environmental regulations and developing eco-friendly battery solutions offers a competitive advantage.
Leading Players in the Cordless Power Tool Battery Industry Market
- Ryobi Limited
- Samsung SDI Co Ltd
- Stanley Black & Decker Inc
- Hitachi Ltd
- Techtronic Industries Company Limited
- Hilti Corporation
- Sony Group Corporation
- Bosch Ltd
- Panasonic Corporation
- Makita Corporation
Key Developments in Cordless Power Tool Battery Industry
- January 2023: Hilti North America announced the addition of more than 30 new cordless tools to its Nuron battery-powered tool portfolio.
- October 2022: Stanley Black & Decker's Black & Decker brand launched its new line of Reviva cordless power tools.
Strategic Outlook for Cordless Power Tool Battery Industry Market
The cordless power tool battery market is poised for continued growth, driven by technological advancements, increasing demand for cordless tools, and favorable economic conditions. Strategic investments in R&D, focus on sustainable practices, and expansion into new markets will be crucial for success in this dynamic industry. The industry's future lies in innovative battery technologies, addressing sustainability concerns, and meeting the demands of a growing global market.
Cordless Power Tool Battery Industry Segmentation
-
1. Technology Type
- 1.1. Lithium-ion
- 1.2. Nickel-cadmium
- 1.3. Other Technology Types
Cordless Power Tool Battery Industry Segmentation By Geography
-
1. North America
- 1.1. United States
- 1.2. Canada
- 1.3. Rest of North America
-
2. Europe
- 2.1. Germany
- 2.2. France
- 2.3. United Kingdom
- 2.4. Italy
- 2.5. Rest of Europe
-
3. Asia Pacific
- 3.1. China
- 3.2. India
- 3.3. Japan
- 3.4. Australia
- 3.5. Rest of Asia Pacific
-
4. South America
- 4.1. Brazil
- 4.2. Argentina
- 4.3. Chile
- 4.4. Rest of South America
-
5. Middle East and Africa
- 5.1. United Arab Emirates
- 5.2. Saudi Arabia
- 5.3. Qatar
- 5.4. South Africa
- 5.5. Egypt
- 5.6. Rest of Middle East and Africa
Cordless Power Tool Battery Industry REPORT HIGHLIGHTS
| Aspects | Details |
|---|---|
| Study Period | 2019-2033 |
| Base Year | 2024 |
| Estimated Year | 2025 |
| Forecast Period | 2025-2033 |
| Historical Period | 2019-2024 |
| Growth Rate | CAGR of 8.30% from 2019-2033 |
| Segmentation |
|
Table of Contents
- 1. Introduction
- 1.1. Research Scope
- 1.2. Market Segmentation
- 1.3. Research Methodology
- 1.4. Definitions and Assumptions
- 2. Executive Summary
- 2.1. Introduction
- 3. Market Dynamics
- 3.1. Introduction
- 3.2. Market Drivers
- 3.2.1. 4.; Increasing Adoption Of Battery-Powered Power Tools4.; Rapidly Growing Automotive Industry
- 3.3. Market Restrains
- 3.3.1. 4.; High Cost Associated With Cordless Power Tool Equipment
- 3.4. Market Trends
- 3.4.1. The Lithium-ion Type is Expected to Dominate the Market
- 4. Market Factor Analysis
- 4.1. Porters Five Forces
- 4.2. Supply/Value Chain
- 4.3. PESTEL analysis
- 4.4. Market Entropy
- 4.5. Patent/Trademark Analysis
- 5. Global Cordless Power Tool Battery Industry Analysis, Insights and Forecast, 2019-2031
- 5.1. Market Analysis, Insights and Forecast - by Technology Type
- 5.1.1. Lithium-ion
- 5.1.2. Nickel-cadmium
- 5.1.3. Other Technology Types
- 5.2. Market Analysis, Insights and Forecast - by Region
- 5.2.1. North America
- 5.2.2. Europe
- 5.2.3. Asia Pacific
- 5.2.4. South America
- 5.2.5. Middle East and Africa
- 5.1. Market Analysis, Insights and Forecast - by Technology Type
- 6. North America Cordless Power Tool Battery Industry Analysis, Insights and Forecast, 2019-2031
- 6.1. Market Analysis, Insights and Forecast - by Technology Type
- 6.1.1. Lithium-ion
- 6.1.2. Nickel-cadmium
- 6.1.3. Other Technology Types
- 6.1. Market Analysis, Insights and Forecast - by Technology Type
- 7. Europe Cordless Power Tool Battery Industry Analysis, Insights and Forecast, 2019-2031
- 7.1. Market Analysis, Insights and Forecast - by Technology Type
- 7.1.1. Lithium-ion
- 7.1.2. Nickel-cadmium
- 7.1.3. Other Technology Types
- 7.1. Market Analysis, Insights and Forecast - by Technology Type
- 8. Asia Pacific Cordless Power Tool Battery Industry Analysis, Insights and Forecast, 2019-2031
- 8.1. Market Analysis, Insights and Forecast - by Technology Type
- 8.1.1. Lithium-ion
- 8.1.2. Nickel-cadmium
- 8.1.3. Other Technology Types
- 8.1. Market Analysis, Insights and Forecast - by Technology Type
- 9. South America Cordless Power Tool Battery Industry Analysis, Insights and Forecast, 2019-2031
- 9.1. Market Analysis, Insights and Forecast - by Technology Type
- 9.1.1. Lithium-ion
- 9.1.2. Nickel-cadmium
- 9.1.3. Other Technology Types
- 9.1. Market Analysis, Insights and Forecast - by Technology Type
- 10. Middle East and Africa Cordless Power Tool Battery Industry Analysis, Insights and Forecast, 2019-2031
- 10.1. Market Analysis, Insights and Forecast - by Technology Type
- 10.1.1. Lithium-ion
- 10.1.2. Nickel-cadmium
- 10.1.3. Other Technology Types
- 10.1. Market Analysis, Insights and Forecast - by Technology Type
- 11. North America Cordless Power Tool Battery Industry Analysis, Insights and Forecast, 2019-2031
- 11.1. Market Analysis, Insights and Forecast - By Country/Sub-region
- 11.1.1 United States
- 11.1.2 Canada
- 11.1.3 Mexico
- 12. Europe Cordless Power Tool Battery Industry Analysis, Insights and Forecast, 2019-2031
- 12.1. Market Analysis, Insights and Forecast - By Country/Sub-region
- 12.1.1 Germany
- 12.1.2 United Kingdom
- 12.1.3 France
- 12.1.4 Spain
- 12.1.5 Italy
- 12.1.6 Spain
- 12.1.7 Belgium
- 12.1.8 Netherland
- 12.1.9 Nordics
- 12.1.10 Rest of Europe
- 13. Asia Pacific Cordless Power Tool Battery Industry Analysis, Insights and Forecast, 2019-2031
- 13.1. Market Analysis, Insights and Forecast - By Country/Sub-region
- 13.1.1 China
- 13.1.2 Japan
- 13.1.3 India
- 13.1.4 South Korea
- 13.1.5 Southeast Asia
- 13.1.6 Australia
- 13.1.7 Indonesia
- 13.1.8 Phillipes
- 13.1.9 Singapore
- 13.1.10 Thailandc
- 13.1.11 Rest of Asia Pacific
- 14. South America Cordless Power Tool Battery Industry Analysis, Insights and Forecast, 2019-2031
- 14.1. Market Analysis, Insights and Forecast - By Country/Sub-region
- 14.1.1 Brazil
- 14.1.2 Argentina
- 14.1.3 Peru
- 14.1.4 Chile
- 14.1.5 Colombia
- 14.1.6 Ecuador
- 14.1.7 Venezuela
- 14.1.8 Rest of South America
- 15. North America Cordless Power Tool Battery Industry Analysis, Insights and Forecast, 2019-2031
- 15.1. Market Analysis, Insights and Forecast - By Country/Sub-region
- 15.1.1 United States
- 15.1.2 Canada
- 15.1.3 Mexico
- 16. MEA Cordless Power Tool Battery Industry Analysis, Insights and Forecast, 2019-2031
- 16.1. Market Analysis, Insights and Forecast - By Country/Sub-region
- 16.1.1 United Arab Emirates
- 16.1.2 Saudi Arabia
- 16.1.3 South Africa
- 16.1.4 Rest of Middle East and Africa
- 17. Competitive Analysis
- 17.1. Global Market Share Analysis 2024
- 17.2. Company Profiles
- 17.2.1 Ryobi Limited
- 17.2.1.1. Overview
- 17.2.1.2. Products
- 17.2.1.3. SWOT Analysis
- 17.2.1.4. Recent Developments
- 17.2.1.5. Financials (Based on Availability)
- 17.2.2 Samsung SDI Co Ltd
- 17.2.2.1. Overview
- 17.2.2.2. Products
- 17.2.2.3. SWOT Analysis
- 17.2.2.4. Recent Developments
- 17.2.2.5. Financials (Based on Availability)
- 17.2.3 Stanley Black & Decker Inc
- 17.2.3.1. Overview
- 17.2.3.2. Products
- 17.2.3.3. SWOT Analysis
- 17.2.3.4. Recent Developments
- 17.2.3.5. Financials (Based on Availability)
- 17.2.4 Hitachi Ltd
- 17.2.4.1. Overview
- 17.2.4.2. Products
- 17.2.4.3. SWOT Analysis
- 17.2.4.4. Recent Developments
- 17.2.4.5. Financials (Based on Availability)
- 17.2.5 Techtronic Industries Company Limited
- 17.2.5.1. Overview
- 17.2.5.2. Products
- 17.2.5.3. SWOT Analysis
- 17.2.5.4. Recent Developments
- 17.2.5.5. Financials (Based on Availability)
- 17.2.6 Hilti Corporation*List Not Exhaustive 6 4 Market Ranking/Share (%) Analysi
- 17.2.6.1. Overview
- 17.2.6.2. Products
- 17.2.6.3. SWOT Analysis
- 17.2.6.4. Recent Developments
- 17.2.6.5. Financials (Based on Availability)
- 17.2.7 Sony Group Corporation
- 17.2.7.1. Overview
- 17.2.7.2. Products
- 17.2.7.3. SWOT Analysis
- 17.2.7.4. Recent Developments
- 17.2.7.5. Financials (Based on Availability)
- 17.2.8 Bosch Ltd
- 17.2.8.1. Overview
- 17.2.8.2. Products
- 17.2.8.3. SWOT Analysis
- 17.2.8.4. Recent Developments
- 17.2.8.5. Financials (Based on Availability)
- 17.2.9 Panasonic Corporation
- 17.2.9.1. Overview
- 17.2.9.2. Products
- 17.2.9.3. SWOT Analysis
- 17.2.9.4. Recent Developments
- 17.2.9.5. Financials (Based on Availability)
- 17.2.10 Makita Corporation
- 17.2.10.1. Overview
- 17.2.10.2. Products
- 17.2.10.3. SWOT Analysis
- 17.2.10.4. Recent Developments
- 17.2.10.5. Financials (Based on Availability)
- 17.2.1 Ryobi Limited
List of Figures
- Figure 1: Global Cordless Power Tool Battery Industry Revenue Breakdown (Million, %) by Region 2024 & 2032
- Figure 2: Global Cordless Power Tool Battery Industry Volume Breakdown (K Unit, %) by Region 2024 & 2032
- Figure 3: North America Cordless Power Tool Battery Industry Revenue (Million), by Country 2024 & 2032
- Figure 4: North America Cordless Power Tool Battery Industry Volume (K Unit), by Country 2024 & 2032
- Figure 5: North America Cordless Power Tool Battery Industry Revenue Share (%), by Country 2024 & 2032
- Figure 6: North America Cordless Power Tool Battery Industry Volume Share (%), by Country 2024 & 2032
- Figure 7: Europe Cordless Power Tool Battery Industry Revenue (Million), by Country 2024 & 2032
- Figure 8: Europe Cordless Power Tool Battery Industry Volume (K Unit), by Country 2024 & 2032
- Figure 9: Europe Cordless Power Tool Battery Industry Revenue Share (%), by Country 2024 & 2032
- Figure 10: Europe Cordless Power Tool Battery Industry Volume Share (%), by Country 2024 & 2032
- Figure 11: Asia Pacific Cordless Power Tool Battery Industry Revenue (Million), by Country 2024 & 2032
- Figure 12: Asia Pacific Cordless Power Tool Battery Industry Volume (K Unit), by Country 2024 & 2032
- Figure 13: Asia Pacific Cordless Power Tool Battery Industry Revenue Share (%), by Country 2024 & 2032
- Figure 14: Asia Pacific Cordless Power Tool Battery Industry Volume Share (%), by Country 2024 & 2032
- Figure 15: South America Cordless Power Tool Battery Industry Revenue (Million), by Country 2024 & 2032
- Figure 16: South America Cordless Power Tool Battery Industry Volume (K Unit), by Country 2024 & 2032
- Figure 17: South America Cordless Power Tool Battery Industry Revenue Share (%), by Country 2024 & 2032
- Figure 18: South America Cordless Power Tool Battery Industry Volume Share (%), by Country 2024 & 2032
- Figure 19: North America Cordless Power Tool Battery Industry Revenue (Million), by Country 2024 & 2032
- Figure 20: North America Cordless Power Tool Battery Industry Volume (K Unit), by Country 2024 & 2032
- Figure 21: North America Cordless Power Tool Battery Industry Revenue Share (%), by Country 2024 & 2032
- Figure 22: North America Cordless Power Tool Battery Industry Volume Share (%), by Country 2024 & 2032
- Figure 23: MEA Cordless Power Tool Battery Industry Revenue (Million), by Country 2024 & 2032
- Figure 24: MEA Cordless Power Tool Battery Industry Volume (K Unit), by Country 2024 & 2032
- Figure 25: MEA Cordless Power Tool Battery Industry Revenue Share (%), by Country 2024 & 2032
- Figure 26: MEA Cordless Power Tool Battery Industry Volume Share (%), by Country 2024 & 2032
- Figure 27: North America Cordless Power Tool Battery Industry Revenue (Million), by Technology Type 2024 & 2032
- Figure 28: North America Cordless Power Tool Battery Industry Volume (K Unit), by Technology Type 2024 & 2032
- Figure 29: North America Cordless Power Tool Battery Industry Revenue Share (%), by Technology Type 2024 & 2032
- Figure 30: North America Cordless Power Tool Battery Industry Volume Share (%), by Technology Type 2024 & 2032
- Figure 31: North America Cordless Power Tool Battery Industry Revenue (Million), by Country 2024 & 2032
- Figure 32: North America Cordless Power Tool Battery Industry Volume (K Unit), by Country 2024 & 2032
- Figure 33: North America Cordless Power Tool Battery Industry Revenue Share (%), by Country 2024 & 2032
- Figure 34: North America Cordless Power Tool Battery Industry Volume Share (%), by Country 2024 & 2032
- Figure 35: Europe Cordless Power Tool Battery Industry Revenue (Million), by Technology Type 2024 & 2032
- Figure 36: Europe Cordless Power Tool Battery Industry Volume (K Unit), by Technology Type 2024 & 2032
- Figure 37: Europe Cordless Power Tool Battery Industry Revenue Share (%), by Technology Type 2024 & 2032
- Figure 38: Europe Cordless Power Tool Battery Industry Volume Share (%), by Technology Type 2024 & 2032
- Figure 39: Europe Cordless Power Tool Battery Industry Revenue (Million), by Country 2024 & 2032
- Figure 40: Europe Cordless Power Tool Battery Industry Volume (K Unit), by Country 2024 & 2032
- Figure 41: Europe Cordless Power Tool Battery Industry Revenue Share (%), by Country 2024 & 2032
- Figure 42: Europe Cordless Power Tool Battery Industry Volume Share (%), by Country 2024 & 2032
- Figure 43: Asia Pacific Cordless Power Tool Battery Industry Revenue (Million), by Technology Type 2024 & 2032
- Figure 44: Asia Pacific Cordless Power Tool Battery Industry Volume (K Unit), by Technology Type 2024 & 2032
- Figure 45: Asia Pacific Cordless Power Tool Battery Industry Revenue Share (%), by Technology Type 2024 & 2032
- Figure 46: Asia Pacific Cordless Power Tool Battery Industry Volume Share (%), by Technology Type 2024 & 2032
- Figure 47: Asia Pacific Cordless Power Tool Battery Industry Revenue (Million), by Country 2024 & 2032
- Figure 48: Asia Pacific Cordless Power Tool Battery Industry Volume (K Unit), by Country 2024 & 2032
- Figure 49: Asia Pacific Cordless Power Tool Battery Industry Revenue Share (%), by Country 2024 & 2032
- Figure 50: Asia Pacific Cordless Power Tool Battery Industry Volume Share (%), by Country 2024 & 2032
- Figure 51: South America Cordless Power Tool Battery Industry Revenue (Million), by Technology Type 2024 & 2032
- Figure 52: South America Cordless Power Tool Battery Industry Volume (K Unit), by Technology Type 2024 & 2032
- Figure 53: South America Cordless Power Tool Battery Industry Revenue Share (%), by Technology Type 2024 & 2032
- Figure 54: South America Cordless Power Tool Battery Industry Volume Share (%), by Technology Type 2024 & 2032
- Figure 55: South America Cordless Power Tool Battery Industry Revenue (Million), by Country 2024 & 2032
- Figure 56: South America Cordless Power Tool Battery Industry Volume (K Unit), by Country 2024 & 2032
- Figure 57: South America Cordless Power Tool Battery Industry Revenue Share (%), by Country 2024 & 2032
- Figure 58: South America Cordless Power Tool Battery Industry Volume Share (%), by Country 2024 & 2032
- Figure 59: Middle East and Africa Cordless Power Tool Battery Industry Revenue (Million), by Technology Type 2024 & 2032
- Figure 60: Middle East and Africa Cordless Power Tool Battery Industry Volume (K Unit), by Technology Type 2024 & 2032
- Figure 61: Middle East and Africa Cordless Power Tool Battery Industry Revenue Share (%), by Technology Type 2024 & 2032
- Figure 62: Middle East and Africa Cordless Power Tool Battery Industry Volume Share (%), by Technology Type 2024 & 2032
- Figure 63: Middle East and Africa Cordless Power Tool Battery Industry Revenue (Million), by Country 2024 & 2032
- Figure 64: Middle East and Africa Cordless Power Tool Battery Industry Volume (K Unit), by Country 2024 & 2032
- Figure 65: Middle East and Africa Cordless Power Tool Battery Industry Revenue Share (%), by Country 2024 & 2032
- Figure 66: Middle East and Africa Cordless Power Tool Battery Industry Volume Share (%), by Country 2024 & 2032
List of Tables
- Table 1: Global Cordless Power Tool Battery Industry Revenue Million Forecast, by Region 2019 & 2032
- Table 2: Global Cordless Power Tool Battery Industry Volume K Unit Forecast, by Region 2019 & 2032
- Table 3: Global Cordless Power Tool Battery Industry Revenue Million Forecast, by Technology Type 2019 & 2032
- Table 4: Global Cordless Power Tool Battery Industry Volume K Unit Forecast, by Technology Type 2019 & 2032
- Table 5: Global Cordless Power Tool Battery Industry Revenue Million Forecast, by Region 2019 & 2032
- Table 6: Global Cordless Power Tool Battery Industry Volume K Unit Forecast, by Region 2019 & 2032
- Table 7: Global Cordless Power Tool Battery Industry Revenue Million Forecast, by Country 2019 & 2032
- Table 8: Global Cordless Power Tool Battery Industry Volume K Unit Forecast, by Country 2019 & 2032
- Table 9: United States Cordless Power Tool Battery Industry Revenue (Million) Forecast, by Application 2019 & 2032
- Table 10: United States Cordless Power Tool Battery Industry Volume (K Unit) Forecast, by Application 2019 & 2032
- Table 11: Canada Cordless Power Tool Battery Industry Revenue (Million) Forecast, by Application 2019 & 2032
- Table 12: Canada Cordless Power Tool Battery Industry Volume (K Unit) Forecast, by Application 2019 & 2032
- Table 13: Mexico Cordless Power Tool Battery Industry Revenue (Million) Forecast, by Application 2019 & 2032
- Table 14: Mexico Cordless Power Tool Battery Industry Volume (K Unit) Forecast, by Application 2019 & 2032
- Table 15: Global Cordless Power Tool Battery Industry Revenue Million Forecast, by Country 2019 & 2032
- Table 16: Global Cordless Power Tool Battery Industry Volume K Unit Forecast, by Country 2019 & 2032
- Table 17: Germany Cordless Power Tool Battery Industry Revenue (Million) Forecast, by Application 2019 & 2032
- Table 18: Germany Cordless Power Tool Battery Industry Volume (K Unit) Forecast, by Application 2019 & 2032
- Table 19: United Kingdom Cordless Power Tool Battery Industry Revenue (Million) Forecast, by Application 2019 & 2032
- Table 20: United Kingdom Cordless Power Tool Battery Industry Volume (K Unit) Forecast, by Application 2019 & 2032
- Table 21: France Cordless Power Tool Battery Industry Revenue (Million) Forecast, by Application 2019 & 2032
- Table 22: France Cordless Power Tool Battery Industry Volume (K Unit) Forecast, by Application 2019 & 2032
- Table 23: Spain Cordless Power Tool Battery Industry Revenue (Million) Forecast, by Application 2019 & 2032
- Table 24: Spain Cordless Power Tool Battery Industry Volume (K Unit) Forecast, by Application 2019 & 2032
- Table 25: Italy Cordless Power Tool Battery Industry Revenue (Million) Forecast, by Application 2019 & 2032
- Table 26: Italy Cordless Power Tool Battery Industry Volume (K Unit) Forecast, by Application 2019 & 2032
- Table 27: Spain Cordless Power Tool Battery Industry Revenue (Million) Forecast, by Application 2019 & 2032
- Table 28: Spain Cordless Power Tool Battery Industry Volume (K Unit) Forecast, by Application 2019 & 2032
- Table 29: Belgium Cordless Power Tool Battery Industry Revenue (Million) Forecast, by Application 2019 & 2032
- Table 30: Belgium Cordless Power Tool Battery Industry Volume (K Unit) Forecast, by Application 2019 & 2032
- Table 31: Netherland Cordless Power Tool Battery Industry Revenue (Million) Forecast, by Application 2019 & 2032
- Table 32: Netherland Cordless Power Tool Battery Industry Volume (K Unit) Forecast, by Application 2019 & 2032
- Table 33: Nordics Cordless Power Tool Battery Industry Revenue (Million) Forecast, by Application 2019 & 2032
- Table 34: Nordics Cordless Power Tool Battery Industry Volume (K Unit) Forecast, by Application 2019 & 2032
- Table 35: Rest of Europe Cordless Power Tool Battery Industry Revenue (Million) Forecast, by Application 2019 & 2032
- Table 36: Rest of Europe Cordless Power Tool Battery Industry Volume (K Unit) Forecast, by Application 2019 & 2032
- Table 37: Global Cordless Power Tool Battery Industry Revenue Million Forecast, by Country 2019 & 2032
- Table 38: Global Cordless Power Tool Battery Industry Volume K Unit Forecast, by Country 2019 & 2032
- Table 39: China Cordless Power Tool Battery Industry Revenue (Million) Forecast, by Application 2019 & 2032
- Table 40: China Cordless Power Tool Battery Industry Volume (K Unit) Forecast, by Application 2019 & 2032
- Table 41: Japan Cordless Power Tool Battery Industry Revenue (Million) Forecast, by Application 2019 & 2032
- Table 42: Japan Cordless Power Tool Battery Industry Volume (K Unit) Forecast, by Application 2019 & 2032
- Table 43: India Cordless Power Tool Battery Industry Revenue (Million) Forecast, by Application 2019 & 2032
- Table 44: India Cordless Power Tool Battery Industry Volume (K Unit) Forecast, by Application 2019 & 2032
- Table 45: South Korea Cordless Power Tool Battery Industry Revenue (Million) Forecast, by Application 2019 & 2032
- Table 46: South Korea Cordless Power Tool Battery Industry Volume (K Unit) Forecast, by Application 2019 & 2032
- Table 47: Southeast Asia Cordless Power Tool Battery Industry Revenue (Million) Forecast, by Application 2019 & 2032
- Table 48: Southeast Asia Cordless Power Tool Battery Industry Volume (K Unit) Forecast, by Application 2019 & 2032
- Table 49: Australia Cordless Power Tool Battery Industry Revenue (Million) Forecast, by Application 2019 & 2032
- Table 50: Australia Cordless Power Tool Battery Industry Volume (K Unit) Forecast, by Application 2019 & 2032
- Table 51: Indonesia Cordless Power Tool Battery Industry Revenue (Million) Forecast, by Application 2019 & 2032
- Table 52: Indonesia Cordless Power Tool Battery Industry Volume (K Unit) Forecast, by Application 2019 & 2032
- Table 53: Phillipes Cordless Power Tool Battery Industry Revenue (Million) Forecast, by Application 2019 & 2032
- Table 54: Phillipes Cordless Power Tool Battery Industry Volume (K Unit) Forecast, by Application 2019 & 2032
- Table 55: Singapore Cordless Power Tool Battery Industry Revenue (Million) Forecast, by Application 2019 & 2032
- Table 56: Singapore Cordless Power Tool Battery Industry Volume (K Unit) Forecast, by Application 2019 & 2032
- Table 57: Thailandc Cordless Power Tool Battery Industry Revenue (Million) Forecast, by Application 2019 & 2032
- Table 58: Thailandc Cordless Power Tool Battery Industry Volume (K Unit) Forecast, by Application 2019 & 2032
- Table 59: Rest of Asia Pacific Cordless Power Tool Battery Industry Revenue (Million) Forecast, by Application 2019 & 2032
- Table 60: Rest of Asia Pacific Cordless Power Tool Battery Industry Volume (K Unit) Forecast, by Application 2019 & 2032
- Table 61: Global Cordless Power Tool Battery Industry Revenue Million Forecast, by Country 2019 & 2032
- Table 62: Global Cordless Power Tool Battery Industry Volume K Unit Forecast, by Country 2019 & 2032
- Table 63: Brazil Cordless Power Tool Battery Industry Revenue (Million) Forecast, by Application 2019 & 2032
- Table 64: Brazil Cordless Power Tool Battery Industry Volume (K Unit) Forecast, by Application 2019 & 2032
- Table 65: Argentina Cordless Power Tool Battery Industry Revenue (Million) Forecast, by Application 2019 & 2032
- Table 66: Argentina Cordless Power Tool Battery Industry Volume (K Unit) Forecast, by Application 2019 & 2032
- Table 67: Peru Cordless Power Tool Battery Industry Revenue (Million) Forecast, by Application 2019 & 2032
- Table 68: Peru Cordless Power Tool Battery Industry Volume (K Unit) Forecast, by Application 2019 & 2032
- Table 69: Chile Cordless Power Tool Battery Industry Revenue (Million) Forecast, by Application 2019 & 2032
- Table 70: Chile Cordless Power Tool Battery Industry Volume (K Unit) Forecast, by Application 2019 & 2032
- Table 71: Colombia Cordless Power Tool Battery Industry Revenue (Million) Forecast, by Application 2019 & 2032
- Table 72: Colombia Cordless Power Tool Battery Industry Volume (K Unit) Forecast, by Application 2019 & 2032
- Table 73: Ecuador Cordless Power Tool Battery Industry Revenue (Million) Forecast, by Application 2019 & 2032
- Table 74: Ecuador Cordless Power Tool Battery Industry Volume (K Unit) Forecast, by Application 2019 & 2032
- Table 75: Venezuela Cordless Power Tool Battery Industry Revenue (Million) Forecast, by Application 2019 & 2032
- Table 76: Venezuela Cordless Power Tool Battery Industry Volume (K Unit) Forecast, by Application 2019 & 2032
- Table 77: Rest of South America Cordless Power Tool Battery Industry Revenue (Million) Forecast, by Application 2019 & 2032
- Table 78: Rest of South America Cordless Power Tool Battery Industry Volume (K Unit) Forecast, by Application 2019 & 2032
- Table 79: Global Cordless Power Tool Battery Industry Revenue Million Forecast, by Country 2019 & 2032
- Table 80: Global Cordless Power Tool Battery Industry Volume K Unit Forecast, by Country 2019 & 2032
- Table 81: United States Cordless Power Tool Battery Industry Revenue (Million) Forecast, by Application 2019 & 2032
- Table 82: United States Cordless Power Tool Battery Industry Volume (K Unit) Forecast, by Application 2019 & 2032
- Table 83: Canada Cordless Power Tool Battery Industry Revenue (Million) Forecast, by Application 2019 & 2032
- Table 84: Canada Cordless Power Tool Battery Industry Volume (K Unit) Forecast, by Application 2019 & 2032
- Table 85: Mexico Cordless Power Tool Battery Industry Revenue (Million) Forecast, by Application 2019 & 2032
- Table 86: Mexico Cordless Power Tool Battery Industry Volume (K Unit) Forecast, by Application 2019 & 2032
- Table 87: Global Cordless Power Tool Battery Industry Revenue Million Forecast, by Country 2019 & 2032
- Table 88: Global Cordless Power Tool Battery Industry Volume K Unit Forecast, by Country 2019 & 2032
- Table 89: United Arab Emirates Cordless Power Tool Battery Industry Revenue (Million) Forecast, by Application 2019 & 2032
- Table 90: United Arab Emirates Cordless Power Tool Battery Industry Volume (K Unit) Forecast, by Application 2019 & 2032
- Table 91: Saudi Arabia Cordless Power Tool Battery Industry Revenue (Million) Forecast, by Application 2019 & 2032
- Table 92: Saudi Arabia Cordless Power Tool Battery Industry Volume (K Unit) Forecast, by Application 2019 & 2032
- Table 93: South Africa Cordless Power Tool Battery Industry Revenue (Million) Forecast, by Application 2019 & 2032
- Table 94: South Africa Cordless Power Tool Battery Industry Volume (K Unit) Forecast, by Application 2019 & 2032
- Table 95: Rest of Middle East and Africa Cordless Power Tool Battery Industry Revenue (Million) Forecast, by Application 2019 & 2032
- Table 96: Rest of Middle East and Africa Cordless Power Tool Battery Industry Volume (K Unit) Forecast, by Application 2019 & 2032
- Table 97: Global Cordless Power Tool Battery Industry Revenue Million Forecast, by Technology Type 2019 & 2032
- Table 98: Global Cordless Power Tool Battery Industry Volume K Unit Forecast, by Technology Type 2019 & 2032
- Table 99: Global Cordless Power Tool Battery Industry Revenue Million Forecast, by Country 2019 & 2032
- Table 100: Global Cordless Power Tool Battery Industry Volume K Unit Forecast, by Country 2019 & 2032
- Table 101: United States Cordless Power Tool Battery Industry Revenue (Million) Forecast, by Application 2019 & 2032
- Table 102: United States Cordless Power Tool Battery Industry Volume (K Unit) Forecast, by Application 2019 & 2032
- Table 103: Canada Cordless Power Tool Battery Industry Revenue (Million) Forecast, by Application 2019 & 2032
- Table 104: Canada Cordless Power Tool Battery Industry Volume (K Unit) Forecast, by Application 2019 & 2032
- Table 105: Rest of North America Cordless Power Tool Battery Industry Revenue (Million) Forecast, by Application 2019 & 2032
- Table 106: Rest of North America Cordless Power Tool Battery Industry Volume (K Unit) Forecast, by Application 2019 & 2032
- Table 107: Global Cordless Power Tool Battery Industry Revenue Million Forecast, by Technology Type 2019 & 2032
- Table 108: Global Cordless Power Tool Battery Industry Volume K Unit Forecast, by Technology Type 2019 & 2032
- Table 109: Global Cordless Power Tool Battery Industry Revenue Million Forecast, by Country 2019 & 2032
- Table 110: Global Cordless Power Tool Battery Industry Volume K Unit Forecast, by Country 2019 & 2032
- Table 111: Germany Cordless Power Tool Battery Industry Revenue (Million) Forecast, by Application 2019 & 2032
- Table 112: Germany Cordless Power Tool Battery Industry Volume (K Unit) Forecast, by Application 2019 & 2032
- Table 113: France Cordless Power Tool Battery Industry Revenue (Million) Forecast, by Application 2019 & 2032
- Table 114: France Cordless Power Tool Battery Industry Volume (K Unit) Forecast, by Application 2019 & 2032
- Table 115: United Kingdom Cordless Power Tool Battery Industry Revenue (Million) Forecast, by Application 2019 & 2032
- Table 116: United Kingdom Cordless Power Tool Battery Industry Volume (K Unit) Forecast, by Application 2019 & 2032
- Table 117: Italy Cordless Power Tool Battery Industry Revenue (Million) Forecast, by Application 2019 & 2032
- Table 118: Italy Cordless Power Tool Battery Industry Volume (K Unit) Forecast, by Application 2019 & 2032
- Table 119: Rest of Europe Cordless Power Tool Battery Industry Revenue (Million) Forecast, by Application 2019 & 2032
- Table 120: Rest of Europe Cordless Power Tool Battery Industry Volume (K Unit) Forecast, by Application 2019 & 2032
- Table 121: Global Cordless Power Tool Battery Industry Revenue Million Forecast, by Technology Type 2019 & 2032
- Table 122: Global Cordless Power Tool Battery Industry Volume K Unit Forecast, by Technology Type 2019 & 2032
- Table 123: Global Cordless Power Tool Battery Industry Revenue Million Forecast, by Country 2019 & 2032
- Table 124: Global Cordless Power Tool Battery Industry Volume K Unit Forecast, by Country 2019 & 2032
- Table 125: China Cordless Power Tool Battery Industry Revenue (Million) Forecast, by Application 2019 & 2032
- Table 126: China Cordless Power Tool Battery Industry Volume (K Unit) Forecast, by Application 2019 & 2032
- Table 127: India Cordless Power Tool Battery Industry Revenue (Million) Forecast, by Application 2019 & 2032
- Table 128: India Cordless Power Tool Battery Industry Volume (K Unit) Forecast, by Application 2019 & 2032
- Table 129: Japan Cordless Power Tool Battery Industry Revenue (Million) Forecast, by Application 2019 & 2032
- Table 130: Japan Cordless Power Tool Battery Industry Volume (K Unit) Forecast, by Application 2019 & 2032
- Table 131: Australia Cordless Power Tool Battery Industry Revenue (Million) Forecast, by Application 2019 & 2032
- Table 132: Australia Cordless Power Tool Battery Industry Volume (K Unit) Forecast, by Application 2019 & 2032
- Table 133: Rest of Asia Pacific Cordless Power Tool Battery Industry Revenue (Million) Forecast, by Application 2019 & 2032
- Table 134: Rest of Asia Pacific Cordless Power Tool Battery Industry Volume (K Unit) Forecast, by Application 2019 & 2032
- Table 135: Global Cordless Power Tool Battery Industry Revenue Million Forecast, by Technology Type 2019 & 2032
- Table 136: Global Cordless Power Tool Battery Industry Volume K Unit Forecast, by Technology Type 2019 & 2032
- Table 137: Global Cordless Power Tool Battery Industry Revenue Million Forecast, by Country 2019 & 2032
- Table 138: Global Cordless Power Tool Battery Industry Volume K Unit Forecast, by Country 2019 & 2032
- Table 139: Brazil Cordless Power Tool Battery Industry Revenue (Million) Forecast, by Application 2019 & 2032
- Table 140: Brazil Cordless Power Tool Battery Industry Volume (K Unit) Forecast, by Application 2019 & 2032
- Table 141: Argentina Cordless Power Tool Battery Industry Revenue (Million) Forecast, by Application 2019 & 2032
- Table 142: Argentina Cordless Power Tool Battery Industry Volume (K Unit) Forecast, by Application 2019 & 2032
- Table 143: Chile Cordless Power Tool Battery Industry Revenue (Million) Forecast, by Application 2019 & 2032
- Table 144: Chile Cordless Power Tool Battery Industry Volume (K Unit) Forecast, by Application 2019 & 2032
- Table 145: Rest of South America Cordless Power Tool Battery Industry Revenue (Million) Forecast, by Application 2019 & 2032
- Table 146: Rest of South America Cordless Power Tool Battery Industry Volume (K Unit) Forecast, by Application 2019 & 2032
- Table 147: Global Cordless Power Tool Battery Industry Revenue Million Forecast, by Technology Type 2019 & 2032
- Table 148: Global Cordless Power Tool Battery Industry Volume K Unit Forecast, by Technology Type 2019 & 2032
- Table 149: Global Cordless Power Tool Battery Industry Revenue Million Forecast, by Country 2019 & 2032
- Table 150: Global Cordless Power Tool Battery Industry Volume K Unit Forecast, by Country 2019 & 2032
- Table 151: United Arab Emirates Cordless Power Tool Battery Industry Revenue (Million) Forecast, by Application 2019 & 2032
- Table 152: United Arab Emirates Cordless Power Tool Battery Industry Volume (K Unit) Forecast, by Application 2019 & 2032
- Table 153: Saudi Arabia Cordless Power Tool Battery Industry Revenue (Million) Forecast, by Application 2019 & 2032
- Table 154: Saudi Arabia Cordless Power Tool Battery Industry Volume (K Unit) Forecast, by Application 2019 & 2032
- Table 155: Qatar Cordless Power Tool Battery Industry Revenue (Million) Forecast, by Application 2019 & 2032
- Table 156: Qatar Cordless Power Tool Battery Industry Volume (K Unit) Forecast, by Application 2019 & 2032
- Table 157: South Africa Cordless Power Tool Battery Industry Revenue (Million) Forecast, by Application 2019 & 2032
- Table 158: South Africa Cordless Power Tool Battery Industry Volume (K Unit) Forecast, by Application 2019 & 2032
- Table 159: Egypt Cordless Power Tool Battery Industry Revenue (Million) Forecast, by Application 2019 & 2032
- Table 160: Egypt Cordless Power Tool Battery Industry Volume (K Unit) Forecast, by Application 2019 & 2032
- Table 161: Rest of Middle East and Africa Cordless Power Tool Battery Industry Revenue (Million) Forecast, by Application 2019 & 2032
- Table 162: Rest of Middle East and Africa Cordless Power Tool Battery Industry Volume (K Unit) Forecast, by Application 2019 & 2032
Frequently Asked Questions
1. What is the projected Compound Annual Growth Rate (CAGR) of the Cordless Power Tool Battery Industry?
The projected CAGR is approximately 8.30%.
2. Which companies are prominent players in the Cordless Power Tool Battery Industry?
Key companies in the market include Ryobi Limited, Samsung SDI Co Ltd, Stanley Black & Decker Inc, Hitachi Ltd, Techtronic Industries Company Limited, Hilti Corporation*List Not Exhaustive 6 4 Market Ranking/Share (%) Analysi, Sony Group Corporation, Bosch Ltd, Panasonic Corporation, Makita Corporation.
3. What are the main segments of the Cordless Power Tool Battery Industry?
The market segments include Technology Type.
4. Can you provide details about the market size?
The market size is estimated to be USD 2.78 Million as of 2022.
5. What are some drivers contributing to market growth?
4.; Increasing Adoption Of Battery-Powered Power Tools4.; Rapidly Growing Automotive Industry.
6. What are the notable trends driving market growth?
The Lithium-ion Type is Expected to Dominate the Market.
7. Are there any restraints impacting market growth?
4.; High Cost Associated With Cordless Power Tool Equipment.
8. Can you provide examples of recent developments in the market?
In January 2023, Hilti North America, a global leader providing innovative tools, technology, software, and services to the commercial construction industry announced that in 2023 more than 30 new cordless tools will be added to its portfolio of more than 70 existing Nuron battery-powered tools.
9. What pricing options are available for accessing the report?
Pricing options include single-user, multi-user, and enterprise licenses priced at USD 4750, USD 5250, and USD 8750 respectively.
10. Is the market size provided in terms of value or volume?
The market size is provided in terms of value, measured in Million and volume, measured in K Unit.
11. Are there any specific market keywords associated with the report?
Yes, the market keyword associated with the report is "Cordless Power Tool Battery Industry," which aids in identifying and referencing the specific market segment covered.
12. How do I determine which pricing option suits my needs best?
The pricing options vary based on user requirements and access needs. Individual users may opt for single-user licenses, while businesses requiring broader access may choose multi-user or enterprise licenses for cost-effective access to the report.
13. Are there any additional resources or data provided in the Cordless Power Tool Battery Industry report?
While the report offers comprehensive insights, it's advisable to review the specific contents or supplementary materials provided to ascertain if additional resources or data are available.
14. How can I stay updated on further developments or reports in the Cordless Power Tool Battery Industry?
To stay informed about further developments, trends, and reports in the Cordless Power Tool Battery Industry, consider subscribing to industry newsletters, following relevant companies and organizations, or regularly checking reputable industry news sources and publications.
Methodology
Step 1 - Identification of Relevant Samples Size from Population Database


Step 2 - Approaches for Defining Global Market Size (Value, Volume* & Price*)

Note*: In applicable scenarios
Step 3 - Data Sources
Primary Research
- Web Analytics
- Survey Reports
- Research Institute
- Latest Research Reports
- Opinion Leaders
Secondary Research
- Annual Reports
- White Paper
- Latest Press Release
- Industry Association
- Paid Database
- Investor Presentations

Step 4 - Data Triangulation
Involves using different sources of information in order to increase the validity of a study
These sources are likely to be stakeholders in a program - participants, other researchers, program staff, other community members, and so on.
Then we put all data in single framework & apply various statistical tools to find out the dynamic on the market.
During the analysis stage, feedback from the stakeholder groups would be compared to determine areas of agreement as well as areas of divergence


