
Key Insights
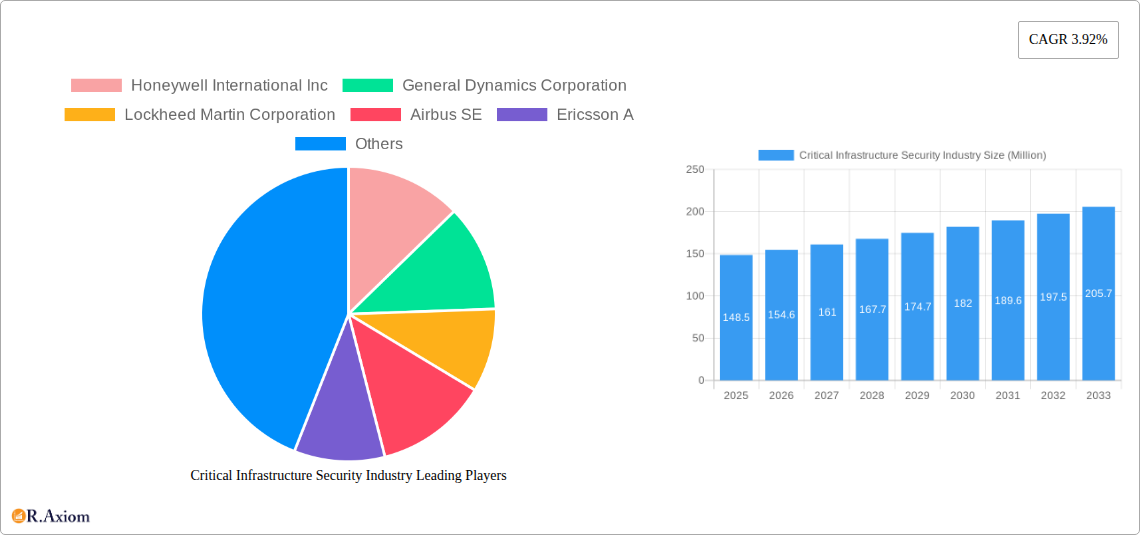
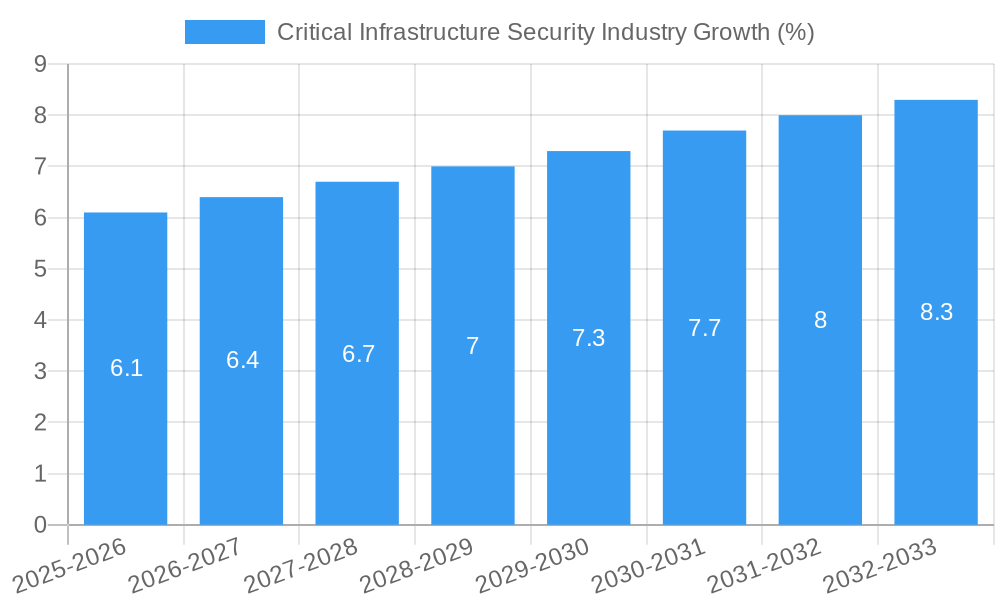
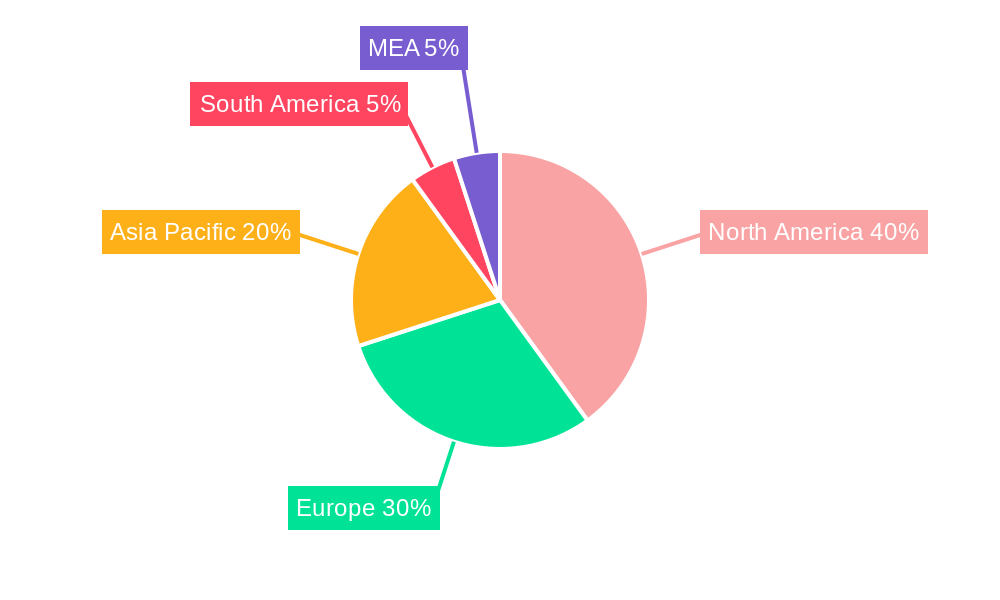
The Critical Infrastructure Security market, valued at $148.5 million in 2025, is projected to experience robust growth, driven by escalating cyber threats and the increasing reliance on interconnected systems across energy, transportation, and other sensitive sectors. A compound annual growth rate (CAGR) of 3.92% from 2025 to 2033 indicates a steady expansion, fueled by rising government regulations mandating enhanced security measures and the adoption of advanced technologies like AI-powered threat detection and predictive analytics. The market is segmented by offering (security technology, physical security solutions, access control, etc.), services (risk management, integration, managed services), and vertical (energy, transportation, etc.). North America currently holds a significant market share due to advanced infrastructure and stringent security protocols, but the Asia-Pacific region is poised for significant growth due to rapid infrastructure development and increasing digitalization. Competition is fierce, with established players like Honeywell, Lockheed Martin, and General Dynamics vying for market dominance alongside emerging cybersecurity specialists. The integration of IoT devices and cloud technologies presents both opportunities and challenges, requiring robust security solutions to mitigate vulnerabilities. Furthermore, the market will see increased focus on proactive security strategies including threat intelligence and vulnerability management to combat sophisticated cyberattacks.
The market's growth trajectory is influenced by several factors. The increasing sophistication of cyberattacks targeting critical infrastructure necessitates robust and adaptable security solutions. Growing government investments in cybersecurity infrastructure and regulations are further driving market expansion. The demand for integrated security solutions that seamlessly combine physical and cybersecurity measures is on the rise. This trend is particularly evident in the energy and transportation sectors, where the consequences of security breaches can be catastrophic. Conversely, high initial investment costs associated with implementing advanced security systems and a shortage of skilled cybersecurity professionals represent key restraints. However, the potential for substantial financial and operational losses from security failures outweighs the upfront investment, ensuring sustained market growth throughout the forecast period. Future growth will depend on continued technological innovation, the ability to effectively address the skills gap in cybersecurity, and the proactive implementation of security measures across all segments of critical infrastructure.
Critical Infrastructure Security Industry Market Report: 2019-2033
This comprehensive report provides a detailed analysis of the Critical Infrastructure Security industry, encompassing market size, growth projections, key players, and emerging trends from 2019 to 2033. The study period covers the historical period (2019-2024), the base year (2025), and the forecast period (2025-2033). The report offers actionable insights for industry stakeholders, investors, and businesses seeking to navigate this dynamic market. The global market size in 2025 is estimated at $XX Million.
Critical Infrastructure Security Industry Market Concentration & Innovation
The Critical Infrastructure Security market exhibits a moderately concentrated landscape with several large multinational corporations holding significant market share. Honeywell International Inc, General Dynamics Corporation, Lockheed Martin Corporation, and Airbus SE are among the leading players, collectively commanding an estimated xx% of the market in 2025. Market concentration is influenced by factors such as high barriers to entry (requiring significant capital investment and specialized expertise), strong brand recognition, and established customer relationships. Innovation is a key driver, with ongoing advancements in areas like AI-powered threat detection, blockchain-based security solutions, and quantum-resistant cryptography.
- Market Share: Honeywell International Inc (xx%), General Dynamics Corporation (xx%), Lockheed Martin Corporation (xx%), Airbus SE (xx%). Other players account for the remaining share.
- M&A Activity: The industry has witnessed significant M&A activity in recent years, with deal values exceeding $XX Million annually. This consolidation reflects companies’ efforts to expand their product portfolios, geographic reach, and technological capabilities. Consolidation is expected to continue during the forecast period driven by the need for enhanced cybersecurity expertise and increased investment in R&D.
- Regulatory Frameworks: Stringent government regulations, including compliance mandates like NIST Cybersecurity Framework and GDPR, are driving demand for robust security solutions and increasing the overall market size.
- Product Substitutes: While direct substitutes are limited, some organizations might opt for internal development or open-source solutions, albeit with potentially reduced effectiveness. The focus is on integrated solutions, posing a challenge for independent product providers.
- End-User Trends: The increasing adoption of cloud computing and IoT devices is leading to a heightened reliance on comprehensive cybersecurity solutions. End-users are increasingly prioritizing proactive security measures, demand greater levels of automation, and seek seamless integration with existing systems.
Critical Infrastructure Security Industry Industry Trends & Insights
The Critical Infrastructure Security market is experiencing robust growth, driven by several key factors. The increasing sophistication and frequency of cyberattacks targeting critical infrastructure systems are creating a significant demand for advanced security solutions. Governments worldwide are investing heavily in bolstering the cybersecurity posture of essential services, fueling market expansion. The rising adoption of cloud computing, IoT, and connected devices within critical infrastructure has broadened the attack surface, increasing vulnerability and the need for sophisticated security measures. This is further propelled by evolving technological disruptions, particularly in artificial intelligence (AI), machine learning (ML), and blockchain, which are enhancing threat detection, response, and prevention capabilities. The CAGR for the period 2025-2033 is projected at xx%. Market penetration is expected to increase from xx% in 2025 to xx% by 2033, driven by rising awareness of security risks and increasing regulatory pressures. The competitive landscape is characterized by intense rivalry among established players and emerging technology providers, leading to innovation and price competition.
Dominant Markets & Segments in Critical Infrastructure Security Industry
The Energy and Power sector currently represents the largest segment within the Critical Infrastructure Security market, accounting for an estimated xx% of the global market in 2025. North America and Europe are the leading regions, followed by Asia Pacific, demonstrating strong growth potential.
By Offering:
- Security Technology: This segment is the largest, driven by the demand for advanced threat detection and response solutions.
- Physical Security: Screening and scanning solutions are experiencing strong growth due to stringent security requirements in critical infrastructure facilities. Video surveillance and access control are also significant contributors. PSIM and PIAM systems enhance the effectiveness of security operations.
- By Services: Risk management, design, integration, and consultation services are in high demand, reflecting the complexity of securing critical infrastructure. Managed services and maintenance and support are crucial for ensuring the ongoing functionality of security systems.
By Vertical:
- Energy and Power: High demand due to the critical nature of power grids and energy infrastructure, which are prime targets for cyberattacks. The significant capital investment in renewable energy infrastructure further fuels this segment's growth.
- Transportation: The increasing reliance on connected systems in transportation (e.g., autonomous vehicles, smart traffic management) creates vulnerability requiring heightened security measures.
- Sensitive Infrastructure and Enterprises: This segment includes government facilities, healthcare systems, and financial institutions, all of which require stringent security measures to protect sensitive data and operations.
Key Drivers:
- Stringent government regulations: Governments worldwide are implementing stricter regulations and compliance mandates, driving investment in security solutions.
- Economic policies promoting infrastructure investment: Public and private investment in upgrading critical infrastructure is boosting demand for security solutions.
Critical Infrastructure Security Industry Product Developments
Recent product innovations focus on AI-powered threat detection, advanced analytics for predictive security, and seamless integration with existing infrastructure. Solutions emphasizing zero-trust architectures, enhanced endpoint security, and threat intelligence platforms are gaining traction. The market is witnessing a shift towards cloud-based security solutions, providing scalability and improved management capabilities. Products emphasizing ease of use and streamlined deployment are particularly appealing to organizations with limited security expertise.
Report Scope & Segmentation Analysis
This report segments the Critical Infrastructure Security market by Offering (Security Technology, Physical Security - Screening and Scanning, Video Surveillance, PSIM and PIAM, Access Control), Services (Risk Management Services, Designing, Integration, and Consultation, Managed Services, Maintenance and Support), and Vertical (Energy and Power, Transportation, Sensitive Infrastructure and Enterprises). Each segment's market size, growth projections, and competitive landscape are analyzed in detail. The report provides a comprehensive overview of the market dynamics within each segment, highlighting key growth drivers and challenges. Growth projections for each segment vary based on market maturity and the specific technological trends within the vertical.
Key Drivers of Critical Infrastructure Security Industry Growth
The market's growth is propelled by several factors, including increased government regulations and compliance mandates, the rising adoption of IoT and cloud technologies, and the growing sophistication of cyberattacks targeting critical infrastructure. Significant investments in upgrading existing infrastructure and the expansion of smart city initiatives are also contributing to market growth. The development of advanced security technologies, such as AI-powered threat detection and predictive analytics, is further enhancing market prospects.
Challenges in the Critical Infrastructure Security Industry Sector
The industry faces several challenges, including the complexity of securing diverse and interconnected systems, the shortage of skilled cybersecurity professionals, and the high cost of implementing and maintaining comprehensive security solutions. Supply chain vulnerabilities and the constant evolution of cyber threats present ongoing obstacles. Regulatory compliance requirements can be complex and costly, creating challenges for smaller organizations.
Emerging Opportunities in Critical Infrastructure Security Industry
Emerging opportunities lie in the increasing adoption of AI and ML in threat detection and response, the growth of cloud-based security solutions, and the expansion into new and developing markets. The increasing adoption of blockchain technology for enhancing data security and the development of quantum-resistant cryptography offer promising avenues for future growth. There's also potential in the integration of physical and cybersecurity measures, fostering comprehensive security solutions.
Leading Players in the Critical Infrastructure Security Industry Market
- Honeywell International Inc
- General Dynamics Corporation
- Lockheed Martin Corporation
- Airbus SE
- Ericsson A
- Kaspersky Lab Inc
- Hexagon AB
- BAE Systems PLC
- Northrop Grumman Corp
- Waterfall Security Solutions
- McAfee Corp
- General Electric Company
Key Developments in Critical Infrastructure Security Industry Industry
- October 2023: GHD Digital launched its Cyber Critical Infrastructure and Risk Centre of Excellence (CoE), enhancing the industry's focus on proactive threat mitigation.
- May 2023: The U.S. CISA launched the Ransomware Vulnerability Warning Pilot (RVWP) program, providing critical infrastructure organizations with proactive threat intelligence.
Strategic Outlook for Critical Infrastructure Security Industry Market
The Critical Infrastructure Security market is poised for continued robust growth driven by escalating cyber threats, stringent regulations, and increased investments in critical infrastructure. The adoption of innovative technologies, such as AI and ML, and the expansion into new verticals and geographic markets will further fuel growth. Companies focusing on proactive security measures, integrated solutions, and strong partnerships will be well-positioned to capitalize on emerging opportunities in this dynamic and essential market.
Critical Infrastructure Security Industry Segmentation
-
1. Offering
-
1.1. Security Technology
- 1.1.1. Network Security
- 1.1.2. Physical Security
- 1.1.3. Vehicle Identification Management
- 1.1.4. Building Management Systems
- 1.1.5. Secure Communications
- 1.1.6. Radars
- 1.1.7. SCADA Security
- 1.1.8. CBRNE
-
1.1. Security Technology
-
2. Services
- 2.1. Risk Management Services
- 2.2. Designing, Integration, and Consultation
- 2.3. Managed Services
- 2.4. Maintenance and Support
-
3. Vertical
- 3.1. Energy and Power
- 3.2. Transportation
- 3.3. Sensitive Infrastructure and Enterprises
Critical Infrastructure Security Industry Segmentation By Geography
-
1. North America
- 1.1. United States
- 1.2. Canada
-
2. Europe
- 2.1. Germany
- 2.2. United Kingdom
- 2.3. France
- 2.4. Italy
-
3. Asia
- 3.1. China
- 3.2. Japan
- 3.3. India
-
4. Latin America
- 4.1. Brazil
- 4.2. Argentina
- 4.3. Mexico
-
5. Middle East and Africa
- 5.1. United Arab Emirates
- 5.2. Saudi Arabia
- 5.3. South Africa
- 5.4. Turkey
Critical Infrastructure Security Industry REPORT HIGHLIGHTS
| Aspects | Details |
|---|---|
| Study Period | 2019-2033 |
| Base Year | 2024 |
| Estimated Year | 2025 |
| Forecast Period | 2025-2033 |
| Historical Period | 2019-2024 |
| Growth Rate | CAGR of 3.92% from 2019-2033 |
| Segmentation |
|
Table of Contents
- 1. Introduction
- 1.1. Research Scope
- 1.2. Market Segmentation
- 1.3. Research Methodology
- 1.4. Definitions and Assumptions
- 2. Executive Summary
- 2.1. Introduction
- 3. Market Dynamics
- 3.1. Introduction
- 3.2. Market Drivers
- 3.2.1 Enormous Investments in Smart Grid Technology; Physical Threats
- 3.2.2 Cyber Threats
- 3.2.3 and Insider Attacks; Joint Functioning of Cloud Computing and Critical Infrastructure Protection; Political Pressures for Better Regulations and Implementations
- 3.3. Market Restrains
- 3.3.1. Poor Understanding of Industrial Control Systems; Lack of Interoperability Between Products
- 3.4. Market Trends
- 3.4.1. Maintenance and Support Services to Witness Major Growth
- 4. Market Factor Analysis
- 4.1. Porters Five Forces
- 4.2. Supply/Value Chain
- 4.3. PESTEL analysis
- 4.4. Market Entropy
- 4.5. Patent/Trademark Analysis
- 5. Global Critical Infrastructure Security Industry Analysis, Insights and Forecast, 2019-2031
- 5.1. Market Analysis, Insights and Forecast - by Offering
- 5.1.1. Security Technology
- 5.1.1.1. Network Security
- 5.1.1.2. Physical Security
- 5.1.1.3. Vehicle Identification Management
- 5.1.1.4. Building Management Systems
- 5.1.1.5. Secure Communications
- 5.1.1.6. Radars
- 5.1.1.7. SCADA Security
- 5.1.1.8. CBRNE
- 5.1.1. Security Technology
- 5.2. Market Analysis, Insights and Forecast - by Services
- 5.2.1. Risk Management Services
- 5.2.2. Designing, Integration, and Consultation
- 5.2.3. Managed Services
- 5.2.4. Maintenance and Support
- 5.3. Market Analysis, Insights and Forecast - by Vertical
- 5.3.1. Energy and Power
- 5.3.2. Transportation
- 5.3.3. Sensitive Infrastructure and Enterprises
- 5.4. Market Analysis, Insights and Forecast - by Region
- 5.4.1. North America
- 5.4.2. Europe
- 5.4.3. Asia
- 5.4.4. Latin America
- 5.4.5. Middle East and Africa
- 5.1. Market Analysis, Insights and Forecast - by Offering
- 6. North America Critical Infrastructure Security Industry Analysis, Insights and Forecast, 2019-2031
- 6.1. Market Analysis, Insights and Forecast - by Offering
- 6.1.1. Security Technology
- 6.1.1.1. Network Security
- 6.1.1.2. Physical Security
- 6.1.1.3. Vehicle Identification Management
- 6.1.1.4. Building Management Systems
- 6.1.1.5. Secure Communications
- 6.1.1.6. Radars
- 6.1.1.7. SCADA Security
- 6.1.1.8. CBRNE
- 6.1.1. Security Technology
- 6.2. Market Analysis, Insights and Forecast - by Services
- 6.2.1. Risk Management Services
- 6.2.2. Designing, Integration, and Consultation
- 6.2.3. Managed Services
- 6.2.4. Maintenance and Support
- 6.3. Market Analysis, Insights and Forecast - by Vertical
- 6.3.1. Energy and Power
- 6.3.2. Transportation
- 6.3.3. Sensitive Infrastructure and Enterprises
- 6.1. Market Analysis, Insights and Forecast - by Offering
- 7. Europe Critical Infrastructure Security Industry Analysis, Insights and Forecast, 2019-2031
- 7.1. Market Analysis, Insights and Forecast - by Offering
- 7.1.1. Security Technology
- 7.1.1.1. Network Security
- 7.1.1.2. Physical Security
- 7.1.1.3. Vehicle Identification Management
- 7.1.1.4. Building Management Systems
- 7.1.1.5. Secure Communications
- 7.1.1.6. Radars
- 7.1.1.7. SCADA Security
- 7.1.1.8. CBRNE
- 7.1.1. Security Technology
- 7.2. Market Analysis, Insights and Forecast - by Services
- 7.2.1. Risk Management Services
- 7.2.2. Designing, Integration, and Consultation
- 7.2.3. Managed Services
- 7.2.4. Maintenance and Support
- 7.3. Market Analysis, Insights and Forecast - by Vertical
- 7.3.1. Energy and Power
- 7.3.2. Transportation
- 7.3.3. Sensitive Infrastructure and Enterprises
- 7.1. Market Analysis, Insights and Forecast - by Offering
- 8. Asia Critical Infrastructure Security Industry Analysis, Insights and Forecast, 2019-2031
- 8.1. Market Analysis, Insights and Forecast - by Offering
- 8.1.1. Security Technology
- 8.1.1.1. Network Security
- 8.1.1.2. Physical Security
- 8.1.1.3. Vehicle Identification Management
- 8.1.1.4. Building Management Systems
- 8.1.1.5. Secure Communications
- 8.1.1.6. Radars
- 8.1.1.7. SCADA Security
- 8.1.1.8. CBRNE
- 8.1.1. Security Technology
- 8.2. Market Analysis, Insights and Forecast - by Services
- 8.2.1. Risk Management Services
- 8.2.2. Designing, Integration, and Consultation
- 8.2.3. Managed Services
- 8.2.4. Maintenance and Support
- 8.3. Market Analysis, Insights and Forecast - by Vertical
- 8.3.1. Energy and Power
- 8.3.2. Transportation
- 8.3.3. Sensitive Infrastructure and Enterprises
- 8.1. Market Analysis, Insights and Forecast - by Offering
- 9. Latin America Critical Infrastructure Security Industry Analysis, Insights and Forecast, 2019-2031
- 9.1. Market Analysis, Insights and Forecast - by Offering
- 9.1.1. Security Technology
- 9.1.1.1. Network Security
- 9.1.1.2. Physical Security
- 9.1.1.3. Vehicle Identification Management
- 9.1.1.4. Building Management Systems
- 9.1.1.5. Secure Communications
- 9.1.1.6. Radars
- 9.1.1.7. SCADA Security
- 9.1.1.8. CBRNE
- 9.1.1. Security Technology
- 9.2. Market Analysis, Insights and Forecast - by Services
- 9.2.1. Risk Management Services
- 9.2.2. Designing, Integration, and Consultation
- 9.2.3. Managed Services
- 9.2.4. Maintenance and Support
- 9.3. Market Analysis, Insights and Forecast - by Vertical
- 9.3.1. Energy and Power
- 9.3.2. Transportation
- 9.3.3. Sensitive Infrastructure and Enterprises
- 9.1. Market Analysis, Insights and Forecast - by Offering
- 10. Middle East and Africa Critical Infrastructure Security Industry Analysis, Insights and Forecast, 2019-2031
- 10.1. Market Analysis, Insights and Forecast - by Offering
- 10.1.1. Security Technology
- 10.1.1.1. Network Security
- 10.1.1.2. Physical Security
- 10.1.1.3. Vehicle Identification Management
- 10.1.1.4. Building Management Systems
- 10.1.1.5. Secure Communications
- 10.1.1.6. Radars
- 10.1.1.7. SCADA Security
- 10.1.1.8. CBRNE
- 10.1.1. Security Technology
- 10.2. Market Analysis, Insights and Forecast - by Services
- 10.2.1. Risk Management Services
- 10.2.2. Designing, Integration, and Consultation
- 10.2.3. Managed Services
- 10.2.4. Maintenance and Support
- 10.3. Market Analysis, Insights and Forecast - by Vertical
- 10.3.1. Energy and Power
- 10.3.2. Transportation
- 10.3.3. Sensitive Infrastructure and Enterprises
- 10.1. Market Analysis, Insights and Forecast - by Offering
- 11. North America Critical Infrastructure Security Industry Analysis, Insights and Forecast, 2019-2031
- 11.1. Market Analysis, Insights and Forecast - By Country/Sub-region
- 11.1.1 United States
- 11.1.2 Canada
- 11.1.3 Mexico
- 12. Europe Critical Infrastructure Security Industry Analysis, Insights and Forecast, 2019-2031
- 12.1. Market Analysis, Insights and Forecast - By Country/Sub-region
- 12.1.1 Germany
- 12.1.2 United Kingdom
- 12.1.3 France
- 12.1.4 Spain
- 12.1.5 Italy
- 12.1.6 Spain
- 12.1.7 Belgium
- 12.1.8 Netherland
- 12.1.9 Nordics
- 12.1.10 Rest of Europe
- 13. Asia Pacific Critical Infrastructure Security Industry Analysis, Insights and Forecast, 2019-2031
- 13.1. Market Analysis, Insights and Forecast - By Country/Sub-region
- 13.1.1 China
- 13.1.2 Japan
- 13.1.3 India
- 13.1.4 South Korea
- 13.1.5 Southeast Asia
- 13.1.6 Australia
- 13.1.7 Indonesia
- 13.1.8 Phillipes
- 13.1.9 Singapore
- 13.1.10 Thailandc
- 13.1.11 Rest of Asia Pacific
- 14. South America Critical Infrastructure Security Industry Analysis, Insights and Forecast, 2019-2031
- 14.1. Market Analysis, Insights and Forecast - By Country/Sub-region
- 14.1.1 Brazil
- 14.1.2 Argentina
- 14.1.3 Peru
- 14.1.4 Chile
- 14.1.5 Colombia
- 14.1.6 Ecuador
- 14.1.7 Venezuela
- 14.1.8 Rest of South America
- 15. North America Critical Infrastructure Security Industry Analysis, Insights and Forecast, 2019-2031
- 15.1. Market Analysis, Insights and Forecast - By Country/Sub-region
- 15.1.1 United States
- 15.1.2 Canada
- 15.1.3 Mexico
- 16. MEA Critical Infrastructure Security Industry Analysis, Insights and Forecast, 2019-2031
- 16.1. Market Analysis, Insights and Forecast - By Country/Sub-region
- 16.1.1 United Arab Emirates
- 16.1.2 Saudi Arabia
- 16.1.3 South Africa
- 16.1.4 Rest of Middle East and Africa
- 17. Competitive Analysis
- 17.1. Global Market Share Analysis 2024
- 17.2. Company Profiles
- 17.2.1 Honeywell International Inc
- 17.2.1.1. Overview
- 17.2.1.2. Products
- 17.2.1.3. SWOT Analysis
- 17.2.1.4. Recent Developments
- 17.2.1.5. Financials (Based on Availability)
- 17.2.2 General Dynamics Corporation
- 17.2.2.1. Overview
- 17.2.2.2. Products
- 17.2.2.3. SWOT Analysis
- 17.2.2.4. Recent Developments
- 17.2.2.5. Financials (Based on Availability)
- 17.2.3 Lockheed Martin Corporation
- 17.2.3.1. Overview
- 17.2.3.2. Products
- 17.2.3.3. SWOT Analysis
- 17.2.3.4. Recent Developments
- 17.2.3.5. Financials (Based on Availability)
- 17.2.4 Airbus SE
- 17.2.4.1. Overview
- 17.2.4.2. Products
- 17.2.4.3. SWOT Analysis
- 17.2.4.4. Recent Developments
- 17.2.4.5. Financials (Based on Availability)
- 17.2.5 Ericsson A
- 17.2.5.1. Overview
- 17.2.5.2. Products
- 17.2.5.3. SWOT Analysis
- 17.2.5.4. Recent Developments
- 17.2.5.5. Financials (Based on Availability)
- 17.2.6 Kaspersky Lab Inc
- 17.2.6.1. Overview
- 17.2.6.2. Products
- 17.2.6.3. SWOT Analysis
- 17.2.6.4. Recent Developments
- 17.2.6.5. Financials (Based on Availability)
- 17.2.7 Hexagon AB
- 17.2.7.1. Overview
- 17.2.7.2. Products
- 17.2.7.3. SWOT Analysis
- 17.2.7.4. Recent Developments
- 17.2.7.5. Financials (Based on Availability)
- 17.2.8 BAE Systems PLC
- 17.2.8.1. Overview
- 17.2.8.2. Products
- 17.2.8.3. SWOT Analysis
- 17.2.8.4. Recent Developments
- 17.2.8.5. Financials (Based on Availability)
- 17.2.9 Northrop Grumman Corp
- 17.2.9.1. Overview
- 17.2.9.2. Products
- 17.2.9.3. SWOT Analysis
- 17.2.9.4. Recent Developments
- 17.2.9.5. Financials (Based on Availability)
- 17.2.10 Waterfall Security Solutions
- 17.2.10.1. Overview
- 17.2.10.2. Products
- 17.2.10.3. SWOT Analysis
- 17.2.10.4. Recent Developments
- 17.2.10.5. Financials (Based on Availability)
- 17.2.11 McAfee Corp
- 17.2.11.1. Overview
- 17.2.11.2. Products
- 17.2.11.3. SWOT Analysis
- 17.2.11.4. Recent Developments
- 17.2.11.5. Financials (Based on Availability)
- 17.2.12 General Electric Company
- 17.2.12.1. Overview
- 17.2.12.2. Products
- 17.2.12.3. SWOT Analysis
- 17.2.12.4. Recent Developments
- 17.2.12.5. Financials (Based on Availability)
- 17.2.1 Honeywell International Inc
List of Figures
- Figure 1: Global Critical Infrastructure Security Industry Revenue Breakdown (Million, %) by Region 2024 & 2032
- Figure 2: Global Critical Infrastructure Security Industry Volume Breakdown (K Unit, %) by Region 2024 & 2032
- Figure 3: North America Critical Infrastructure Security Industry Revenue (Million), by Country 2024 & 2032
- Figure 4: North America Critical Infrastructure Security Industry Volume (K Unit), by Country 2024 & 2032
- Figure 5: North America Critical Infrastructure Security Industry Revenue Share (%), by Country 2024 & 2032
- Figure 6: North America Critical Infrastructure Security Industry Volume Share (%), by Country 2024 & 2032
- Figure 7: Europe Critical Infrastructure Security Industry Revenue (Million), by Country 2024 & 2032
- Figure 8: Europe Critical Infrastructure Security Industry Volume (K Unit), by Country 2024 & 2032
- Figure 9: Europe Critical Infrastructure Security Industry Revenue Share (%), by Country 2024 & 2032
- Figure 10: Europe Critical Infrastructure Security Industry Volume Share (%), by Country 2024 & 2032
- Figure 11: Asia Pacific Critical Infrastructure Security Industry Revenue (Million), by Country 2024 & 2032
- Figure 12: Asia Pacific Critical Infrastructure Security Industry Volume (K Unit), by Country 2024 & 2032
- Figure 13: Asia Pacific Critical Infrastructure Security Industry Revenue Share (%), by Country 2024 & 2032
- Figure 14: Asia Pacific Critical Infrastructure Security Industry Volume Share (%), by Country 2024 & 2032
- Figure 15: South America Critical Infrastructure Security Industry Revenue (Million), by Country 2024 & 2032
- Figure 16: South America Critical Infrastructure Security Industry Volume (K Unit), by Country 2024 & 2032
- Figure 17: South America Critical Infrastructure Security Industry Revenue Share (%), by Country 2024 & 2032
- Figure 18: South America Critical Infrastructure Security Industry Volume Share (%), by Country 2024 & 2032
- Figure 19: North America Critical Infrastructure Security Industry Revenue (Million), by Country 2024 & 2032
- Figure 20: North America Critical Infrastructure Security Industry Volume (K Unit), by Country 2024 & 2032
- Figure 21: North America Critical Infrastructure Security Industry Revenue Share (%), by Country 2024 & 2032
- Figure 22: North America Critical Infrastructure Security Industry Volume Share (%), by Country 2024 & 2032
- Figure 23: MEA Critical Infrastructure Security Industry Revenue (Million), by Country 2024 & 2032
- Figure 24: MEA Critical Infrastructure Security Industry Volume (K Unit), by Country 2024 & 2032
- Figure 25: MEA Critical Infrastructure Security Industry Revenue Share (%), by Country 2024 & 2032
- Figure 26: MEA Critical Infrastructure Security Industry Volume Share (%), by Country 2024 & 2032
- Figure 27: North America Critical Infrastructure Security Industry Revenue (Million), by Offering 2024 & 2032
- Figure 28: North America Critical Infrastructure Security Industry Volume (K Unit), by Offering 2024 & 2032
- Figure 29: North America Critical Infrastructure Security Industry Revenue Share (%), by Offering 2024 & 2032
- Figure 30: North America Critical Infrastructure Security Industry Volume Share (%), by Offering 2024 & 2032
- Figure 31: North America Critical Infrastructure Security Industry Revenue (Million), by Services 2024 & 2032
- Figure 32: North America Critical Infrastructure Security Industry Volume (K Unit), by Services 2024 & 2032
- Figure 33: North America Critical Infrastructure Security Industry Revenue Share (%), by Services 2024 & 2032
- Figure 34: North America Critical Infrastructure Security Industry Volume Share (%), by Services 2024 & 2032
- Figure 35: North America Critical Infrastructure Security Industry Revenue (Million), by Vertical 2024 & 2032
- Figure 36: North America Critical Infrastructure Security Industry Volume (K Unit), by Vertical 2024 & 2032
- Figure 37: North America Critical Infrastructure Security Industry Revenue Share (%), by Vertical 2024 & 2032
- Figure 38: North America Critical Infrastructure Security Industry Volume Share (%), by Vertical 2024 & 2032
- Figure 39: North America Critical Infrastructure Security Industry Revenue (Million), by Country 2024 & 2032
- Figure 40: North America Critical Infrastructure Security Industry Volume (K Unit), by Country 2024 & 2032
- Figure 41: North America Critical Infrastructure Security Industry Revenue Share (%), by Country 2024 & 2032
- Figure 42: North America Critical Infrastructure Security Industry Volume Share (%), by Country 2024 & 2032
- Figure 43: Europe Critical Infrastructure Security Industry Revenue (Million), by Offering 2024 & 2032
- Figure 44: Europe Critical Infrastructure Security Industry Volume (K Unit), by Offering 2024 & 2032
- Figure 45: Europe Critical Infrastructure Security Industry Revenue Share (%), by Offering 2024 & 2032
- Figure 46: Europe Critical Infrastructure Security Industry Volume Share (%), by Offering 2024 & 2032
- Figure 47: Europe Critical Infrastructure Security Industry Revenue (Million), by Services 2024 & 2032
- Figure 48: Europe Critical Infrastructure Security Industry Volume (K Unit), by Services 2024 & 2032
- Figure 49: Europe Critical Infrastructure Security Industry Revenue Share (%), by Services 2024 & 2032
- Figure 50: Europe Critical Infrastructure Security Industry Volume Share (%), by Services 2024 & 2032
- Figure 51: Europe Critical Infrastructure Security Industry Revenue (Million), by Vertical 2024 & 2032
- Figure 52: Europe Critical Infrastructure Security Industry Volume (K Unit), by Vertical 2024 & 2032
- Figure 53: Europe Critical Infrastructure Security Industry Revenue Share (%), by Vertical 2024 & 2032
- Figure 54: Europe Critical Infrastructure Security Industry Volume Share (%), by Vertical 2024 & 2032
- Figure 55: Europe Critical Infrastructure Security Industry Revenue (Million), by Country 2024 & 2032
- Figure 56: Europe Critical Infrastructure Security Industry Volume (K Unit), by Country 2024 & 2032
- Figure 57: Europe Critical Infrastructure Security Industry Revenue Share (%), by Country 2024 & 2032
- Figure 58: Europe Critical Infrastructure Security Industry Volume Share (%), by Country 2024 & 2032
- Figure 59: Asia Critical Infrastructure Security Industry Revenue (Million), by Offering 2024 & 2032
- Figure 60: Asia Critical Infrastructure Security Industry Volume (K Unit), by Offering 2024 & 2032
- Figure 61: Asia Critical Infrastructure Security Industry Revenue Share (%), by Offering 2024 & 2032
- Figure 62: Asia Critical Infrastructure Security Industry Volume Share (%), by Offering 2024 & 2032
- Figure 63: Asia Critical Infrastructure Security Industry Revenue (Million), by Services 2024 & 2032
- Figure 64: Asia Critical Infrastructure Security Industry Volume (K Unit), by Services 2024 & 2032
- Figure 65: Asia Critical Infrastructure Security Industry Revenue Share (%), by Services 2024 & 2032
- Figure 66: Asia Critical Infrastructure Security Industry Volume Share (%), by Services 2024 & 2032
- Figure 67: Asia Critical Infrastructure Security Industry Revenue (Million), by Vertical 2024 & 2032
- Figure 68: Asia Critical Infrastructure Security Industry Volume (K Unit), by Vertical 2024 & 2032
- Figure 69: Asia Critical Infrastructure Security Industry Revenue Share (%), by Vertical 2024 & 2032
- Figure 70: Asia Critical Infrastructure Security Industry Volume Share (%), by Vertical 2024 & 2032
- Figure 71: Asia Critical Infrastructure Security Industry Revenue (Million), by Country 2024 & 2032
- Figure 72: Asia Critical Infrastructure Security Industry Volume (K Unit), by Country 2024 & 2032
- Figure 73: Asia Critical Infrastructure Security Industry Revenue Share (%), by Country 2024 & 2032
- Figure 74: Asia Critical Infrastructure Security Industry Volume Share (%), by Country 2024 & 2032
- Figure 75: Latin America Critical Infrastructure Security Industry Revenue (Million), by Offering 2024 & 2032
- Figure 76: Latin America Critical Infrastructure Security Industry Volume (K Unit), by Offering 2024 & 2032
- Figure 77: Latin America Critical Infrastructure Security Industry Revenue Share (%), by Offering 2024 & 2032
- Figure 78: Latin America Critical Infrastructure Security Industry Volume Share (%), by Offering 2024 & 2032
- Figure 79: Latin America Critical Infrastructure Security Industry Revenue (Million), by Services 2024 & 2032
- Figure 80: Latin America Critical Infrastructure Security Industry Volume (K Unit), by Services 2024 & 2032
- Figure 81: Latin America Critical Infrastructure Security Industry Revenue Share (%), by Services 2024 & 2032
- Figure 82: Latin America Critical Infrastructure Security Industry Volume Share (%), by Services 2024 & 2032
- Figure 83: Latin America Critical Infrastructure Security Industry Revenue (Million), by Vertical 2024 & 2032
- Figure 84: Latin America Critical Infrastructure Security Industry Volume (K Unit), by Vertical 2024 & 2032
- Figure 85: Latin America Critical Infrastructure Security Industry Revenue Share (%), by Vertical 2024 & 2032
- Figure 86: Latin America Critical Infrastructure Security Industry Volume Share (%), by Vertical 2024 & 2032
- Figure 87: Latin America Critical Infrastructure Security Industry Revenue (Million), by Country 2024 & 2032
- Figure 88: Latin America Critical Infrastructure Security Industry Volume (K Unit), by Country 2024 & 2032
- Figure 89: Latin America Critical Infrastructure Security Industry Revenue Share (%), by Country 2024 & 2032
- Figure 90: Latin America Critical Infrastructure Security Industry Volume Share (%), by Country 2024 & 2032
- Figure 91: Middle East and Africa Critical Infrastructure Security Industry Revenue (Million), by Offering 2024 & 2032
- Figure 92: Middle East and Africa Critical Infrastructure Security Industry Volume (K Unit), by Offering 2024 & 2032
- Figure 93: Middle East and Africa Critical Infrastructure Security Industry Revenue Share (%), by Offering 2024 & 2032
- Figure 94: Middle East and Africa Critical Infrastructure Security Industry Volume Share (%), by Offering 2024 & 2032
- Figure 95: Middle East and Africa Critical Infrastructure Security Industry Revenue (Million), by Services 2024 & 2032
- Figure 96: Middle East and Africa Critical Infrastructure Security Industry Volume (K Unit), by Services 2024 & 2032
- Figure 97: Middle East and Africa Critical Infrastructure Security Industry Revenue Share (%), by Services 2024 & 2032
- Figure 98: Middle East and Africa Critical Infrastructure Security Industry Volume Share (%), by Services 2024 & 2032
- Figure 99: Middle East and Africa Critical Infrastructure Security Industry Revenue (Million), by Vertical 2024 & 2032
- Figure 100: Middle East and Africa Critical Infrastructure Security Industry Volume (K Unit), by Vertical 2024 & 2032
- Figure 101: Middle East and Africa Critical Infrastructure Security Industry Revenue Share (%), by Vertical 2024 & 2032
- Figure 102: Middle East and Africa Critical Infrastructure Security Industry Volume Share (%), by Vertical 2024 & 2032
- Figure 103: Middle East and Africa Critical Infrastructure Security Industry Revenue (Million), by Country 2024 & 2032
- Figure 104: Middle East and Africa Critical Infrastructure Security Industry Volume (K Unit), by Country 2024 & 2032
- Figure 105: Middle East and Africa Critical Infrastructure Security Industry Revenue Share (%), by Country 2024 & 2032
- Figure 106: Middle East and Africa Critical Infrastructure Security Industry Volume Share (%), by Country 2024 & 2032
List of Tables
- Table 1: Global Critical Infrastructure Security Industry Revenue Million Forecast, by Region 2019 & 2032
- Table 2: Global Critical Infrastructure Security Industry Volume K Unit Forecast, by Region 2019 & 2032
- Table 3: Global Critical Infrastructure Security Industry Revenue Million Forecast, by Offering 2019 & 2032
- Table 4: Global Critical Infrastructure Security Industry Volume K Unit Forecast, by Offering 2019 & 2032
- Table 5: Global Critical Infrastructure Security Industry Revenue Million Forecast, by Services 2019 & 2032
- Table 6: Global Critical Infrastructure Security Industry Volume K Unit Forecast, by Services 2019 & 2032
- Table 7: Global Critical Infrastructure Security Industry Revenue Million Forecast, by Vertical 2019 & 2032
- Table 8: Global Critical Infrastructure Security Industry Volume K Unit Forecast, by Vertical 2019 & 2032
- Table 9: Global Critical Infrastructure Security Industry Revenue Million Forecast, by Region 2019 & 2032
- Table 10: Global Critical Infrastructure Security Industry Volume K Unit Forecast, by Region 2019 & 2032
- Table 11: Global Critical Infrastructure Security Industry Revenue Million Forecast, by Country 2019 & 2032
- Table 12: Global Critical Infrastructure Security Industry Volume K Unit Forecast, by Country 2019 & 2032
- Table 13: United States Critical Infrastructure Security Industry Revenue (Million) Forecast, by Application 2019 & 2032
- Table 14: United States Critical Infrastructure Security Industry Volume (K Unit) Forecast, by Application 2019 & 2032
- Table 15: Canada Critical Infrastructure Security Industry Revenue (Million) Forecast, by Application 2019 & 2032
- Table 16: Canada Critical Infrastructure Security Industry Volume (K Unit) Forecast, by Application 2019 & 2032
- Table 17: Mexico Critical Infrastructure Security Industry Revenue (Million) Forecast, by Application 2019 & 2032
- Table 18: Mexico Critical Infrastructure Security Industry Volume (K Unit) Forecast, by Application 2019 & 2032
- Table 19: Global Critical Infrastructure Security Industry Revenue Million Forecast, by Country 2019 & 2032
- Table 20: Global Critical Infrastructure Security Industry Volume K Unit Forecast, by Country 2019 & 2032
- Table 21: Germany Critical Infrastructure Security Industry Revenue (Million) Forecast, by Application 2019 & 2032
- Table 22: Germany Critical Infrastructure Security Industry Volume (K Unit) Forecast, by Application 2019 & 2032
- Table 23: United Kingdom Critical Infrastructure Security Industry Revenue (Million) Forecast, by Application 2019 & 2032
- Table 24: United Kingdom Critical Infrastructure Security Industry Volume (K Unit) Forecast, by Application 2019 & 2032
- Table 25: France Critical Infrastructure Security Industry Revenue (Million) Forecast, by Application 2019 & 2032
- Table 26: France Critical Infrastructure Security Industry Volume (K Unit) Forecast, by Application 2019 & 2032
- Table 27: Spain Critical Infrastructure Security Industry Revenue (Million) Forecast, by Application 2019 & 2032
- Table 28: Spain Critical Infrastructure Security Industry Volume (K Unit) Forecast, by Application 2019 & 2032
- Table 29: Italy Critical Infrastructure Security Industry Revenue (Million) Forecast, by Application 2019 & 2032
- Table 30: Italy Critical Infrastructure Security Industry Volume (K Unit) Forecast, by Application 2019 & 2032
- Table 31: Spain Critical Infrastructure Security Industry Revenue (Million) Forecast, by Application 2019 & 2032
- Table 32: Spain Critical Infrastructure Security Industry Volume (K Unit) Forecast, by Application 2019 & 2032
- Table 33: Belgium Critical Infrastructure Security Industry Revenue (Million) Forecast, by Application 2019 & 2032
- Table 34: Belgium Critical Infrastructure Security Industry Volume (K Unit) Forecast, by Application 2019 & 2032
- Table 35: Netherland Critical Infrastructure Security Industry Revenue (Million) Forecast, by Application 2019 & 2032
- Table 36: Netherland Critical Infrastructure Security Industry Volume (K Unit) Forecast, by Application 2019 & 2032
- Table 37: Nordics Critical Infrastructure Security Industry Revenue (Million) Forecast, by Application 2019 & 2032
- Table 38: Nordics Critical Infrastructure Security Industry Volume (K Unit) Forecast, by Application 2019 & 2032
- Table 39: Rest of Europe Critical Infrastructure Security Industry Revenue (Million) Forecast, by Application 2019 & 2032
- Table 40: Rest of Europe Critical Infrastructure Security Industry Volume (K Unit) Forecast, by Application 2019 & 2032
- Table 41: Global Critical Infrastructure Security Industry Revenue Million Forecast, by Country 2019 & 2032
- Table 42: Global Critical Infrastructure Security Industry Volume K Unit Forecast, by Country 2019 & 2032
- Table 43: China Critical Infrastructure Security Industry Revenue (Million) Forecast, by Application 2019 & 2032
- Table 44: China Critical Infrastructure Security Industry Volume (K Unit) Forecast, by Application 2019 & 2032
- Table 45: Japan Critical Infrastructure Security Industry Revenue (Million) Forecast, by Application 2019 & 2032
- Table 46: Japan Critical Infrastructure Security Industry Volume (K Unit) Forecast, by Application 2019 & 2032
- Table 47: India Critical Infrastructure Security Industry Revenue (Million) Forecast, by Application 2019 & 2032
- Table 48: India Critical Infrastructure Security Industry Volume (K Unit) Forecast, by Application 2019 & 2032
- Table 49: South Korea Critical Infrastructure Security Industry Revenue (Million) Forecast, by Application 2019 & 2032
- Table 50: South Korea Critical Infrastructure Security Industry Volume (K Unit) Forecast, by Application 2019 & 2032
- Table 51: Southeast Asia Critical Infrastructure Security Industry Revenue (Million) Forecast, by Application 2019 & 2032
- Table 52: Southeast Asia Critical Infrastructure Security Industry Volume (K Unit) Forecast, by Application 2019 & 2032
- Table 53: Australia Critical Infrastructure Security Industry Revenue (Million) Forecast, by Application 2019 & 2032
- Table 54: Australia Critical Infrastructure Security Industry Volume (K Unit) Forecast, by Application 2019 & 2032
- Table 55: Indonesia Critical Infrastructure Security Industry Revenue (Million) Forecast, by Application 2019 & 2032
- Table 56: Indonesia Critical Infrastructure Security Industry Volume (K Unit) Forecast, by Application 2019 & 2032
- Table 57: Phillipes Critical Infrastructure Security Industry Revenue (Million) Forecast, by Application 2019 & 2032
- Table 58: Phillipes Critical Infrastructure Security Industry Volume (K Unit) Forecast, by Application 2019 & 2032
- Table 59: Singapore Critical Infrastructure Security Industry Revenue (Million) Forecast, by Application 2019 & 2032
- Table 60: Singapore Critical Infrastructure Security Industry Volume (K Unit) Forecast, by Application 2019 & 2032
- Table 61: Thailandc Critical Infrastructure Security Industry Revenue (Million) Forecast, by Application 2019 & 2032
- Table 62: Thailandc Critical Infrastructure Security Industry Volume (K Unit) Forecast, by Application 2019 & 2032
- Table 63: Rest of Asia Pacific Critical Infrastructure Security Industry Revenue (Million) Forecast, by Application 2019 & 2032
- Table 64: Rest of Asia Pacific Critical Infrastructure Security Industry Volume (K Unit) Forecast, by Application 2019 & 2032
- Table 65: Global Critical Infrastructure Security Industry Revenue Million Forecast, by Country 2019 & 2032
- Table 66: Global Critical Infrastructure Security Industry Volume K Unit Forecast, by Country 2019 & 2032
- Table 67: Brazil Critical Infrastructure Security Industry Revenue (Million) Forecast, by Application 2019 & 2032
- Table 68: Brazil Critical Infrastructure Security Industry Volume (K Unit) Forecast, by Application 2019 & 2032
- Table 69: Argentina Critical Infrastructure Security Industry Revenue (Million) Forecast, by Application 2019 & 2032
- Table 70: Argentina Critical Infrastructure Security Industry Volume (K Unit) Forecast, by Application 2019 & 2032
- Table 71: Peru Critical Infrastructure Security Industry Revenue (Million) Forecast, by Application 2019 & 2032
- Table 72: Peru Critical Infrastructure Security Industry Volume (K Unit) Forecast, by Application 2019 & 2032
- Table 73: Chile Critical Infrastructure Security Industry Revenue (Million) Forecast, by Application 2019 & 2032
- Table 74: Chile Critical Infrastructure Security Industry Volume (K Unit) Forecast, by Application 2019 & 2032
- Table 75: Colombia Critical Infrastructure Security Industry Revenue (Million) Forecast, by Application 2019 & 2032
- Table 76: Colombia Critical Infrastructure Security Industry Volume (K Unit) Forecast, by Application 2019 & 2032
- Table 77: Ecuador Critical Infrastructure Security Industry Revenue (Million) Forecast, by Application 2019 & 2032
- Table 78: Ecuador Critical Infrastructure Security Industry Volume (K Unit) Forecast, by Application 2019 & 2032
- Table 79: Venezuela Critical Infrastructure Security Industry Revenue (Million) Forecast, by Application 2019 & 2032
- Table 80: Venezuela Critical Infrastructure Security Industry Volume (K Unit) Forecast, by Application 2019 & 2032
- Table 81: Rest of South America Critical Infrastructure Security Industry Revenue (Million) Forecast, by Application 2019 & 2032
- Table 82: Rest of South America Critical Infrastructure Security Industry Volume (K Unit) Forecast, by Application 2019 & 2032
- Table 83: Global Critical Infrastructure Security Industry Revenue Million Forecast, by Country 2019 & 2032
- Table 84: Global Critical Infrastructure Security Industry Volume K Unit Forecast, by Country 2019 & 2032
- Table 85: United States Critical Infrastructure Security Industry Revenue (Million) Forecast, by Application 2019 & 2032
- Table 86: United States Critical Infrastructure Security Industry Volume (K Unit) Forecast, by Application 2019 & 2032
- Table 87: Canada Critical Infrastructure Security Industry Revenue (Million) Forecast, by Application 2019 & 2032
- Table 88: Canada Critical Infrastructure Security Industry Volume (K Unit) Forecast, by Application 2019 & 2032
- Table 89: Mexico Critical Infrastructure Security Industry Revenue (Million) Forecast, by Application 2019 & 2032
- Table 90: Mexico Critical Infrastructure Security Industry Volume (K Unit) Forecast, by Application 2019 & 2032
- Table 91: Global Critical Infrastructure Security Industry Revenue Million Forecast, by Country 2019 & 2032
- Table 92: Global Critical Infrastructure Security Industry Volume K Unit Forecast, by Country 2019 & 2032
- Table 93: United Arab Emirates Critical Infrastructure Security Industry Revenue (Million) Forecast, by Application 2019 & 2032
- Table 94: United Arab Emirates Critical Infrastructure Security Industry Volume (K Unit) Forecast, by Application 2019 & 2032
- Table 95: Saudi Arabia Critical Infrastructure Security Industry Revenue (Million) Forecast, by Application 2019 & 2032
- Table 96: Saudi Arabia Critical Infrastructure Security Industry Volume (K Unit) Forecast, by Application 2019 & 2032
- Table 97: South Africa Critical Infrastructure Security Industry Revenue (Million) Forecast, by Application 2019 & 2032
- Table 98: South Africa Critical Infrastructure Security Industry Volume (K Unit) Forecast, by Application 2019 & 2032
- Table 99: Rest of Middle East and Africa Critical Infrastructure Security Industry Revenue (Million) Forecast, by Application 2019 & 2032
- Table 100: Rest of Middle East and Africa Critical Infrastructure Security Industry Volume (K Unit) Forecast, by Application 2019 & 2032
- Table 101: Global Critical Infrastructure Security Industry Revenue Million Forecast, by Offering 2019 & 2032
- Table 102: Global Critical Infrastructure Security Industry Volume K Unit Forecast, by Offering 2019 & 2032
- Table 103: Global Critical Infrastructure Security Industry Revenue Million Forecast, by Services 2019 & 2032
- Table 104: Global Critical Infrastructure Security Industry Volume K Unit Forecast, by Services 2019 & 2032
- Table 105: Global Critical Infrastructure Security Industry Revenue Million Forecast, by Vertical 2019 & 2032
- Table 106: Global Critical Infrastructure Security Industry Volume K Unit Forecast, by Vertical 2019 & 2032
- Table 107: Global Critical Infrastructure Security Industry Revenue Million Forecast, by Country 2019 & 2032
- Table 108: Global Critical Infrastructure Security Industry Volume K Unit Forecast, by Country 2019 & 2032
- Table 109: United States Critical Infrastructure Security Industry Revenue (Million) Forecast, by Application 2019 & 2032
- Table 110: United States Critical Infrastructure Security Industry Volume (K Unit) Forecast, by Application 2019 & 2032
- Table 111: Canada Critical Infrastructure Security Industry Revenue (Million) Forecast, by Application 2019 & 2032
- Table 112: Canada Critical Infrastructure Security Industry Volume (K Unit) Forecast, by Application 2019 & 2032
- Table 113: Global Critical Infrastructure Security Industry Revenue Million Forecast, by Offering 2019 & 2032
- Table 114: Global Critical Infrastructure Security Industry Volume K Unit Forecast, by Offering 2019 & 2032
- Table 115: Global Critical Infrastructure Security Industry Revenue Million Forecast, by Services 2019 & 2032
- Table 116: Global Critical Infrastructure Security Industry Volume K Unit Forecast, by Services 2019 & 2032
- Table 117: Global Critical Infrastructure Security Industry Revenue Million Forecast, by Vertical 2019 & 2032
- Table 118: Global Critical Infrastructure Security Industry Volume K Unit Forecast, by Vertical 2019 & 2032
- Table 119: Global Critical Infrastructure Security Industry Revenue Million Forecast, by Country 2019 & 2032
- Table 120: Global Critical Infrastructure Security Industry Volume K Unit Forecast, by Country 2019 & 2032
- Table 121: Germany Critical Infrastructure Security Industry Revenue (Million) Forecast, by Application 2019 & 2032
- Table 122: Germany Critical Infrastructure Security Industry Volume (K Unit) Forecast, by Application 2019 & 2032
- Table 123: United Kingdom Critical Infrastructure Security Industry Revenue (Million) Forecast, by Application 2019 & 2032
- Table 124: United Kingdom Critical Infrastructure Security Industry Volume (K Unit) Forecast, by Application 2019 & 2032
- Table 125: France Critical Infrastructure Security Industry Revenue (Million) Forecast, by Application 2019 & 2032
- Table 126: France Critical Infrastructure Security Industry Volume (K Unit) Forecast, by Application 2019 & 2032
- Table 127: Italy Critical Infrastructure Security Industry Revenue (Million) Forecast, by Application 2019 & 2032
- Table 128: Italy Critical Infrastructure Security Industry Volume (K Unit) Forecast, by Application 2019 & 2032
- Table 129: Global Critical Infrastructure Security Industry Revenue Million Forecast, by Offering 2019 & 2032
- Table 130: Global Critical Infrastructure Security Industry Volume K Unit Forecast, by Offering 2019 & 2032
- Table 131: Global Critical Infrastructure Security Industry Revenue Million Forecast, by Services 2019 & 2032
- Table 132: Global Critical Infrastructure Security Industry Volume K Unit Forecast, by Services 2019 & 2032
- Table 133: Global Critical Infrastructure Security Industry Revenue Million Forecast, by Vertical 2019 & 2032
- Table 134: Global Critical Infrastructure Security Industry Volume K Unit Forecast, by Vertical 2019 & 2032
- Table 135: Global Critical Infrastructure Security Industry Revenue Million Forecast, by Country 2019 & 2032
- Table 136: Global Critical Infrastructure Security Industry Volume K Unit Forecast, by Country 2019 & 2032
- Table 137: China Critical Infrastructure Security Industry Revenue (Million) Forecast, by Application 2019 & 2032
- Table 138: China Critical Infrastructure Security Industry Volume (K Unit) Forecast, by Application 2019 & 2032
- Table 139: Japan Critical Infrastructure Security Industry Revenue (Million) Forecast, by Application 2019 & 2032
- Table 140: Japan Critical Infrastructure Security Industry Volume (K Unit) Forecast, by Application 2019 & 2032
- Table 141: India Critical Infrastructure Security Industry Revenue (Million) Forecast, by Application 2019 & 2032
- Table 142: India Critical Infrastructure Security Industry Volume (K Unit) Forecast, by Application 2019 & 2032
- Table 143: Global Critical Infrastructure Security Industry Revenue Million Forecast, by Offering 2019 & 2032
- Table 144: Global Critical Infrastructure Security Industry Volume K Unit Forecast, by Offering 2019 & 2032
- Table 145: Global Critical Infrastructure Security Industry Revenue Million Forecast, by Services 2019 & 2032
- Table 146: Global Critical Infrastructure Security Industry Volume K Unit Forecast, by Services 2019 & 2032
- Table 147: Global Critical Infrastructure Security Industry Revenue Million Forecast, by Vertical 2019 & 2032
- Table 148: Global Critical Infrastructure Security Industry Volume K Unit Forecast, by Vertical 2019 & 2032
- Table 149: Global Critical Infrastructure Security Industry Revenue Million Forecast, by Country 2019 & 2032
- Table 150: Global Critical Infrastructure Security Industry Volume K Unit Forecast, by Country 2019 & 2032
- Table 151: Brazil Critical Infrastructure Security Industry Revenue (Million) Forecast, by Application 2019 & 2032
- Table 152: Brazil Critical Infrastructure Security Industry Volume (K Unit) Forecast, by Application 2019 & 2032
- Table 153: Argentina Critical Infrastructure Security Industry Revenue (Million) Forecast, by Application 2019 & 2032
- Table 154: Argentina Critical Infrastructure Security Industry Volume (K Unit) Forecast, by Application 2019 & 2032
- Table 155: Mexico Critical Infrastructure Security Industry Revenue (Million) Forecast, by Application 2019 & 2032
- Table 156: Mexico Critical Infrastructure Security Industry Volume (K Unit) Forecast, by Application 2019 & 2032
- Table 157: Global Critical Infrastructure Security Industry Revenue Million Forecast, by Offering 2019 & 2032
- Table 158: Global Critical Infrastructure Security Industry Volume K Unit Forecast, by Offering 2019 & 2032
- Table 159: Global Critical Infrastructure Security Industry Revenue Million Forecast, by Services 2019 & 2032
- Table 160: Global Critical Infrastructure Security Industry Volume K Unit Forecast, by Services 2019 & 2032
- Table 161: Global Critical Infrastructure Security Industry Revenue Million Forecast, by Vertical 2019 & 2032
- Table 162: Global Critical Infrastructure Security Industry Volume K Unit Forecast, by Vertical 2019 & 2032
- Table 163: Global Critical Infrastructure Security Industry Revenue Million Forecast, by Country 2019 & 2032
- Table 164: Global Critical Infrastructure Security Industry Volume K Unit Forecast, by Country 2019 & 2032
- Table 165: United Arab Emirates Critical Infrastructure Security Industry Revenue (Million) Forecast, by Application 2019 & 2032
- Table 166: United Arab Emirates Critical Infrastructure Security Industry Volume (K Unit) Forecast, by Application 2019 & 2032
- Table 167: Saudi Arabia Critical Infrastructure Security Industry Revenue (Million) Forecast, by Application 2019 & 2032
- Table 168: Saudi Arabia Critical Infrastructure Security Industry Volume (K Unit) Forecast, by Application 2019 & 2032
- Table 169: South Africa Critical Infrastructure Security Industry Revenue (Million) Forecast, by Application 2019 & 2032
- Table 170: South Africa Critical Infrastructure Security Industry Volume (K Unit) Forecast, by Application 2019 & 2032
- Table 171: Turkey Critical Infrastructure Security Industry Revenue (Million) Forecast, by Application 2019 & 2032
- Table 172: Turkey Critical Infrastructure Security Industry Volume (K Unit) Forecast, by Application 2019 & 2032
Frequently Asked Questions
1. What is the projected Compound Annual Growth Rate (CAGR) of the Critical Infrastructure Security Industry?
The projected CAGR is approximately 3.92%.
2. Which companies are prominent players in the Critical Infrastructure Security Industry?
Key companies in the market include Honeywell International Inc, General Dynamics Corporation, Lockheed Martin Corporation, Airbus SE, Ericsson A, Kaspersky Lab Inc, Hexagon AB, BAE Systems PLC, Northrop Grumman Corp, Waterfall Security Solutions, McAfee Corp, General Electric Company.
3. What are the main segments of the Critical Infrastructure Security Industry?
The market segments include Offering, Services, Vertical.
4. Can you provide details about the market size?
The market size is estimated to be USD 148.5 Million as of 2022.
5. What are some drivers contributing to market growth?
Enormous Investments in Smart Grid Technology; Physical Threats. Cyber Threats. and Insider Attacks; Joint Functioning of Cloud Computing and Critical Infrastructure Protection; Political Pressures for Better Regulations and Implementations.
6. What are the notable trends driving market growth?
Maintenance and Support Services to Witness Major Growth.
7. Are there any restraints impacting market growth?
Poor Understanding of Industrial Control Systems; Lack of Interoperability Between Products.
8. Can you provide examples of recent developments in the market?
October 2023 - GHD Digital announced the launch of its Cyber Critical Infrastructure and Risk Centre of Excellence (CoE), designed to protect organizations, their critical systems, and sensitive information from the growing threat of cyber-attacks.
9. What pricing options are available for accessing the report?
Pricing options include single-user, multi-user, and enterprise licenses priced at USD 4750, USD 5250, and USD 8750 respectively.
10. Is the market size provided in terms of value or volume?
The market size is provided in terms of value, measured in Million and volume, measured in K Unit.
11. Are there any specific market keywords associated with the report?
Yes, the market keyword associated with the report is "Critical Infrastructure Security Industry," which aids in identifying and referencing the specific market segment covered.
12. How do I determine which pricing option suits my needs best?
The pricing options vary based on user requirements and access needs. Individual users may opt for single-user licenses, while businesses requiring broader access may choose multi-user or enterprise licenses for cost-effective access to the report.
13. Are there any additional resources or data provided in the Critical Infrastructure Security Industry report?
While the report offers comprehensive insights, it's advisable to review the specific contents or supplementary materials provided to ascertain if additional resources or data are available.
14. How can I stay updated on further developments or reports in the Critical Infrastructure Security Industry?
To stay informed about further developments, trends, and reports in the Critical Infrastructure Security Industry, consider subscribing to industry newsletters, following relevant companies and organizations, or regularly checking reputable industry news sources and publications.
Methodology
Step 1 - Identification of Relevant Samples Size from Population Database


Step 2 - Approaches for Defining Global Market Size (Value, Volume* & Price*)

Note*: In applicable scenarios
Step 3 - Data Sources
Primary Research
- Web Analytics
- Survey Reports
- Research Institute
- Latest Research Reports
- Opinion Leaders
Secondary Research
- Annual Reports
- White Paper
- Latest Press Release
- Industry Association
- Paid Database
- Investor Presentations

Step 4 - Data Triangulation
Involves using different sources of information in order to increase the validity of a study
These sources are likely to be stakeholders in a program - participants, other researchers, program staff, other community members, and so on.
Then we put all data in single framework & apply various statistical tools to find out the dynamic on the market.
During the analysis stage, feedback from the stakeholder groups would be compared to determine areas of agreement as well as areas of divergence


