
Key Insights
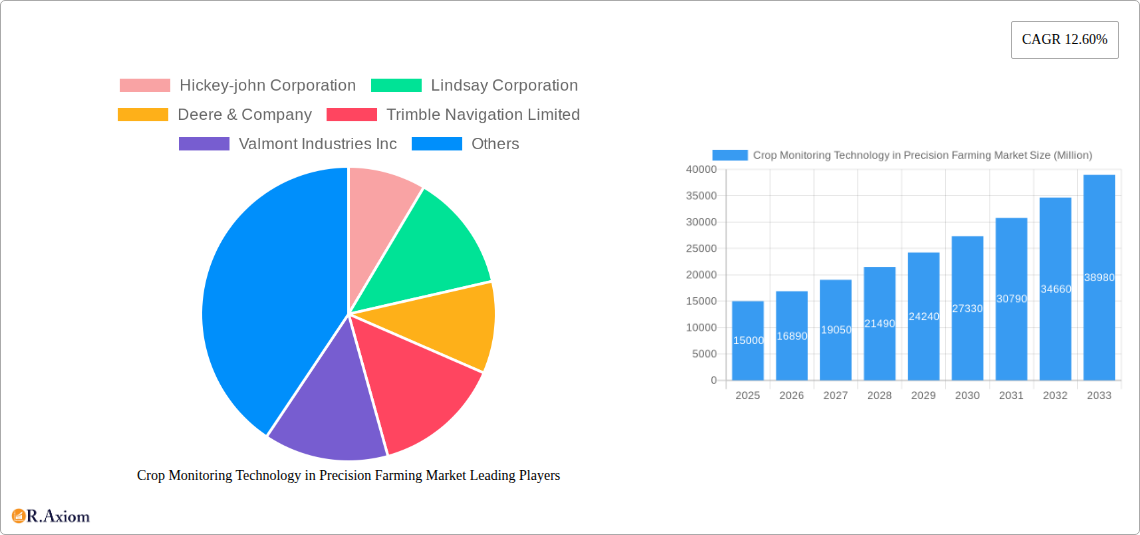
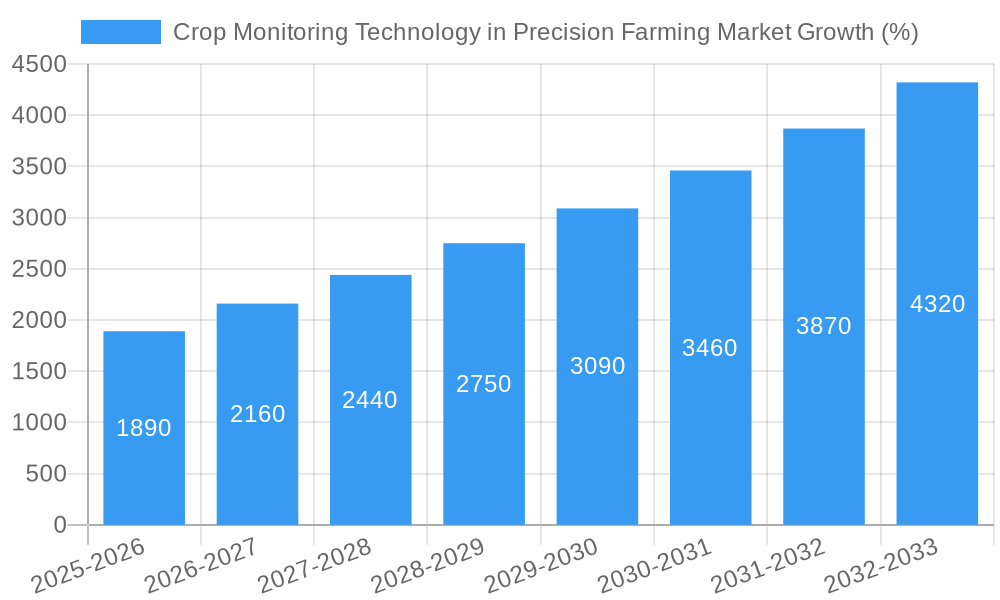
The Crop Monitoring Technology in Precision Farming market is experiencing robust growth, driven by the increasing need for efficient resource management and enhanced crop yields in agriculture. With a Compound Annual Growth Rate (CAGR) of 12.60% between 2019 and 2024, the market is projected to reach a substantial value by 2033. This expansion is fueled by several key factors. Firstly, technological advancements in areas like remote sensing, guidance systems, and variable rate technology are providing farmers with more precise and actionable data regarding crop health, soil conditions, and environmental factors. Secondly, the rising adoption of precision farming techniques, aiming to optimize resource utilization and minimize waste, is a major driver. The market segmentation reveals a strong demand across various solutions including hardware, software, and services, with hardware components representing a significant portion of market revenue. Applications such as field mapping, soil monitoring, and yield monitoring are experiencing high growth rates. While factors like high initial investment costs for technology adoption and the need for skilled labor may pose some restraints, the overall market outlook remains optimistic, with significant opportunities for growth across all geographical regions. North America and Europe are currently leading the market in terms of adoption and technological advancements, while the Asia-Pacific region is anticipated to witness significant expansion in the coming years due to increasing agricultural activity and government support for precision farming initiatives.
The competitive landscape is characterized by a mix of established agricultural machinery manufacturers, technology providers, and chemical companies. Key players are focusing on strategic collaborations, mergers and acquisitions, and product innovation to strengthen their market positions. The integration of Artificial Intelligence (AI) and machine learning capabilities into crop monitoring solutions is further enhancing market potential, leading to more sophisticated predictive analytics and automated decision-making capabilities for farmers. This trend towards automation and data-driven insights will be instrumental in driving further growth and shaping the future of the crop monitoring technology market. Future growth will heavily depend on the continued advancement of sensor technologies, the availability of reliable high-speed internet infrastructure in rural areas, and the increased affordability of precision farming technologies for smallholder farmers.
This detailed report provides a comprehensive analysis of the Crop Monitoring Technology in Precision Farming market, covering market size, segmentation, growth drivers, challenges, and key players. The study period spans from 2019 to 2033, with 2025 as the base and estimated year, and a forecast period of 2025-2033. The historical period analyzed is 2019-2024. This report is crucial for stakeholders seeking actionable insights into this rapidly evolving market.
Crop Monitoring Technology in Precision Farming Market Concentration & Innovation
The Crop Monitoring Technology in Precision Farming market exhibits a moderately concentrated landscape, with several major players holding significant market share. While precise market share data for each company is proprietary, Deere & Company, Trimble Navigation Limited, and AGCO Corporation are estimated to command a considerable portion, collectively accounting for approximately xx% of the market in 2025. Other key players like Lindsay Corporation, Valmont Industries Inc, BASF SE, and Raven Industries Inc contribute significantly to the overall market volume.
Innovation is a key driver, fueled by advancements in sensor technology, AI, and data analytics. The market witnesses continuous development of precision agriculture solutions, including improved remote sensing capabilities, sophisticated data processing algorithms, and user-friendly software interfaces. Regulatory frameworks, such as those promoting sustainable agriculture practices, further influence technological innovation. Product substitutes, primarily traditional farming methods, face increasing pressure due to the superior efficiency and profitability offered by crop monitoring technologies. End-user trends show a clear preference towards data-driven decision-making and automation, driving demand for advanced solutions. The market has witnessed several M&A activities in recent years, with deal values ranging from xx Million to xx Million, reflecting the strategic importance of consolidation and technology acquisition.
- Key Market Concentration Metrics (2025):
- Top 3 players' combined market share: xx%
- Average M&A deal value: xx Million
- Number of significant M&A deals (2019-2024): xx
Crop Monitoring Technology in Precision Farming Market Industry Trends & Insights
The global Crop Monitoring Technology in Precision Farming market is experiencing robust growth, with a projected CAGR of xx% during the forecast period (2025-2033). This growth is primarily driven by factors like increasing adoption of precision farming techniques, rising demand for higher crop yields, and growing awareness of the environmental benefits of optimized resource utilization. Technological advancements, such as the development of high-resolution sensors, advanced analytics platforms, and the integration of IoT devices, significantly contribute to market expansion. The market penetration of crop monitoring technologies is increasing steadily, particularly in developed regions with advanced agricultural infrastructure. Consumer preferences are shifting towards technology-based solutions that provide real-time insights, enhancing decision-making accuracy and operational efficiency. Intense competition among established players and new entrants fuels innovation and drives down prices, making these technologies more accessible to a wider range of farmers.
Dominant Markets & Segments in Crop Monitoring Technology in Precision Farming Market
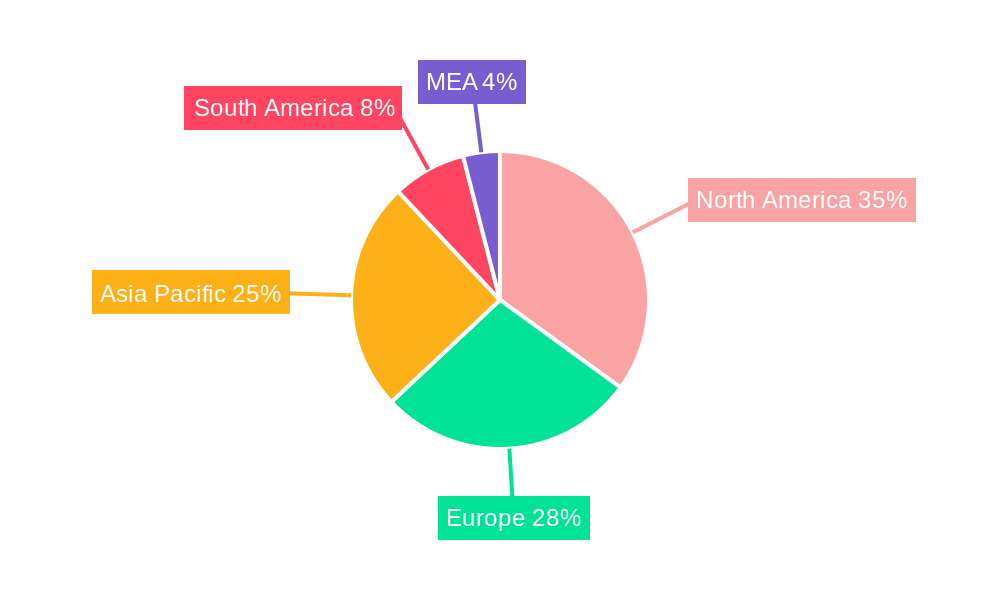
The North American region currently dominates the Crop Monitoring Technology in Precision Farming market, followed by Europe and Asia-Pacific. Within these regions, specific countries such as the United States, Canada, Germany, France, and China are key contributors.
Dominant Segments:
- By Technology: Remote Sensing is the largest segment due to its ability to provide comprehensive field data. Variable Rate Technology is experiencing rapid growth due to its potential to optimize input use.
- By Solution: Hardware constitutes the largest share, but the Software and Service segments are growing at a faster rate due to the increasing demand for data analysis and insights.
- By Application: Yield Monitoring holds a significant market share, while Crop Scouting and Variable Rate Application are exhibiting substantial growth potential.
Key Drivers of Regional Dominance:
- North America: High agricultural productivity, strong technological infrastructure, and early adoption of precision farming techniques.
- Europe: Government initiatives supporting sustainable agriculture and a focus on precision farming technologies.
- Asia-Pacific: Growing agricultural sector, rising disposable incomes, and increasing investments in agricultural technology.
Crop Monitoring Technology in Precision Farming Market Product Developments
Recent product innovations focus on improved sensor accuracy, enhanced data analytics capabilities, and seamless integration with existing farm management systems. New applications are emerging in areas like disease detection and weed identification, leveraging AI and machine learning. These advancements provide farmers with more precise and actionable information, leading to significant improvements in operational efficiency and profitability. The competitive advantage hinges on the accuracy, reliability, and user-friendliness of the technology, coupled with robust data analytics capabilities and strong customer support.
Report Scope & Segmentation Analysis
This report segments the Crop Monitoring Technology in Precision Farming market across various parameters:
By Technology: Guidance System, Remote Sensing, Variable Rate Technology. Each technology segment exhibits unique growth projections and competitive dynamics. Remote sensing is expected to maintain its leading position due to continuous advancements and wide-ranging applications.
By Solution: Hardware, Software, Service. The software and service segments are demonstrating faster growth, propelled by increasing demand for data-driven decision-making tools.
By Application: Field Mapping, Soil Monitoring, Crop Scouting, Yield Monitoring, Variable Rate Application, Other Applications. The yield monitoring segment currently holds the largest share, but variable rate application is anticipated to experience significant growth, driven by its ability to optimize input usage.
Each segment’s market size, growth projections, and competitive landscape are thoroughly analyzed within the full report.
Key Drivers of Crop Monitoring Technology in Precision Farming Market Growth
Several factors drive the growth of this market: Technological advancements in sensors, AI, and data analytics improve the accuracy and efficiency of crop monitoring. Government initiatives supporting sustainable agriculture and precision farming practices create favorable market conditions. Economic factors, such as the increasing demand for food and the need to optimize agricultural resource utilization, significantly influence market growth. The rising adoption of precision farming techniques worldwide also fuels market expansion.
Challenges in the Crop Monitoring Technology in Precision Farming Market Sector
The Crop Monitoring Technology in Precision Farming market faces several challenges. High initial investment costs for technology adoption can hinder widespread penetration, especially among smallholder farmers. The complexity of data integration and analysis can pose a barrier to some users. Supply chain disruptions can impact the availability and cost of components. Intense competition among existing and new market players leads to price pressures. Regulatory hurdles and data privacy concerns also present ongoing challenges.
Emerging Opportunities in Crop Monitoring Technology in Precision Farming Market
Emerging opportunities exist in the integration of drone technology for high-resolution imagery, the use of AI and machine learning for predictive modeling, and the development of specialized solutions for specific crops or regions. Expanding into new geographic markets, particularly in developing countries with growing agricultural sectors, presents significant growth potential. The development of user-friendly software interfaces and comprehensive training programs can further boost market adoption.
Leading Players in the Crop Monitoring Technology in Precision Farming Market Market
- Hickey-john Corporation
- Lindsay Corporation
- Deere & Company
- Trimble Navigation Limited
- Valmont Industries Inc
- AGCO Corporation
- BASF SE
- Land O'lakes Inc
- Topcon Precision Agriculture
- Teejet Technologies Illinois LLC
- E I Du Pont De Nemours And Company (Dupont)
- AG Junction Inc
- Monsanto Company
- Yara International ASA
- Raven Industries Inc
Key Developments in Crop Monitoring Technology in Precision Farming Market Industry
- June 2023: Deere & Company launched a new precision farming platform integrating various sensor technologies and AI-powered analytics.
- October 2022: Trimble Navigation Limited acquired a leading provider of drone-based agricultural solutions.
- March 2021: BASF SE announced a strategic partnership to develop advanced sensor technology for crop monitoring. (Further key developments will be detailed in the full report)
Strategic Outlook for Crop Monitoring Technology in Precision Farming Market Market
The Crop Monitoring Technology in Precision Farming market is poised for significant growth, driven by continuous technological innovation, increasing adoption of precision farming techniques, and favorable regulatory support. Future opportunities lie in the expansion of data analytics capabilities, the integration of IoT technologies, and the development of user-friendly solutions tailored to the needs of diverse farming communities. The market is expected to continue its upward trajectory, with significant potential for expansion in both developed and developing countries.
Crop Monitoring Technology in Precision Farming Market Segmentation
-
1. Technology
- 1.1. Guidance System
- 1.2. Remote Sensing
- 1.3. Variable Rate Technology
-
2. Solution
- 2.1. Hardware
- 2.2. Software
- 2.3. Service
-
3. Application
- 3.1. Field Mapping
- 3.2. Soil Monitoring
- 3.3. Crop Scouting
- 3.4. Yield Monitoring
- 3.5. Variable Rate Application
- 3.6. Other Applications
Crop Monitoring Technology in Precision Farming Market Segmentation By Geography
- 1. North America
- 2. Europe
- 3. Asia Pacific
- 4. Latin America
- 5. Middle East
Crop Monitoring Technology in Precision Farming Market REPORT HIGHLIGHTS
| Aspects | Details |
|---|---|
| Study Period | 2019-2033 |
| Base Year | 2024 |
| Estimated Year | 2025 |
| Forecast Period | 2025-2033 |
| Historical Period | 2019-2024 |
| Growth Rate | CAGR of 12.60% from 2019-2033 |
| Segmentation |
|
Table of Contents
- 1. Introduction
- 1.1. Research Scope
- 1.2. Market Segmentation
- 1.3. Research Methodology
- 1.4. Definitions and Assumptions
- 2. Executive Summary
- 2.1. Introduction
- 3. Market Dynamics
- 3.1. Introduction
- 3.2. Market Drivers
- 3.2.1. ; Rising Demand for Food Products and Improved Crop Yield; Convergence of IT with Agriculture; Government Support and Decline in Price of Sensors Aid Adoption
- 3.3. Market Restrains
- 3.3.1. ; Relatively Low Awareness and Lack af Specialists Remain a Concern; High Initial Costs and Sluggish Penetration of Technology
- 3.4. Market Trends
- 3.4.1. GPS and GNSS Adoption to Drive the Market Growth
- 4. Market Factor Analysis
- 4.1. Porters Five Forces
- 4.2. Supply/Value Chain
- 4.3. PESTEL analysis
- 4.4. Market Entropy
- 4.5. Patent/Trademark Analysis
- 5. Global Crop Monitoring Technology in Precision Farming Market Analysis, Insights and Forecast, 2019-2031
- 5.1. Market Analysis, Insights and Forecast - by Technology
- 5.1.1. Guidance System
- 5.1.2. Remote Sensing
- 5.1.3. Variable Rate Technology
- 5.2. Market Analysis, Insights and Forecast - by Solution
- 5.2.1. Hardware
- 5.2.2. Software
- 5.2.3. Service
- 5.3. Market Analysis, Insights and Forecast - by Application
- 5.3.1. Field Mapping
- 5.3.2. Soil Monitoring
- 5.3.3. Crop Scouting
- 5.3.4. Yield Monitoring
- 5.3.5. Variable Rate Application
- 5.3.6. Other Applications
- 5.4. Market Analysis, Insights and Forecast - by Region
- 5.4.1. North America
- 5.4.2. Europe
- 5.4.3. Asia Pacific
- 5.4.4. Latin America
- 5.4.5. Middle East
- 5.1. Market Analysis, Insights and Forecast - by Technology
- 6. North America Crop Monitoring Technology in Precision Farming Market Analysis, Insights and Forecast, 2019-2031
- 6.1. Market Analysis, Insights and Forecast - by Technology
- 6.1.1. Guidance System
- 6.1.2. Remote Sensing
- 6.1.3. Variable Rate Technology
- 6.2. Market Analysis, Insights and Forecast - by Solution
- 6.2.1. Hardware
- 6.2.2. Software
- 6.2.3. Service
- 6.3. Market Analysis, Insights and Forecast - by Application
- 6.3.1. Field Mapping
- 6.3.2. Soil Monitoring
- 6.3.3. Crop Scouting
- 6.3.4. Yield Monitoring
- 6.3.5. Variable Rate Application
- 6.3.6. Other Applications
- 6.1. Market Analysis, Insights and Forecast - by Technology
- 7. Europe Crop Monitoring Technology in Precision Farming Market Analysis, Insights and Forecast, 2019-2031
- 7.1. Market Analysis, Insights and Forecast - by Technology
- 7.1.1. Guidance System
- 7.1.2. Remote Sensing
- 7.1.3. Variable Rate Technology
- 7.2. Market Analysis, Insights and Forecast - by Solution
- 7.2.1. Hardware
- 7.2.2. Software
- 7.2.3. Service
- 7.3. Market Analysis, Insights and Forecast - by Application
- 7.3.1. Field Mapping
- 7.3.2. Soil Monitoring
- 7.3.3. Crop Scouting
- 7.3.4. Yield Monitoring
- 7.3.5. Variable Rate Application
- 7.3.6. Other Applications
- 7.1. Market Analysis, Insights and Forecast - by Technology
- 8. Asia Pacific Crop Monitoring Technology in Precision Farming Market Analysis, Insights and Forecast, 2019-2031
- 8.1. Market Analysis, Insights and Forecast - by Technology
- 8.1.1. Guidance System
- 8.1.2. Remote Sensing
- 8.1.3. Variable Rate Technology
- 8.2. Market Analysis, Insights and Forecast - by Solution
- 8.2.1. Hardware
- 8.2.2. Software
- 8.2.3. Service
- 8.3. Market Analysis, Insights and Forecast - by Application
- 8.3.1. Field Mapping
- 8.3.2. Soil Monitoring
- 8.3.3. Crop Scouting
- 8.3.4. Yield Monitoring
- 8.3.5. Variable Rate Application
- 8.3.6. Other Applications
- 8.1. Market Analysis, Insights and Forecast - by Technology
- 9. Latin America Crop Monitoring Technology in Precision Farming Market Analysis, Insights and Forecast, 2019-2031
- 9.1. Market Analysis, Insights and Forecast - by Technology
- 9.1.1. Guidance System
- 9.1.2. Remote Sensing
- 9.1.3. Variable Rate Technology
- 9.2. Market Analysis, Insights and Forecast - by Solution
- 9.2.1. Hardware
- 9.2.2. Software
- 9.2.3. Service
- 9.3. Market Analysis, Insights and Forecast - by Application
- 9.3.1. Field Mapping
- 9.3.2. Soil Monitoring
- 9.3.3. Crop Scouting
- 9.3.4. Yield Monitoring
- 9.3.5. Variable Rate Application
- 9.3.6. Other Applications
- 9.1. Market Analysis, Insights and Forecast - by Technology
- 10. Middle East Crop Monitoring Technology in Precision Farming Market Analysis, Insights and Forecast, 2019-2031
- 10.1. Market Analysis, Insights and Forecast - by Technology
- 10.1.1. Guidance System
- 10.1.2. Remote Sensing
- 10.1.3. Variable Rate Technology
- 10.2. Market Analysis, Insights and Forecast - by Solution
- 10.2.1. Hardware
- 10.2.2. Software
- 10.2.3. Service
- 10.3. Market Analysis, Insights and Forecast - by Application
- 10.3.1. Field Mapping
- 10.3.2. Soil Monitoring
- 10.3.3. Crop Scouting
- 10.3.4. Yield Monitoring
- 10.3.5. Variable Rate Application
- 10.3.6. Other Applications
- 10.1. Market Analysis, Insights and Forecast - by Technology
- 11. North America Crop Monitoring Technology in Precision Farming Market Analysis, Insights and Forecast, 2019-2031
- 11.1. Market Analysis, Insights and Forecast - By Country/Sub-region
- 11.1.1 United States
- 11.1.2 Canada
- 11.1.3 Mexico
- 12. Europe Crop Monitoring Technology in Precision Farming Market Analysis, Insights and Forecast, 2019-2031
- 12.1. Market Analysis, Insights and Forecast - By Country/Sub-region
- 12.1.1 Germany
- 12.1.2 United Kingdom
- 12.1.3 France
- 12.1.4 Spain
- 12.1.5 Italy
- 12.1.6 Spain
- 12.1.7 Belgium
- 12.1.8 Netherland
- 12.1.9 Nordics
- 12.1.10 Rest of Europe
- 13. Asia Pacific Crop Monitoring Technology in Precision Farming Market Analysis, Insights and Forecast, 2019-2031
- 13.1. Market Analysis, Insights and Forecast - By Country/Sub-region
- 13.1.1 China
- 13.1.2 Japan
- 13.1.3 India
- 13.1.4 South Korea
- 13.1.5 Southeast Asia
- 13.1.6 Australia
- 13.1.7 Indonesia
- 13.1.8 Phillipes
- 13.1.9 Singapore
- 13.1.10 Thailandc
- 13.1.11 Rest of Asia Pacific
- 14. South America Crop Monitoring Technology in Precision Farming Market Analysis, Insights and Forecast, 2019-2031
- 14.1. Market Analysis, Insights and Forecast - By Country/Sub-region
- 14.1.1 Brazil
- 14.1.2 Argentina
- 14.1.3 Peru
- 14.1.4 Chile
- 14.1.5 Colombia
- 14.1.6 Ecuador
- 14.1.7 Venezuela
- 14.1.8 Rest of South America
- 15. North America Crop Monitoring Technology in Precision Farming Market Analysis, Insights and Forecast, 2019-2031
- 15.1. Market Analysis, Insights and Forecast - By Country/Sub-region
- 15.1.1 United States
- 15.1.2 Canada
- 15.1.3 Mexico
- 16. MEA Crop Monitoring Technology in Precision Farming Market Analysis, Insights and Forecast, 2019-2031
- 16.1. Market Analysis, Insights and Forecast - By Country/Sub-region
- 16.1.1 United Arab Emirates
- 16.1.2 Saudi Arabia
- 16.1.3 South Africa
- 16.1.4 Rest of Middle East and Africa
- 17. Competitive Analysis
- 17.1. Global Market Share Analysis 2024
- 17.2. Company Profiles
- 17.2.1 Hickey-john Corporation
- 17.2.1.1. Overview
- 17.2.1.2. Products
- 17.2.1.3. SWOT Analysis
- 17.2.1.4. Recent Developments
- 17.2.1.5. Financials (Based on Availability)
- 17.2.2 Lindsay Corporation
- 17.2.2.1. Overview
- 17.2.2.2. Products
- 17.2.2.3. SWOT Analysis
- 17.2.2.4. Recent Developments
- 17.2.2.5. Financials (Based on Availability)
- 17.2.3 Deere & Company
- 17.2.3.1. Overview
- 17.2.3.2. Products
- 17.2.3.3. SWOT Analysis
- 17.2.3.4. Recent Developments
- 17.2.3.5. Financials (Based on Availability)
- 17.2.4 Trimble Navigation Limited
- 17.2.4.1. Overview
- 17.2.4.2. Products
- 17.2.4.3. SWOT Analysis
- 17.2.4.4. Recent Developments
- 17.2.4.5. Financials (Based on Availability)
- 17.2.5 Valmont Industries Inc
- 17.2.5.1. Overview
- 17.2.5.2. Products
- 17.2.5.3. SWOT Analysis
- 17.2.5.4. Recent Developments
- 17.2.5.5. Financials (Based on Availability)
- 17.2.6 AGCO Corporation
- 17.2.6.1. Overview
- 17.2.6.2. Products
- 17.2.6.3. SWOT Analysis
- 17.2.6.4. Recent Developments
- 17.2.6.5. Financials (Based on Availability)
- 17.2.7 BASF SE
- 17.2.7.1. Overview
- 17.2.7.2. Products
- 17.2.7.3. SWOT Analysis
- 17.2.7.4. Recent Developments
- 17.2.7.5. Financials (Based on Availability)
- 17.2.8 Land O'lakes Inc
- 17.2.8.1. Overview
- 17.2.8.2. Products
- 17.2.8.3. SWOT Analysis
- 17.2.8.4. Recent Developments
- 17.2.8.5. Financials (Based on Availability)
- 17.2.9 Topcon Precision Agriculture
- 17.2.9.1. Overview
- 17.2.9.2. Products
- 17.2.9.3. SWOT Analysis
- 17.2.9.4. Recent Developments
- 17.2.9.5. Financials (Based on Availability)
- 17.2.10 Teejet Technologies Illinois LLC
- 17.2.10.1. Overview
- 17.2.10.2. Products
- 17.2.10.3. SWOT Analysis
- 17.2.10.4. Recent Developments
- 17.2.10.5. Financials (Based on Availability)
- 17.2.11 E I Du Pont De Nemours And Company (Dupont)
- 17.2.11.1. Overview
- 17.2.11.2. Products
- 17.2.11.3. SWOT Analysis
- 17.2.11.4. Recent Developments
- 17.2.11.5. Financials (Based on Availability)
- 17.2.12 AG Junction Inc
- 17.2.12.1. Overview
- 17.2.12.2. Products
- 17.2.12.3. SWOT Analysis
- 17.2.12.4. Recent Developments
- 17.2.12.5. Financials (Based on Availability)
- 17.2.13 Monsanto Company
- 17.2.13.1. Overview
- 17.2.13.2. Products
- 17.2.13.3. SWOT Analysis
- 17.2.13.4. Recent Developments
- 17.2.13.5. Financials (Based on Availability)
- 17.2.14 Yara International ASA
- 17.2.14.1. Overview
- 17.2.14.2. Products
- 17.2.14.3. SWOT Analysis
- 17.2.14.4. Recent Developments
- 17.2.14.5. Financials (Based on Availability)
- 17.2.15 Raven Industries Inc
- 17.2.15.1. Overview
- 17.2.15.2. Products
- 17.2.15.3. SWOT Analysis
- 17.2.15.4. Recent Developments
- 17.2.15.5. Financials (Based on Availability)
- 17.2.1 Hickey-john Corporation
List of Figures
- Figure 1: Global Crop Monitoring Technology in Precision Farming Market Revenue Breakdown (Million, %) by Region 2024 & 2032
- Figure 2: Global Crop Monitoring Technology in Precision Farming Market Volume Breakdown (K Unit, %) by Region 2024 & 2032
- Figure 3: North America Crop Monitoring Technology in Precision Farming Market Revenue (Million), by Country 2024 & 2032
- Figure 4: North America Crop Monitoring Technology in Precision Farming Market Volume (K Unit), by Country 2024 & 2032
- Figure 5: North America Crop Monitoring Technology in Precision Farming Market Revenue Share (%), by Country 2024 & 2032
- Figure 6: North America Crop Monitoring Technology in Precision Farming Market Volume Share (%), by Country 2024 & 2032
- Figure 7: Europe Crop Monitoring Technology in Precision Farming Market Revenue (Million), by Country 2024 & 2032
- Figure 8: Europe Crop Monitoring Technology in Precision Farming Market Volume (K Unit), by Country 2024 & 2032
- Figure 9: Europe Crop Monitoring Technology in Precision Farming Market Revenue Share (%), by Country 2024 & 2032
- Figure 10: Europe Crop Monitoring Technology in Precision Farming Market Volume Share (%), by Country 2024 & 2032
- Figure 11: Asia Pacific Crop Monitoring Technology in Precision Farming Market Revenue (Million), by Country 2024 & 2032
- Figure 12: Asia Pacific Crop Monitoring Technology in Precision Farming Market Volume (K Unit), by Country 2024 & 2032
- Figure 13: Asia Pacific Crop Monitoring Technology in Precision Farming Market Revenue Share (%), by Country 2024 & 2032
- Figure 14: Asia Pacific Crop Monitoring Technology in Precision Farming Market Volume Share (%), by Country 2024 & 2032
- Figure 15: South America Crop Monitoring Technology in Precision Farming Market Revenue (Million), by Country 2024 & 2032
- Figure 16: South America Crop Monitoring Technology in Precision Farming Market Volume (K Unit), by Country 2024 & 2032
- Figure 17: South America Crop Monitoring Technology in Precision Farming Market Revenue Share (%), by Country 2024 & 2032
- Figure 18: South America Crop Monitoring Technology in Precision Farming Market Volume Share (%), by Country 2024 & 2032
- Figure 19: North America Crop Monitoring Technology in Precision Farming Market Revenue (Million), by Country 2024 & 2032
- Figure 20: North America Crop Monitoring Technology in Precision Farming Market Volume (K Unit), by Country 2024 & 2032
- Figure 21: North America Crop Monitoring Technology in Precision Farming Market Revenue Share (%), by Country 2024 & 2032
- Figure 22: North America Crop Monitoring Technology in Precision Farming Market Volume Share (%), by Country 2024 & 2032
- Figure 23: MEA Crop Monitoring Technology in Precision Farming Market Revenue (Million), by Country 2024 & 2032
- Figure 24: MEA Crop Monitoring Technology in Precision Farming Market Volume (K Unit), by Country 2024 & 2032
- Figure 25: MEA Crop Monitoring Technology in Precision Farming Market Revenue Share (%), by Country 2024 & 2032
- Figure 26: MEA Crop Monitoring Technology in Precision Farming Market Volume Share (%), by Country 2024 & 2032
- Figure 27: North America Crop Monitoring Technology in Precision Farming Market Revenue (Million), by Technology 2024 & 2032
- Figure 28: North America Crop Monitoring Technology in Precision Farming Market Volume (K Unit), by Technology 2024 & 2032
- Figure 29: North America Crop Monitoring Technology in Precision Farming Market Revenue Share (%), by Technology 2024 & 2032
- Figure 30: North America Crop Monitoring Technology in Precision Farming Market Volume Share (%), by Technology 2024 & 2032
- Figure 31: North America Crop Monitoring Technology in Precision Farming Market Revenue (Million), by Solution 2024 & 2032
- Figure 32: North America Crop Monitoring Technology in Precision Farming Market Volume (K Unit), by Solution 2024 & 2032
- Figure 33: North America Crop Monitoring Technology in Precision Farming Market Revenue Share (%), by Solution 2024 & 2032
- Figure 34: North America Crop Monitoring Technology in Precision Farming Market Volume Share (%), by Solution 2024 & 2032
- Figure 35: North America Crop Monitoring Technology in Precision Farming Market Revenue (Million), by Application 2024 & 2032
- Figure 36: North America Crop Monitoring Technology in Precision Farming Market Volume (K Unit), by Application 2024 & 2032
- Figure 37: North America Crop Monitoring Technology in Precision Farming Market Revenue Share (%), by Application 2024 & 2032
- Figure 38: North America Crop Monitoring Technology in Precision Farming Market Volume Share (%), by Application 2024 & 2032
- Figure 39: North America Crop Monitoring Technology in Precision Farming Market Revenue (Million), by Country 2024 & 2032
- Figure 40: North America Crop Monitoring Technology in Precision Farming Market Volume (K Unit), by Country 2024 & 2032
- Figure 41: North America Crop Monitoring Technology in Precision Farming Market Revenue Share (%), by Country 2024 & 2032
- Figure 42: North America Crop Monitoring Technology in Precision Farming Market Volume Share (%), by Country 2024 & 2032
- Figure 43: Europe Crop Monitoring Technology in Precision Farming Market Revenue (Million), by Technology 2024 & 2032
- Figure 44: Europe Crop Monitoring Technology in Precision Farming Market Volume (K Unit), by Technology 2024 & 2032
- Figure 45: Europe Crop Monitoring Technology in Precision Farming Market Revenue Share (%), by Technology 2024 & 2032
- Figure 46: Europe Crop Monitoring Technology in Precision Farming Market Volume Share (%), by Technology 2024 & 2032
- Figure 47: Europe Crop Monitoring Technology in Precision Farming Market Revenue (Million), by Solution 2024 & 2032
- Figure 48: Europe Crop Monitoring Technology in Precision Farming Market Volume (K Unit), by Solution 2024 & 2032
- Figure 49: Europe Crop Monitoring Technology in Precision Farming Market Revenue Share (%), by Solution 2024 & 2032
- Figure 50: Europe Crop Monitoring Technology in Precision Farming Market Volume Share (%), by Solution 2024 & 2032
- Figure 51: Europe Crop Monitoring Technology in Precision Farming Market Revenue (Million), by Application 2024 & 2032
- Figure 52: Europe Crop Monitoring Technology in Precision Farming Market Volume (K Unit), by Application 2024 & 2032
- Figure 53: Europe Crop Monitoring Technology in Precision Farming Market Revenue Share (%), by Application 2024 & 2032
- Figure 54: Europe Crop Monitoring Technology in Precision Farming Market Volume Share (%), by Application 2024 & 2032
- Figure 55: Europe Crop Monitoring Technology in Precision Farming Market Revenue (Million), by Country 2024 & 2032
- Figure 56: Europe Crop Monitoring Technology in Precision Farming Market Volume (K Unit), by Country 2024 & 2032
- Figure 57: Europe Crop Monitoring Technology in Precision Farming Market Revenue Share (%), by Country 2024 & 2032
- Figure 58: Europe Crop Monitoring Technology in Precision Farming Market Volume Share (%), by Country 2024 & 2032
- Figure 59: Asia Pacific Crop Monitoring Technology in Precision Farming Market Revenue (Million), by Technology 2024 & 2032
- Figure 60: Asia Pacific Crop Monitoring Technology in Precision Farming Market Volume (K Unit), by Technology 2024 & 2032
- Figure 61: Asia Pacific Crop Monitoring Technology in Precision Farming Market Revenue Share (%), by Technology 2024 & 2032
- Figure 62: Asia Pacific Crop Monitoring Technology in Precision Farming Market Volume Share (%), by Technology 2024 & 2032
- Figure 63: Asia Pacific Crop Monitoring Technology in Precision Farming Market Revenue (Million), by Solution 2024 & 2032
- Figure 64: Asia Pacific Crop Monitoring Technology in Precision Farming Market Volume (K Unit), by Solution 2024 & 2032
- Figure 65: Asia Pacific Crop Monitoring Technology in Precision Farming Market Revenue Share (%), by Solution 2024 & 2032
- Figure 66: Asia Pacific Crop Monitoring Technology in Precision Farming Market Volume Share (%), by Solution 2024 & 2032
- Figure 67: Asia Pacific Crop Monitoring Technology in Precision Farming Market Revenue (Million), by Application 2024 & 2032
- Figure 68: Asia Pacific Crop Monitoring Technology in Precision Farming Market Volume (K Unit), by Application 2024 & 2032
- Figure 69: Asia Pacific Crop Monitoring Technology in Precision Farming Market Revenue Share (%), by Application 2024 & 2032
- Figure 70: Asia Pacific Crop Monitoring Technology in Precision Farming Market Volume Share (%), by Application 2024 & 2032
- Figure 71: Asia Pacific Crop Monitoring Technology in Precision Farming Market Revenue (Million), by Country 2024 & 2032
- Figure 72: Asia Pacific Crop Monitoring Technology in Precision Farming Market Volume (K Unit), by Country 2024 & 2032
- Figure 73: Asia Pacific Crop Monitoring Technology in Precision Farming Market Revenue Share (%), by Country 2024 & 2032
- Figure 74: Asia Pacific Crop Monitoring Technology in Precision Farming Market Volume Share (%), by Country 2024 & 2032
- Figure 75: Latin America Crop Monitoring Technology in Precision Farming Market Revenue (Million), by Technology 2024 & 2032
- Figure 76: Latin America Crop Monitoring Technology in Precision Farming Market Volume (K Unit), by Technology 2024 & 2032
- Figure 77: Latin America Crop Monitoring Technology in Precision Farming Market Revenue Share (%), by Technology 2024 & 2032
- Figure 78: Latin America Crop Monitoring Technology in Precision Farming Market Volume Share (%), by Technology 2024 & 2032
- Figure 79: Latin America Crop Monitoring Technology in Precision Farming Market Revenue (Million), by Solution 2024 & 2032
- Figure 80: Latin America Crop Monitoring Technology in Precision Farming Market Volume (K Unit), by Solution 2024 & 2032
- Figure 81: Latin America Crop Monitoring Technology in Precision Farming Market Revenue Share (%), by Solution 2024 & 2032
- Figure 82: Latin America Crop Monitoring Technology in Precision Farming Market Volume Share (%), by Solution 2024 & 2032
- Figure 83: Latin America Crop Monitoring Technology in Precision Farming Market Revenue (Million), by Application 2024 & 2032
- Figure 84: Latin America Crop Monitoring Technology in Precision Farming Market Volume (K Unit), by Application 2024 & 2032
- Figure 85: Latin America Crop Monitoring Technology in Precision Farming Market Revenue Share (%), by Application 2024 & 2032
- Figure 86: Latin America Crop Monitoring Technology in Precision Farming Market Volume Share (%), by Application 2024 & 2032
- Figure 87: Latin America Crop Monitoring Technology in Precision Farming Market Revenue (Million), by Country 2024 & 2032
- Figure 88: Latin America Crop Monitoring Technology in Precision Farming Market Volume (K Unit), by Country 2024 & 2032
- Figure 89: Latin America Crop Monitoring Technology in Precision Farming Market Revenue Share (%), by Country 2024 & 2032
- Figure 90: Latin America Crop Monitoring Technology in Precision Farming Market Volume Share (%), by Country 2024 & 2032
- Figure 91: Middle East Crop Monitoring Technology in Precision Farming Market Revenue (Million), by Technology 2024 & 2032
- Figure 92: Middle East Crop Monitoring Technology in Precision Farming Market Volume (K Unit), by Technology 2024 & 2032
- Figure 93: Middle East Crop Monitoring Technology in Precision Farming Market Revenue Share (%), by Technology 2024 & 2032
- Figure 94: Middle East Crop Monitoring Technology in Precision Farming Market Volume Share (%), by Technology 2024 & 2032
- Figure 95: Middle East Crop Monitoring Technology in Precision Farming Market Revenue (Million), by Solution 2024 & 2032
- Figure 96: Middle East Crop Monitoring Technology in Precision Farming Market Volume (K Unit), by Solution 2024 & 2032
- Figure 97: Middle East Crop Monitoring Technology in Precision Farming Market Revenue Share (%), by Solution 2024 & 2032
- Figure 98: Middle East Crop Monitoring Technology in Precision Farming Market Volume Share (%), by Solution 2024 & 2032
- Figure 99: Middle East Crop Monitoring Technology in Precision Farming Market Revenue (Million), by Application 2024 & 2032
- Figure 100: Middle East Crop Monitoring Technology in Precision Farming Market Volume (K Unit), by Application 2024 & 2032
- Figure 101: Middle East Crop Monitoring Technology in Precision Farming Market Revenue Share (%), by Application 2024 & 2032
- Figure 102: Middle East Crop Monitoring Technology in Precision Farming Market Volume Share (%), by Application 2024 & 2032
- Figure 103: Middle East Crop Monitoring Technology in Precision Farming Market Revenue (Million), by Country 2024 & 2032
- Figure 104: Middle East Crop Monitoring Technology in Precision Farming Market Volume (K Unit), by Country 2024 & 2032
- Figure 105: Middle East Crop Monitoring Technology in Precision Farming Market Revenue Share (%), by Country 2024 & 2032
- Figure 106: Middle East Crop Monitoring Technology in Precision Farming Market Volume Share (%), by Country 2024 & 2032
List of Tables
- Table 1: Global Crop Monitoring Technology in Precision Farming Market Revenue Million Forecast, by Region 2019 & 2032
- Table 2: Global Crop Monitoring Technology in Precision Farming Market Volume K Unit Forecast, by Region 2019 & 2032
- Table 3: Global Crop Monitoring Technology in Precision Farming Market Revenue Million Forecast, by Technology 2019 & 2032
- Table 4: Global Crop Monitoring Technology in Precision Farming Market Volume K Unit Forecast, by Technology 2019 & 2032
- Table 5: Global Crop Monitoring Technology in Precision Farming Market Revenue Million Forecast, by Solution 2019 & 2032
- Table 6: Global Crop Monitoring Technology in Precision Farming Market Volume K Unit Forecast, by Solution 2019 & 2032
- Table 7: Global Crop Monitoring Technology in Precision Farming Market Revenue Million Forecast, by Application 2019 & 2032
- Table 8: Global Crop Monitoring Technology in Precision Farming Market Volume K Unit Forecast, by Application 2019 & 2032
- Table 9: Global Crop Monitoring Technology in Precision Farming Market Revenue Million Forecast, by Region 2019 & 2032
- Table 10: Global Crop Monitoring Technology in Precision Farming Market Volume K Unit Forecast, by Region 2019 & 2032
- Table 11: Global Crop Monitoring Technology in Precision Farming Market Revenue Million Forecast, by Country 2019 & 2032
- Table 12: Global Crop Monitoring Technology in Precision Farming Market Volume K Unit Forecast, by Country 2019 & 2032
- Table 13: United States Crop Monitoring Technology in Precision Farming Market Revenue (Million) Forecast, by Application 2019 & 2032
- Table 14: United States Crop Monitoring Technology in Precision Farming Market Volume (K Unit) Forecast, by Application 2019 & 2032
- Table 15: Canada Crop Monitoring Technology in Precision Farming Market Revenue (Million) Forecast, by Application 2019 & 2032
- Table 16: Canada Crop Monitoring Technology in Precision Farming Market Volume (K Unit) Forecast, by Application 2019 & 2032
- Table 17: Mexico Crop Monitoring Technology in Precision Farming Market Revenue (Million) Forecast, by Application 2019 & 2032
- Table 18: Mexico Crop Monitoring Technology in Precision Farming Market Volume (K Unit) Forecast, by Application 2019 & 2032
- Table 19: Global Crop Monitoring Technology in Precision Farming Market Revenue Million Forecast, by Country 2019 & 2032
- Table 20: Global Crop Monitoring Technology in Precision Farming Market Volume K Unit Forecast, by Country 2019 & 2032
- Table 21: Germany Crop Monitoring Technology in Precision Farming Market Revenue (Million) Forecast, by Application 2019 & 2032
- Table 22: Germany Crop Monitoring Technology in Precision Farming Market Volume (K Unit) Forecast, by Application 2019 & 2032
- Table 23: United Kingdom Crop Monitoring Technology in Precision Farming Market Revenue (Million) Forecast, by Application 2019 & 2032
- Table 24: United Kingdom Crop Monitoring Technology in Precision Farming Market Volume (K Unit) Forecast, by Application 2019 & 2032
- Table 25: France Crop Monitoring Technology in Precision Farming Market Revenue (Million) Forecast, by Application 2019 & 2032
- Table 26: France Crop Monitoring Technology in Precision Farming Market Volume (K Unit) Forecast, by Application 2019 & 2032
- Table 27: Spain Crop Monitoring Technology in Precision Farming Market Revenue (Million) Forecast, by Application 2019 & 2032
- Table 28: Spain Crop Monitoring Technology in Precision Farming Market Volume (K Unit) Forecast, by Application 2019 & 2032
- Table 29: Italy Crop Monitoring Technology in Precision Farming Market Revenue (Million) Forecast, by Application 2019 & 2032
- Table 30: Italy Crop Monitoring Technology in Precision Farming Market Volume (K Unit) Forecast, by Application 2019 & 2032
- Table 31: Spain Crop Monitoring Technology in Precision Farming Market Revenue (Million) Forecast, by Application 2019 & 2032
- Table 32: Spain Crop Monitoring Technology in Precision Farming Market Volume (K Unit) Forecast, by Application 2019 & 2032
- Table 33: Belgium Crop Monitoring Technology in Precision Farming Market Revenue (Million) Forecast, by Application 2019 & 2032
- Table 34: Belgium Crop Monitoring Technology in Precision Farming Market Volume (K Unit) Forecast, by Application 2019 & 2032
- Table 35: Netherland Crop Monitoring Technology in Precision Farming Market Revenue (Million) Forecast, by Application 2019 & 2032
- Table 36: Netherland Crop Monitoring Technology in Precision Farming Market Volume (K Unit) Forecast, by Application 2019 & 2032
- Table 37: Nordics Crop Monitoring Technology in Precision Farming Market Revenue (Million) Forecast, by Application 2019 & 2032
- Table 38: Nordics Crop Monitoring Technology in Precision Farming Market Volume (K Unit) Forecast, by Application 2019 & 2032
- Table 39: Rest of Europe Crop Monitoring Technology in Precision Farming Market Revenue (Million) Forecast, by Application 2019 & 2032
- Table 40: Rest of Europe Crop Monitoring Technology in Precision Farming Market Volume (K Unit) Forecast, by Application 2019 & 2032
- Table 41: Global Crop Monitoring Technology in Precision Farming Market Revenue Million Forecast, by Country 2019 & 2032
- Table 42: Global Crop Monitoring Technology in Precision Farming Market Volume K Unit Forecast, by Country 2019 & 2032
- Table 43: China Crop Monitoring Technology in Precision Farming Market Revenue (Million) Forecast, by Application 2019 & 2032
- Table 44: China Crop Monitoring Technology in Precision Farming Market Volume (K Unit) Forecast, by Application 2019 & 2032
- Table 45: Japan Crop Monitoring Technology in Precision Farming Market Revenue (Million) Forecast, by Application 2019 & 2032
- Table 46: Japan Crop Monitoring Technology in Precision Farming Market Volume (K Unit) Forecast, by Application 2019 & 2032
- Table 47: India Crop Monitoring Technology in Precision Farming Market Revenue (Million) Forecast, by Application 2019 & 2032
- Table 48: India Crop Monitoring Technology in Precision Farming Market Volume (K Unit) Forecast, by Application 2019 & 2032
- Table 49: South Korea Crop Monitoring Technology in Precision Farming Market Revenue (Million) Forecast, by Application 2019 & 2032
- Table 50: South Korea Crop Monitoring Technology in Precision Farming Market Volume (K Unit) Forecast, by Application 2019 & 2032
- Table 51: Southeast Asia Crop Monitoring Technology in Precision Farming Market Revenue (Million) Forecast, by Application 2019 & 2032
- Table 52: Southeast Asia Crop Monitoring Technology in Precision Farming Market Volume (K Unit) Forecast, by Application 2019 & 2032
- Table 53: Australia Crop Monitoring Technology in Precision Farming Market Revenue (Million) Forecast, by Application 2019 & 2032
- Table 54: Australia Crop Monitoring Technology in Precision Farming Market Volume (K Unit) Forecast, by Application 2019 & 2032
- Table 55: Indonesia Crop Monitoring Technology in Precision Farming Market Revenue (Million) Forecast, by Application 2019 & 2032
- Table 56: Indonesia Crop Monitoring Technology in Precision Farming Market Volume (K Unit) Forecast, by Application 2019 & 2032
- Table 57: Phillipes Crop Monitoring Technology in Precision Farming Market Revenue (Million) Forecast, by Application 2019 & 2032
- Table 58: Phillipes Crop Monitoring Technology in Precision Farming Market Volume (K Unit) Forecast, by Application 2019 & 2032
- Table 59: Singapore Crop Monitoring Technology in Precision Farming Market Revenue (Million) Forecast, by Application 2019 & 2032
- Table 60: Singapore Crop Monitoring Technology in Precision Farming Market Volume (K Unit) Forecast, by Application 2019 & 2032
- Table 61: Thailandc Crop Monitoring Technology in Precision Farming Market Revenue (Million) Forecast, by Application 2019 & 2032
- Table 62: Thailandc Crop Monitoring Technology in Precision Farming Market Volume (K Unit) Forecast, by Application 2019 & 2032
- Table 63: Rest of Asia Pacific Crop Monitoring Technology in Precision Farming Market Revenue (Million) Forecast, by Application 2019 & 2032
- Table 64: Rest of Asia Pacific Crop Monitoring Technology in Precision Farming Market Volume (K Unit) Forecast, by Application 2019 & 2032
- Table 65: Global Crop Monitoring Technology in Precision Farming Market Revenue Million Forecast, by Country 2019 & 2032
- Table 66: Global Crop Monitoring Technology in Precision Farming Market Volume K Unit Forecast, by Country 2019 & 2032
- Table 67: Brazil Crop Monitoring Technology in Precision Farming Market Revenue (Million) Forecast, by Application 2019 & 2032
- Table 68: Brazil Crop Monitoring Technology in Precision Farming Market Volume (K Unit) Forecast, by Application 2019 & 2032
- Table 69: Argentina Crop Monitoring Technology in Precision Farming Market Revenue (Million) Forecast, by Application 2019 & 2032
- Table 70: Argentina Crop Monitoring Technology in Precision Farming Market Volume (K Unit) Forecast, by Application 2019 & 2032
- Table 71: Peru Crop Monitoring Technology in Precision Farming Market Revenue (Million) Forecast, by Application 2019 & 2032
- Table 72: Peru Crop Monitoring Technology in Precision Farming Market Volume (K Unit) Forecast, by Application 2019 & 2032
- Table 73: Chile Crop Monitoring Technology in Precision Farming Market Revenue (Million) Forecast, by Application 2019 & 2032
- Table 74: Chile Crop Monitoring Technology in Precision Farming Market Volume (K Unit) Forecast, by Application 2019 & 2032
- Table 75: Colombia Crop Monitoring Technology in Precision Farming Market Revenue (Million) Forecast, by Application 2019 & 2032
- Table 76: Colombia Crop Monitoring Technology in Precision Farming Market Volume (K Unit) Forecast, by Application 2019 & 2032
- Table 77: Ecuador Crop Monitoring Technology in Precision Farming Market Revenue (Million) Forecast, by Application 2019 & 2032
- Table 78: Ecuador Crop Monitoring Technology in Precision Farming Market Volume (K Unit) Forecast, by Application 2019 & 2032
- Table 79: Venezuela Crop Monitoring Technology in Precision Farming Market Revenue (Million) Forecast, by Application 2019 & 2032
- Table 80: Venezuela Crop Monitoring Technology in Precision Farming Market Volume (K Unit) Forecast, by Application 2019 & 2032
- Table 81: Rest of South America Crop Monitoring Technology in Precision Farming Market Revenue (Million) Forecast, by Application 2019 & 2032
- Table 82: Rest of South America Crop Monitoring Technology in Precision Farming Market Volume (K Unit) Forecast, by Application 2019 & 2032
- Table 83: Global Crop Monitoring Technology in Precision Farming Market Revenue Million Forecast, by Country 2019 & 2032
- Table 84: Global Crop Monitoring Technology in Precision Farming Market Volume K Unit Forecast, by Country 2019 & 2032
- Table 85: United States Crop Monitoring Technology in Precision Farming Market Revenue (Million) Forecast, by Application 2019 & 2032
- Table 86: United States Crop Monitoring Technology in Precision Farming Market Volume (K Unit) Forecast, by Application 2019 & 2032
- Table 87: Canada Crop Monitoring Technology in Precision Farming Market Revenue (Million) Forecast, by Application 2019 & 2032
- Table 88: Canada Crop Monitoring Technology in Precision Farming Market Volume (K Unit) Forecast, by Application 2019 & 2032
- Table 89: Mexico Crop Monitoring Technology in Precision Farming Market Revenue (Million) Forecast, by Application 2019 & 2032
- Table 90: Mexico Crop Monitoring Technology in Precision Farming Market Volume (K Unit) Forecast, by Application 2019 & 2032
- Table 91: Global Crop Monitoring Technology in Precision Farming Market Revenue Million Forecast, by Country 2019 & 2032
- Table 92: Global Crop Monitoring Technology in Precision Farming Market Volume K Unit Forecast, by Country 2019 & 2032
- Table 93: United Arab Emirates Crop Monitoring Technology in Precision Farming Market Revenue (Million) Forecast, by Application 2019 & 2032
- Table 94: United Arab Emirates Crop Monitoring Technology in Precision Farming Market Volume (K Unit) Forecast, by Application 2019 & 2032
- Table 95: Saudi Arabia Crop Monitoring Technology in Precision Farming Market Revenue (Million) Forecast, by Application 2019 & 2032
- Table 96: Saudi Arabia Crop Monitoring Technology in Precision Farming Market Volume (K Unit) Forecast, by Application 2019 & 2032
- Table 97: South Africa Crop Monitoring Technology in Precision Farming Market Revenue (Million) Forecast, by Application 2019 & 2032
- Table 98: South Africa Crop Monitoring Technology in Precision Farming Market Volume (K Unit) Forecast, by Application 2019 & 2032
- Table 99: Rest of Middle East and Africa Crop Monitoring Technology in Precision Farming Market Revenue (Million) Forecast, by Application 2019 & 2032
- Table 100: Rest of Middle East and Africa Crop Monitoring Technology in Precision Farming Market Volume (K Unit) Forecast, by Application 2019 & 2032
- Table 101: Global Crop Monitoring Technology in Precision Farming Market Revenue Million Forecast, by Technology 2019 & 2032
- Table 102: Global Crop Monitoring Technology in Precision Farming Market Volume K Unit Forecast, by Technology 2019 & 2032
- Table 103: Global Crop Monitoring Technology in Precision Farming Market Revenue Million Forecast, by Solution 2019 & 2032
- Table 104: Global Crop Monitoring Technology in Precision Farming Market Volume K Unit Forecast, by Solution 2019 & 2032
- Table 105: Global Crop Monitoring Technology in Precision Farming Market Revenue Million Forecast, by Application 2019 & 2032
- Table 106: Global Crop Monitoring Technology in Precision Farming Market Volume K Unit Forecast, by Application 2019 & 2032
- Table 107: Global Crop Monitoring Technology in Precision Farming Market Revenue Million Forecast, by Country 2019 & 2032
- Table 108: Global Crop Monitoring Technology in Precision Farming Market Volume K Unit Forecast, by Country 2019 & 2032
- Table 109: Global Crop Monitoring Technology in Precision Farming Market Revenue Million Forecast, by Technology 2019 & 2032
- Table 110: Global Crop Monitoring Technology in Precision Farming Market Volume K Unit Forecast, by Technology 2019 & 2032
- Table 111: Global Crop Monitoring Technology in Precision Farming Market Revenue Million Forecast, by Solution 2019 & 2032
- Table 112: Global Crop Monitoring Technology in Precision Farming Market Volume K Unit Forecast, by Solution 2019 & 2032
- Table 113: Global Crop Monitoring Technology in Precision Farming Market Revenue Million Forecast, by Application 2019 & 2032
- Table 114: Global Crop Monitoring Technology in Precision Farming Market Volume K Unit Forecast, by Application 2019 & 2032
- Table 115: Global Crop Monitoring Technology in Precision Farming Market Revenue Million Forecast, by Country 2019 & 2032
- Table 116: Global Crop Monitoring Technology in Precision Farming Market Volume K Unit Forecast, by Country 2019 & 2032
- Table 117: Global Crop Monitoring Technology in Precision Farming Market Revenue Million Forecast, by Technology 2019 & 2032
- Table 118: Global Crop Monitoring Technology in Precision Farming Market Volume K Unit Forecast, by Technology 2019 & 2032
- Table 119: Global Crop Monitoring Technology in Precision Farming Market Revenue Million Forecast, by Solution 2019 & 2032
- Table 120: Global Crop Monitoring Technology in Precision Farming Market Volume K Unit Forecast, by Solution 2019 & 2032
- Table 121: Global Crop Monitoring Technology in Precision Farming Market Revenue Million Forecast, by Application 2019 & 2032
- Table 122: Global Crop Monitoring Technology in Precision Farming Market Volume K Unit Forecast, by Application 2019 & 2032
- Table 123: Global Crop Monitoring Technology in Precision Farming Market Revenue Million Forecast, by Country 2019 & 2032
- Table 124: Global Crop Monitoring Technology in Precision Farming Market Volume K Unit Forecast, by Country 2019 & 2032
- Table 125: Global Crop Monitoring Technology in Precision Farming Market Revenue Million Forecast, by Technology 2019 & 2032
- Table 126: Global Crop Monitoring Technology in Precision Farming Market Volume K Unit Forecast, by Technology 2019 & 2032
- Table 127: Global Crop Monitoring Technology in Precision Farming Market Revenue Million Forecast, by Solution 2019 & 2032
- Table 128: Global Crop Monitoring Technology in Precision Farming Market Volume K Unit Forecast, by Solution 2019 & 2032
- Table 129: Global Crop Monitoring Technology in Precision Farming Market Revenue Million Forecast, by Application 2019 & 2032
- Table 130: Global Crop Monitoring Technology in Precision Farming Market Volume K Unit Forecast, by Application 2019 & 2032
- Table 131: Global Crop Monitoring Technology in Precision Farming Market Revenue Million Forecast, by Country 2019 & 2032
- Table 132: Global Crop Monitoring Technology in Precision Farming Market Volume K Unit Forecast, by Country 2019 & 2032
- Table 133: Global Crop Monitoring Technology in Precision Farming Market Revenue Million Forecast, by Technology 2019 & 2032
- Table 134: Global Crop Monitoring Technology in Precision Farming Market Volume K Unit Forecast, by Technology 2019 & 2032
- Table 135: Global Crop Monitoring Technology in Precision Farming Market Revenue Million Forecast, by Solution 2019 & 2032
- Table 136: Global Crop Monitoring Technology in Precision Farming Market Volume K Unit Forecast, by Solution 2019 & 2032
- Table 137: Global Crop Monitoring Technology in Precision Farming Market Revenue Million Forecast, by Application 2019 & 2032
- Table 138: Global Crop Monitoring Technology in Precision Farming Market Volume K Unit Forecast, by Application 2019 & 2032
- Table 139: Global Crop Monitoring Technology in Precision Farming Market Revenue Million Forecast, by Country 2019 & 2032
- Table 140: Global Crop Monitoring Technology in Precision Farming Market Volume K Unit Forecast, by Country 2019 & 2032
Frequently Asked Questions
1. What is the projected Compound Annual Growth Rate (CAGR) of the Crop Monitoring Technology in Precision Farming Market?
The projected CAGR is approximately 12.60%.
2. Which companies are prominent players in the Crop Monitoring Technology in Precision Farming Market?
Key companies in the market include Hickey-john Corporation, Lindsay Corporation, Deere & Company, Trimble Navigation Limited, Valmont Industries Inc, AGCO Corporation, BASF SE, Land O'lakes Inc, Topcon Precision Agriculture, Teejet Technologies Illinois LLC, E I Du Pont De Nemours And Company (Dupont), AG Junction Inc, Monsanto Company, Yara International ASA, Raven Industries Inc.
3. What are the main segments of the Crop Monitoring Technology in Precision Farming Market?
The market segments include Technology, Solution, Application.
4. Can you provide details about the market size?
The market size is estimated to be USD XX Million as of 2022.
5. What are some drivers contributing to market growth?
; Rising Demand for Food Products and Improved Crop Yield; Convergence of IT with Agriculture; Government Support and Decline in Price of Sensors Aid Adoption.
6. What are the notable trends driving market growth?
GPS and GNSS Adoption to Drive the Market Growth.
7. Are there any restraints impacting market growth?
; Relatively Low Awareness and Lack af Specialists Remain a Concern; High Initial Costs and Sluggish Penetration of Technology.
8. Can you provide examples of recent developments in the market?
N/A
9. What pricing options are available for accessing the report?
Pricing options include single-user, multi-user, and enterprise licenses priced at USD 4750, USD 5250, and USD 8750 respectively.
10. Is the market size provided in terms of value or volume?
The market size is provided in terms of value, measured in Million and volume, measured in K Unit.
11. Are there any specific market keywords associated with the report?
Yes, the market keyword associated with the report is "Crop Monitoring Technology in Precision Farming Market," which aids in identifying and referencing the specific market segment covered.
12. How do I determine which pricing option suits my needs best?
The pricing options vary based on user requirements and access needs. Individual users may opt for single-user licenses, while businesses requiring broader access may choose multi-user or enterprise licenses for cost-effective access to the report.
13. Are there any additional resources or data provided in the Crop Monitoring Technology in Precision Farming Market report?
While the report offers comprehensive insights, it's advisable to review the specific contents or supplementary materials provided to ascertain if additional resources or data are available.
14. How can I stay updated on further developments or reports in the Crop Monitoring Technology in Precision Farming Market?
To stay informed about further developments, trends, and reports in the Crop Monitoring Technology in Precision Farming Market, consider subscribing to industry newsletters, following relevant companies and organizations, or regularly checking reputable industry news sources and publications.
Methodology
Step 1 - Identification of Relevant Samples Size from Population Database


Step 2 - Approaches for Defining Global Market Size (Value, Volume* & Price*)

Note*: In applicable scenarios
Step 3 - Data Sources
Primary Research
- Web Analytics
- Survey Reports
- Research Institute
- Latest Research Reports
- Opinion Leaders
Secondary Research
- Annual Reports
- White Paper
- Latest Press Release
- Industry Association
- Paid Database
- Investor Presentations

Step 4 - Data Triangulation
Involves using different sources of information in order to increase the validity of a study
These sources are likely to be stakeholders in a program - participants, other researchers, program staff, other community members, and so on.
Then we put all data in single framework & apply various statistical tools to find out the dynamic on the market.
During the analysis stage, feedback from the stakeholder groups would be compared to determine areas of agreement as well as areas of divergence


