
Key Insights
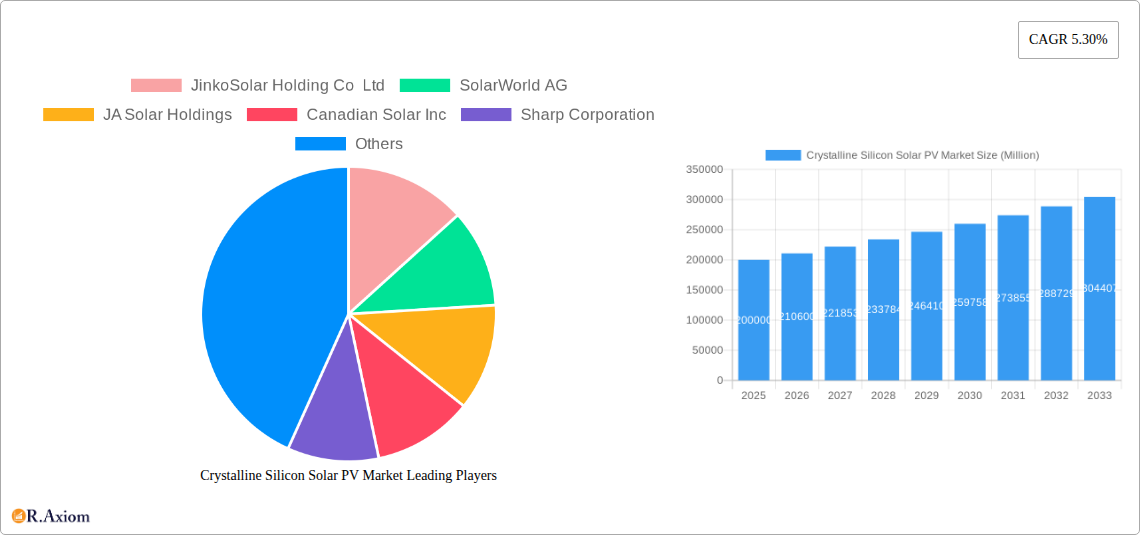
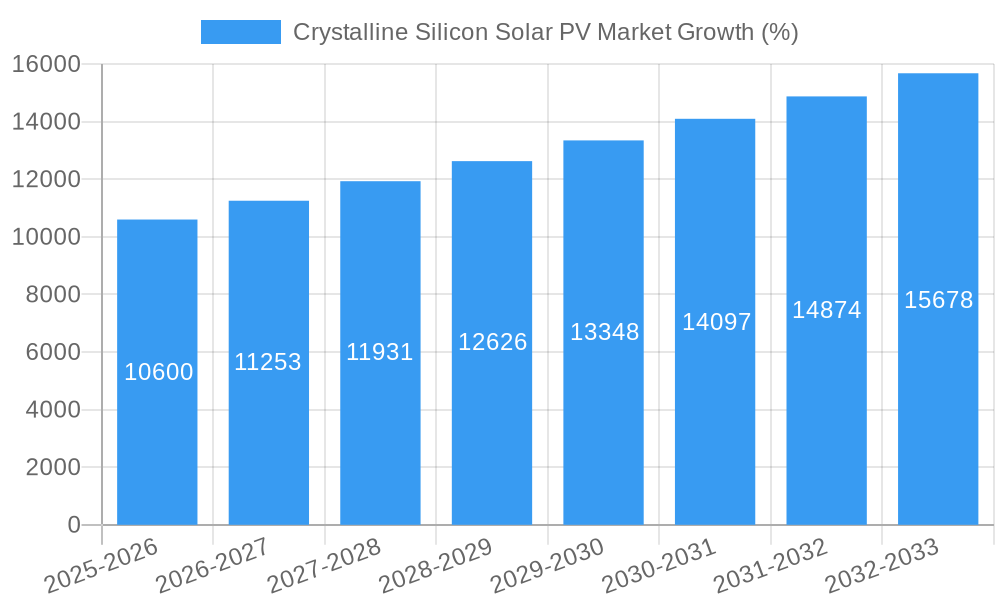
The Crystalline Silicon Solar PV market is experiencing robust growth, driven by increasing global demand for renewable energy sources and supportive government policies aimed at mitigating climate change. The market's Compound Annual Growth Rate (CAGR) of 5.30% from 2019 to 2024 indicates a steady upward trajectory. This growth is fueled by several key factors: decreasing production costs, making solar energy more cost-competitive with fossil fuels; technological advancements leading to higher efficiency panels; and a growing awareness among consumers and businesses of the environmental and economic benefits of solar power. The market segmentation reveals a strong preference for mono-crystalline silicon panels due to their higher efficiency, although poly-crystalline panels maintain a significant market share due to their lower cost. The residential sector demonstrates notable growth, reflecting increasing adoption of rooftop solar systems, while the utility-scale segment continues to be a major driver, particularly in regions with extensive solar resources and supportive regulatory frameworks. Major players in the market, including JinkoSolar, JA Solar, Canadian Solar, and Trina Solar, are constantly innovating and expanding their production capacities to meet the burgeoning global demand.
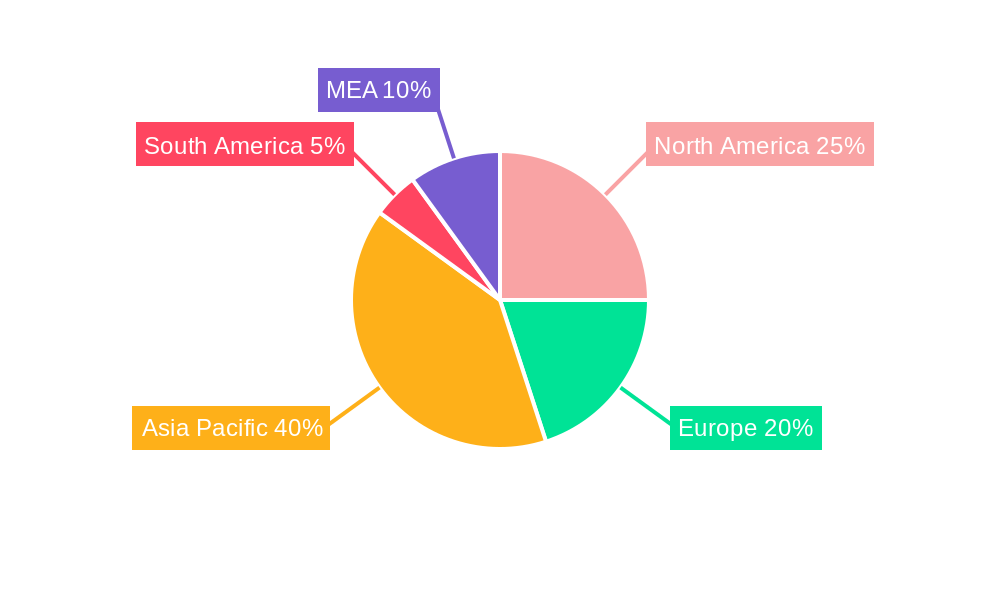
The geographical distribution of the market shows strong growth across all regions, with Asia-Pacific currently leading in terms of market share due to its large-scale solar projects and government initiatives. However, North America and Europe are also experiencing significant growth, driven by supportive policies, rising energy prices, and increasing environmental concerns. While challenges such as land availability, grid infrastructure limitations, and intermittency of solar power remain, ongoing technological advancements and increasing government investments in renewable energy infrastructure are expected to mitigate these restraints. The forecast period (2025-2033) anticipates continued market expansion, with a projected acceleration in growth as solar technology matures and becomes even more affordable and accessible. This positive outlook is further reinforced by projections of increasing energy demand globally and the urgent need for cleaner energy solutions.
Crystalline Silicon Solar PV Market: A Comprehensive Report (2019-2033)
This detailed report provides a comprehensive analysis of the Crystalline Silicon Solar PV market, offering invaluable insights for industry stakeholders, investors, and strategic decision-makers. The study period spans from 2019 to 2033, with 2025 serving as the base and estimated year. The forecast period is 2025-2033, and the historical period covers 2019-2024. The report meticulously analyzes market trends, competitive dynamics, and growth drivers, offering a granular view of this rapidly evolving sector. Key players such as JinkoSolar Holding Co Ltd, SolarWorld AG, JA Solar Holdings, Canadian Solar Inc, Sharp Corporation, Hanwha Q CELLS Co Ltd, and Trina Solar Limited are profiled, providing a competitive landscape analysis. The report segments the market by type (Mono-Crystalline, Poly-Crystalline/Multi-Crystalline) and end-user (Commercial, Residential, Utility Scale), offering specific insights into each segment’s growth trajectory.
Crystalline Silicon Solar PV Market Market Concentration & Innovation
The Crystalline Silicon Solar PV market exhibits a moderately concentrated landscape, with a few major players holding significant market share. The market share held by the top five players in 2024 is estimated to be xx%. However, the market also shows signs of increasing fragmentation, with the entry of numerous smaller players offering specialized solutions or focusing on niche segments. Innovation is a key driver, with continuous advancements in cell efficiency, module design, and manufacturing processes. Government regulations, including feed-in tariffs and renewable energy mandates, heavily influence market growth and adoption. Product substitutes like thin-film solar technologies pose a competitive threat but are yet to challenge crystalline silicon's dominance in terms of cost-effectiveness and efficiency at scale. End-user trends favor large-scale utility projects and increasing adoption in the commercial and industrial sectors. Mergers and acquisitions (M&A) activities have played a significant role in shaping market dynamics, with deal values totaling an estimated xx Million in the period 2019-2024.
- Market Concentration: Top 5 players hold xx% market share (2024).
- Innovation Drivers: Increased cell efficiency, improved module design, advanced manufacturing processes.
- Regulatory Framework: Feed-in tariffs, renewable energy mandates, net metering policies.
- M&A Activity: Total deal value (2019-2024) estimated at xx Million.
Crystalline Silicon Solar PV Market Industry Trends & Insights
The Crystalline Silicon Solar PV market is experiencing robust growth, driven by several factors. The declining cost of solar energy, increasing environmental concerns, and supportive government policies are major contributors to its expansion. Technological advancements, particularly in improving the efficiency of solar cells and reducing manufacturing costs, continue to fuel market expansion. Consumer preferences are shifting towards sustainable energy sources, leading to a rise in the adoption of solar PV systems across various sectors. Competitive dynamics remain intense, with key players continuously striving to improve their products, expand market share, and enhance their technological capabilities. The compound annual growth rate (CAGR) for the market during the forecast period (2025-2033) is projected to be xx%, with market penetration reaching xx% by 2033. The market growth is also spurred by the increasing demand for renewable energy sources to mitigate climate change and reduce reliance on fossil fuels.
Dominant Markets & Segments in Crystalline Silicon Solar PV Market
The Utility Scale segment dominates the Crystalline Silicon Solar PV market, accounting for the largest share of revenue in 2024, estimated at xx Million. This segment's dominance is driven primarily by the large-scale projects undertaken by governments and private entities. China continues to be the leading market in terms of both capacity additions and total installed capacity, followed by the United States and India.
Key Drivers for Utility-Scale Dominance:
- Large-scale projects, government incentives and subsidies
- Economies of scale in manufacturing and installation.
- Decreasing LCOE (Levelized Cost of Energy)
Key Drivers for Mono-Crystalline segment dominance:
- Higher efficiency compared to polycrystalline cells.
- Better performance in low-light conditions.
- Improved aesthetics and appearance.
Geographic Dominance: China, United States, India.
Key Drivers for Geographic Dominance (China):
- Large-scale government investment in renewable energy.
- Significant manufacturing base for solar PV components.
- Strong domestic demand.
Crystalline Silicon Solar PV Market Product Developments
Recent product innovations focus on enhancing efficiency, durability, and cost-effectiveness. Manufacturers are continually improving cell designs, optimizing module architectures, and exploring new materials to enhance performance. The market is also seeing the introduction of bifacial modules that capture light from both sides, boosting energy generation. These advancements cater to the increasing demand for higher energy yield and improved return on investment. Technological trends towards higher power output per module and enhanced reliability are driving market expansion.
Report Scope & Segmentation Analysis
This report segments the Crystalline Silicon Solar PV market by type (Mono-Crystalline, Poly-Crystalline/Multi-Crystalline) and end-user (Commercial, Residential, Utility Scale). The Mono-Crystalline segment is projected to experience a xx% CAGR during the forecast period, driven by its higher efficiency and growing demand in both utility-scale and residential applications. The Poly-Crystalline/Multi-Crystalline segment, while having a lower growth rate of xx%, maintains a substantial market share due to its lower cost. The Utility-Scale segment will show a robust growth, projected at xx%, driven by large-scale project deployments globally. The Residential segment, while showing steady growth at xx%, represents a smaller portion of the overall market. The Commercial segment is expected to maintain a consistent growth rate of xx% owing to increased awareness of the benefits of solar energy in businesses and corporate settings.
Key Drivers of Crystalline Silicon Solar PV Market Growth
Several factors drive market expansion: decreasing solar module costs, supportive government policies (tax incentives, subsidies, renewable portfolio standards), increasing environmental concerns, and rising electricity prices. Technological advancements, like improved cell efficiency and more durable modules, also play a significant role. The growing need for sustainable and clean energy is a powerful catalyst.
Challenges in the Crystalline Silicon Solar PV Market Sector
Challenges include intermittency of solar power, land availability constraints for large-scale projects, material supply chain risks, and dependence on raw materials, impacting the industry's stability and cost. The competition from other renewable energy technologies is also a significant factor. Grid integration challenges and regulatory uncertainties in specific regions pose hurdles to market growth.
Emerging Opportunities in Crystalline Silicon Solar PV Market
Emerging opportunities include integrating solar PV with energy storage solutions, the development of floating solar farms, and increased adoption in the transportation sector (electric vehicle charging). Demand for agrivoltaics (combining agriculture and solar) and building-integrated photovoltaics (BIPV) is also on the rise. The increasing awareness and adoption of rooftop solar systems for both residential and commercial purposes present substantial growth opportunities.
Leading Players in the Crystalline Silicon Solar PV Market Market
- JinkoSolar Holding Co Ltd
- SolarWorld AG
- JA Solar Holdings
- Canadian Solar Inc
- Sharp Corporation
- Hanwha Q CELLS Co Ltd
- Trina Solar Limited
Key Developments in Crystalline Silicon Solar PV Market Industry
- January 2020: BLD Power Stations Inc. commissioned a 0.673 MW solar PV plant in Nagasaki, Japan, using 280W polycrystalline silicon solar modules supplied by Ningbo Ulica Solar Science & Technology Co Ltd.
- 2021: Artistic Milliners Pvt Ltd started construction of a 50 MW Saleh Pat Solar PV Park, using 340 W polycrystalline silicon modules supplied by JA Solar Holdings Co Ltd.
Strategic Outlook for Crystalline Silicon Solar PV Market Market
The Crystalline Silicon Solar PV market is poised for continued growth, driven by technological advancements, supportive government policies, and increasing environmental awareness. The focus on efficiency improvements, cost reductions, and grid integration will be crucial for market expansion. Further diversification into new applications and geographical markets presents significant opportunities for growth and profitability for industry players. The long-term outlook remains positive, with solar PV playing a key role in the global transition to clean energy.
Crystalline Silicon Solar PV Market Segmentation
-
1. type
- 1.1. Mono-Crystalline
- 1.2. Poly-Crystalline or Multi Crystalline
-
2. End-User
- 2.1. Commercial
- 2.2. Residential
- 2.3. Utility Scale
Crystalline Silicon Solar PV Market Segmentation By Geography
- 1. North America
- 2. Europe
- 3. Asia Pacific
- 4. South America
- 5. Middle East and Africa
Crystalline Silicon Solar PV Market REPORT HIGHLIGHTS
| Aspects | Details |
|---|---|
| Study Period | 2019-2033 |
| Base Year | 2024 |
| Estimated Year | 2025 |
| Forecast Period | 2025-2033 |
| Historical Period | 2019-2024 |
| Growth Rate | CAGR of 5.30% from 2019-2033 |
| Segmentation |
|
Table of Contents
- 1. Introduction
- 1.1. Research Scope
- 1.2. Market Segmentation
- 1.3. Research Methodology
- 1.4. Definitions and Assumptions
- 2. Executive Summary
- 2.1. Introduction
- 3. Market Dynamics
- 3.1. Introduction
- 3.2. Market Drivers
- 3.2.1. 4.; Increasing Production from Unconventional Sources4.; Growing Energy Demand in the Region
- 3.3. Market Restrains
- 3.3.1. 4.; Environmental Concerns
- 3.4. Market Trends
- 3.4.1. Multi-Crystalline Silicon PV is Expected to Dominate the Market
- 4. Market Factor Analysis
- 4.1. Porters Five Forces
- 4.2. Supply/Value Chain
- 4.3. PESTEL analysis
- 4.4. Market Entropy
- 4.5. Patent/Trademark Analysis
- 5. Global Crystalline Silicon Solar PV Market Analysis, Insights and Forecast, 2019-2031
- 5.1. Market Analysis, Insights and Forecast - by type
- 5.1.1. Mono-Crystalline
- 5.1.2. Poly-Crystalline or Multi Crystalline
- 5.2. Market Analysis, Insights and Forecast - by End-User
- 5.2.1. Commercial
- 5.2.2. Residential
- 5.2.3. Utility Scale
- 5.3. Market Analysis, Insights and Forecast - by Region
- 5.3.1. North America
- 5.3.2. Europe
- 5.3.3. Asia Pacific
- 5.3.4. South America
- 5.3.5. Middle East and Africa
- 5.1. Market Analysis, Insights and Forecast - by type
- 6. North America Crystalline Silicon Solar PV Market Analysis, Insights and Forecast, 2019-2031
- 6.1. Market Analysis, Insights and Forecast - by type
- 6.1.1. Mono-Crystalline
- 6.1.2. Poly-Crystalline or Multi Crystalline
- 6.2. Market Analysis, Insights and Forecast - by End-User
- 6.2.1. Commercial
- 6.2.2. Residential
- 6.2.3. Utility Scale
- 6.1. Market Analysis, Insights and Forecast - by type
- 7. Europe Crystalline Silicon Solar PV Market Analysis, Insights and Forecast, 2019-2031
- 7.1. Market Analysis, Insights and Forecast - by type
- 7.1.1. Mono-Crystalline
- 7.1.2. Poly-Crystalline or Multi Crystalline
- 7.2. Market Analysis, Insights and Forecast - by End-User
- 7.2.1. Commercial
- 7.2.2. Residential
- 7.2.3. Utility Scale
- 7.1. Market Analysis, Insights and Forecast - by type
- 8. Asia Pacific Crystalline Silicon Solar PV Market Analysis, Insights and Forecast, 2019-2031
- 8.1. Market Analysis, Insights and Forecast - by type
- 8.1.1. Mono-Crystalline
- 8.1.2. Poly-Crystalline or Multi Crystalline
- 8.2. Market Analysis, Insights and Forecast - by End-User
- 8.2.1. Commercial
- 8.2.2. Residential
- 8.2.3. Utility Scale
- 8.1. Market Analysis, Insights and Forecast - by type
- 9. South America Crystalline Silicon Solar PV Market Analysis, Insights and Forecast, 2019-2031
- 9.1. Market Analysis, Insights and Forecast - by type
- 9.1.1. Mono-Crystalline
- 9.1.2. Poly-Crystalline or Multi Crystalline
- 9.2. Market Analysis, Insights and Forecast - by End-User
- 9.2.1. Commercial
- 9.2.2. Residential
- 9.2.3. Utility Scale
- 9.1. Market Analysis, Insights and Forecast - by type
- 10. Middle East and Africa Crystalline Silicon Solar PV Market Analysis, Insights and Forecast, 2019-2031
- 10.1. Market Analysis, Insights and Forecast - by type
- 10.1.1. Mono-Crystalline
- 10.1.2. Poly-Crystalline or Multi Crystalline
- 10.2. Market Analysis, Insights and Forecast - by End-User
- 10.2.1. Commercial
- 10.2.2. Residential
- 10.2.3. Utility Scale
- 10.1. Market Analysis, Insights and Forecast - by type
- 11. North America Crystalline Silicon Solar PV Market Analysis, Insights and Forecast, 2019-2031
- 11.1. Market Analysis, Insights and Forecast - By Country/Sub-region
- 11.1.1 United States
- 11.1.2 Canada
- 11.1.3 Mexico
- 12. Europe Crystalline Silicon Solar PV Market Analysis, Insights and Forecast, 2019-2031
- 12.1. Market Analysis, Insights and Forecast - By Country/Sub-region
- 12.1.1 Germany
- 12.1.2 United Kingdom
- 12.1.3 France
- 12.1.4 Spain
- 12.1.5 Italy
- 12.1.6 Spain
- 12.1.7 Belgium
- 12.1.8 Netherland
- 12.1.9 Nordics
- 12.1.10 Rest of Europe
- 13. Asia Pacific Crystalline Silicon Solar PV Market Analysis, Insights and Forecast, 2019-2031
- 13.1. Market Analysis, Insights and Forecast - By Country/Sub-region
- 13.1.1 China
- 13.1.2 Japan
- 13.1.3 India
- 13.1.4 South Korea
- 13.1.5 Southeast Asia
- 13.1.6 Australia
- 13.1.7 Indonesia
- 13.1.8 Phillipes
- 13.1.9 Singapore
- 13.1.10 Thailandc
- 13.1.11 Rest of Asia Pacific
- 14. South America Crystalline Silicon Solar PV Market Analysis, Insights and Forecast, 2019-2031
- 14.1. Market Analysis, Insights and Forecast - By Country/Sub-region
- 14.1.1 Brazil
- 14.1.2 Argentina
- 14.1.3 Peru
- 14.1.4 Chile
- 14.1.5 Colombia
- 14.1.6 Ecuador
- 14.1.7 Venezuela
- 14.1.8 Rest of South America
- 15. MEA Crystalline Silicon Solar PV Market Analysis, Insights and Forecast, 2019-2031
- 15.1. Market Analysis, Insights and Forecast - By Country/Sub-region
- 15.1.1 United Arab Emirates
- 15.1.2 Saudi Arabia
- 15.1.3 South Africa
- 15.1.4 Rest of Middle East and Africa
- 16. Competitive Analysis
- 16.1. Global Market Share Analysis 2024
- 16.2. Company Profiles
- 16.2.1 JinkoSolar Holding Co Ltd
- 16.2.1.1. Overview
- 16.2.1.2. Products
- 16.2.1.3. SWOT Analysis
- 16.2.1.4. Recent Developments
- 16.2.1.5. Financials (Based on Availability)
- 16.2.2 SolarWorld AG
- 16.2.2.1. Overview
- 16.2.2.2. Products
- 16.2.2.3. SWOT Analysis
- 16.2.2.4. Recent Developments
- 16.2.2.5. Financials (Based on Availability)
- 16.2.3 JA Solar Holdings
- 16.2.3.1. Overview
- 16.2.3.2. Products
- 16.2.3.3. SWOT Analysis
- 16.2.3.4. Recent Developments
- 16.2.3.5. Financials (Based on Availability)
- 16.2.4 Canadian Solar Inc
- 16.2.4.1. Overview
- 16.2.4.2. Products
- 16.2.4.3. SWOT Analysis
- 16.2.4.4. Recent Developments
- 16.2.4.5. Financials (Based on Availability)
- 16.2.5 Sharp Corporation
- 16.2.5.1. Overview
- 16.2.5.2. Products
- 16.2.5.3. SWOT Analysis
- 16.2.5.4. Recent Developments
- 16.2.5.5. Financials (Based on Availability)
- 16.2.6 Hanwha Q CELLS Co Ltd
- 16.2.6.1. Overview
- 16.2.6.2. Products
- 16.2.6.3. SWOT Analysis
- 16.2.6.4. Recent Developments
- 16.2.6.5. Financials (Based on Availability)
- 16.2.7 Trina Solar Limited
- 16.2.7.1. Overview
- 16.2.7.2. Products
- 16.2.7.3. SWOT Analysis
- 16.2.7.4. Recent Developments
- 16.2.7.5. Financials (Based on Availability)
- 16.2.1 JinkoSolar Holding Co Ltd
List of Figures
- Figure 1: Global Crystalline Silicon Solar PV Market Revenue Breakdown (Million, %) by Region 2024 & 2032
- Figure 2: Global Crystalline Silicon Solar PV Market Volume Breakdown (Gigawatt, %) by Region 2024 & 2032
- Figure 3: North America Crystalline Silicon Solar PV Market Revenue (Million), by Country 2024 & 2032
- Figure 4: North America Crystalline Silicon Solar PV Market Volume (Gigawatt), by Country 2024 & 2032
- Figure 5: North America Crystalline Silicon Solar PV Market Revenue Share (%), by Country 2024 & 2032
- Figure 6: North America Crystalline Silicon Solar PV Market Volume Share (%), by Country 2024 & 2032
- Figure 7: Europe Crystalline Silicon Solar PV Market Revenue (Million), by Country 2024 & 2032
- Figure 8: Europe Crystalline Silicon Solar PV Market Volume (Gigawatt), by Country 2024 & 2032
- Figure 9: Europe Crystalline Silicon Solar PV Market Revenue Share (%), by Country 2024 & 2032
- Figure 10: Europe Crystalline Silicon Solar PV Market Volume Share (%), by Country 2024 & 2032
- Figure 11: Asia Pacific Crystalline Silicon Solar PV Market Revenue (Million), by Country 2024 & 2032
- Figure 12: Asia Pacific Crystalline Silicon Solar PV Market Volume (Gigawatt), by Country 2024 & 2032
- Figure 13: Asia Pacific Crystalline Silicon Solar PV Market Revenue Share (%), by Country 2024 & 2032
- Figure 14: Asia Pacific Crystalline Silicon Solar PV Market Volume Share (%), by Country 2024 & 2032
- Figure 15: South America Crystalline Silicon Solar PV Market Revenue (Million), by Country 2024 & 2032
- Figure 16: South America Crystalline Silicon Solar PV Market Volume (Gigawatt), by Country 2024 & 2032
- Figure 17: South America Crystalline Silicon Solar PV Market Revenue Share (%), by Country 2024 & 2032
- Figure 18: South America Crystalline Silicon Solar PV Market Volume Share (%), by Country 2024 & 2032
- Figure 19: MEA Crystalline Silicon Solar PV Market Revenue (Million), by Country 2024 & 2032
- Figure 20: MEA Crystalline Silicon Solar PV Market Volume (Gigawatt), by Country 2024 & 2032
- Figure 21: MEA Crystalline Silicon Solar PV Market Revenue Share (%), by Country 2024 & 2032
- Figure 22: MEA Crystalline Silicon Solar PV Market Volume Share (%), by Country 2024 & 2032
- Figure 23: North America Crystalline Silicon Solar PV Market Revenue (Million), by type 2024 & 2032
- Figure 24: North America Crystalline Silicon Solar PV Market Volume (Gigawatt), by type 2024 & 2032
- Figure 25: North America Crystalline Silicon Solar PV Market Revenue Share (%), by type 2024 & 2032
- Figure 26: North America Crystalline Silicon Solar PV Market Volume Share (%), by type 2024 & 2032
- Figure 27: North America Crystalline Silicon Solar PV Market Revenue (Million), by End-User 2024 & 2032
- Figure 28: North America Crystalline Silicon Solar PV Market Volume (Gigawatt), by End-User 2024 & 2032
- Figure 29: North America Crystalline Silicon Solar PV Market Revenue Share (%), by End-User 2024 & 2032
- Figure 30: North America Crystalline Silicon Solar PV Market Volume Share (%), by End-User 2024 & 2032
- Figure 31: North America Crystalline Silicon Solar PV Market Revenue (Million), by Country 2024 & 2032
- Figure 32: North America Crystalline Silicon Solar PV Market Volume (Gigawatt), by Country 2024 & 2032
- Figure 33: North America Crystalline Silicon Solar PV Market Revenue Share (%), by Country 2024 & 2032
- Figure 34: North America Crystalline Silicon Solar PV Market Volume Share (%), by Country 2024 & 2032
- Figure 35: Europe Crystalline Silicon Solar PV Market Revenue (Million), by type 2024 & 2032
- Figure 36: Europe Crystalline Silicon Solar PV Market Volume (Gigawatt), by type 2024 & 2032
- Figure 37: Europe Crystalline Silicon Solar PV Market Revenue Share (%), by type 2024 & 2032
- Figure 38: Europe Crystalline Silicon Solar PV Market Volume Share (%), by type 2024 & 2032
- Figure 39: Europe Crystalline Silicon Solar PV Market Revenue (Million), by End-User 2024 & 2032
- Figure 40: Europe Crystalline Silicon Solar PV Market Volume (Gigawatt), by End-User 2024 & 2032
- Figure 41: Europe Crystalline Silicon Solar PV Market Revenue Share (%), by End-User 2024 & 2032
- Figure 42: Europe Crystalline Silicon Solar PV Market Volume Share (%), by End-User 2024 & 2032
- Figure 43: Europe Crystalline Silicon Solar PV Market Revenue (Million), by Country 2024 & 2032
- Figure 44: Europe Crystalline Silicon Solar PV Market Volume (Gigawatt), by Country 2024 & 2032
- Figure 45: Europe Crystalline Silicon Solar PV Market Revenue Share (%), by Country 2024 & 2032
- Figure 46: Europe Crystalline Silicon Solar PV Market Volume Share (%), by Country 2024 & 2032
- Figure 47: Asia Pacific Crystalline Silicon Solar PV Market Revenue (Million), by type 2024 & 2032
- Figure 48: Asia Pacific Crystalline Silicon Solar PV Market Volume (Gigawatt), by type 2024 & 2032
- Figure 49: Asia Pacific Crystalline Silicon Solar PV Market Revenue Share (%), by type 2024 & 2032
- Figure 50: Asia Pacific Crystalline Silicon Solar PV Market Volume Share (%), by type 2024 & 2032
- Figure 51: Asia Pacific Crystalline Silicon Solar PV Market Revenue (Million), by End-User 2024 & 2032
- Figure 52: Asia Pacific Crystalline Silicon Solar PV Market Volume (Gigawatt), by End-User 2024 & 2032
- Figure 53: Asia Pacific Crystalline Silicon Solar PV Market Revenue Share (%), by End-User 2024 & 2032
- Figure 54: Asia Pacific Crystalline Silicon Solar PV Market Volume Share (%), by End-User 2024 & 2032
- Figure 55: Asia Pacific Crystalline Silicon Solar PV Market Revenue (Million), by Country 2024 & 2032
- Figure 56: Asia Pacific Crystalline Silicon Solar PV Market Volume (Gigawatt), by Country 2024 & 2032
- Figure 57: Asia Pacific Crystalline Silicon Solar PV Market Revenue Share (%), by Country 2024 & 2032
- Figure 58: Asia Pacific Crystalline Silicon Solar PV Market Volume Share (%), by Country 2024 & 2032
- Figure 59: South America Crystalline Silicon Solar PV Market Revenue (Million), by type 2024 & 2032
- Figure 60: South America Crystalline Silicon Solar PV Market Volume (Gigawatt), by type 2024 & 2032
- Figure 61: South America Crystalline Silicon Solar PV Market Revenue Share (%), by type 2024 & 2032
- Figure 62: South America Crystalline Silicon Solar PV Market Volume Share (%), by type 2024 & 2032
- Figure 63: South America Crystalline Silicon Solar PV Market Revenue (Million), by End-User 2024 & 2032
- Figure 64: South America Crystalline Silicon Solar PV Market Volume (Gigawatt), by End-User 2024 & 2032
- Figure 65: South America Crystalline Silicon Solar PV Market Revenue Share (%), by End-User 2024 & 2032
- Figure 66: South America Crystalline Silicon Solar PV Market Volume Share (%), by End-User 2024 & 2032
- Figure 67: South America Crystalline Silicon Solar PV Market Revenue (Million), by Country 2024 & 2032
- Figure 68: South America Crystalline Silicon Solar PV Market Volume (Gigawatt), by Country 2024 & 2032
- Figure 69: South America Crystalline Silicon Solar PV Market Revenue Share (%), by Country 2024 & 2032
- Figure 70: South America Crystalline Silicon Solar PV Market Volume Share (%), by Country 2024 & 2032
- Figure 71: Middle East and Africa Crystalline Silicon Solar PV Market Revenue (Million), by type 2024 & 2032
- Figure 72: Middle East and Africa Crystalline Silicon Solar PV Market Volume (Gigawatt), by type 2024 & 2032
- Figure 73: Middle East and Africa Crystalline Silicon Solar PV Market Revenue Share (%), by type 2024 & 2032
- Figure 74: Middle East and Africa Crystalline Silicon Solar PV Market Volume Share (%), by type 2024 & 2032
- Figure 75: Middle East and Africa Crystalline Silicon Solar PV Market Revenue (Million), by End-User 2024 & 2032
- Figure 76: Middle East and Africa Crystalline Silicon Solar PV Market Volume (Gigawatt), by End-User 2024 & 2032
- Figure 77: Middle East and Africa Crystalline Silicon Solar PV Market Revenue Share (%), by End-User 2024 & 2032
- Figure 78: Middle East and Africa Crystalline Silicon Solar PV Market Volume Share (%), by End-User 2024 & 2032
- Figure 79: Middle East and Africa Crystalline Silicon Solar PV Market Revenue (Million), by Country 2024 & 2032
- Figure 80: Middle East and Africa Crystalline Silicon Solar PV Market Volume (Gigawatt), by Country 2024 & 2032
- Figure 81: Middle East and Africa Crystalline Silicon Solar PV Market Revenue Share (%), by Country 2024 & 2032
- Figure 82: Middle East and Africa Crystalline Silicon Solar PV Market Volume Share (%), by Country 2024 & 2032
List of Tables
- Table 1: Global Crystalline Silicon Solar PV Market Revenue Million Forecast, by Region 2019 & 2032
- Table 2: Global Crystalline Silicon Solar PV Market Volume Gigawatt Forecast, by Region 2019 & 2032
- Table 3: Global Crystalline Silicon Solar PV Market Revenue Million Forecast, by type 2019 & 2032
- Table 4: Global Crystalline Silicon Solar PV Market Volume Gigawatt Forecast, by type 2019 & 2032
- Table 5: Global Crystalline Silicon Solar PV Market Revenue Million Forecast, by End-User 2019 & 2032
- Table 6: Global Crystalline Silicon Solar PV Market Volume Gigawatt Forecast, by End-User 2019 & 2032
- Table 7: Global Crystalline Silicon Solar PV Market Revenue Million Forecast, by Region 2019 & 2032
- Table 8: Global Crystalline Silicon Solar PV Market Volume Gigawatt Forecast, by Region 2019 & 2032
- Table 9: Global Crystalline Silicon Solar PV Market Revenue Million Forecast, by Country 2019 & 2032
- Table 10: Global Crystalline Silicon Solar PV Market Volume Gigawatt Forecast, by Country 2019 & 2032
- Table 11: United States Crystalline Silicon Solar PV Market Revenue (Million) Forecast, by Application 2019 & 2032
- Table 12: United States Crystalline Silicon Solar PV Market Volume (Gigawatt) Forecast, by Application 2019 & 2032
- Table 13: Canada Crystalline Silicon Solar PV Market Revenue (Million) Forecast, by Application 2019 & 2032
- Table 14: Canada Crystalline Silicon Solar PV Market Volume (Gigawatt) Forecast, by Application 2019 & 2032
- Table 15: Mexico Crystalline Silicon Solar PV Market Revenue (Million) Forecast, by Application 2019 & 2032
- Table 16: Mexico Crystalline Silicon Solar PV Market Volume (Gigawatt) Forecast, by Application 2019 & 2032
- Table 17: Global Crystalline Silicon Solar PV Market Revenue Million Forecast, by Country 2019 & 2032
- Table 18: Global Crystalline Silicon Solar PV Market Volume Gigawatt Forecast, by Country 2019 & 2032
- Table 19: Germany Crystalline Silicon Solar PV Market Revenue (Million) Forecast, by Application 2019 & 2032
- Table 20: Germany Crystalline Silicon Solar PV Market Volume (Gigawatt) Forecast, by Application 2019 & 2032
- Table 21: United Kingdom Crystalline Silicon Solar PV Market Revenue (Million) Forecast, by Application 2019 & 2032
- Table 22: United Kingdom Crystalline Silicon Solar PV Market Volume (Gigawatt) Forecast, by Application 2019 & 2032
- Table 23: France Crystalline Silicon Solar PV Market Revenue (Million) Forecast, by Application 2019 & 2032
- Table 24: France Crystalline Silicon Solar PV Market Volume (Gigawatt) Forecast, by Application 2019 & 2032
- Table 25: Spain Crystalline Silicon Solar PV Market Revenue (Million) Forecast, by Application 2019 & 2032
- Table 26: Spain Crystalline Silicon Solar PV Market Volume (Gigawatt) Forecast, by Application 2019 & 2032
- Table 27: Italy Crystalline Silicon Solar PV Market Revenue (Million) Forecast, by Application 2019 & 2032
- Table 28: Italy Crystalline Silicon Solar PV Market Volume (Gigawatt) Forecast, by Application 2019 & 2032
- Table 29: Spain Crystalline Silicon Solar PV Market Revenue (Million) Forecast, by Application 2019 & 2032
- Table 30: Spain Crystalline Silicon Solar PV Market Volume (Gigawatt) Forecast, by Application 2019 & 2032
- Table 31: Belgium Crystalline Silicon Solar PV Market Revenue (Million) Forecast, by Application 2019 & 2032
- Table 32: Belgium Crystalline Silicon Solar PV Market Volume (Gigawatt) Forecast, by Application 2019 & 2032
- Table 33: Netherland Crystalline Silicon Solar PV Market Revenue (Million) Forecast, by Application 2019 & 2032
- Table 34: Netherland Crystalline Silicon Solar PV Market Volume (Gigawatt) Forecast, by Application 2019 & 2032
- Table 35: Nordics Crystalline Silicon Solar PV Market Revenue (Million) Forecast, by Application 2019 & 2032
- Table 36: Nordics Crystalline Silicon Solar PV Market Volume (Gigawatt) Forecast, by Application 2019 & 2032
- Table 37: Rest of Europe Crystalline Silicon Solar PV Market Revenue (Million) Forecast, by Application 2019 & 2032
- Table 38: Rest of Europe Crystalline Silicon Solar PV Market Volume (Gigawatt) Forecast, by Application 2019 & 2032
- Table 39: Global Crystalline Silicon Solar PV Market Revenue Million Forecast, by Country 2019 & 2032
- Table 40: Global Crystalline Silicon Solar PV Market Volume Gigawatt Forecast, by Country 2019 & 2032
- Table 41: China Crystalline Silicon Solar PV Market Revenue (Million) Forecast, by Application 2019 & 2032
- Table 42: China Crystalline Silicon Solar PV Market Volume (Gigawatt) Forecast, by Application 2019 & 2032
- Table 43: Japan Crystalline Silicon Solar PV Market Revenue (Million) Forecast, by Application 2019 & 2032
- Table 44: Japan Crystalline Silicon Solar PV Market Volume (Gigawatt) Forecast, by Application 2019 & 2032
- Table 45: India Crystalline Silicon Solar PV Market Revenue (Million) Forecast, by Application 2019 & 2032
- Table 46: India Crystalline Silicon Solar PV Market Volume (Gigawatt) Forecast, by Application 2019 & 2032
- Table 47: South Korea Crystalline Silicon Solar PV Market Revenue (Million) Forecast, by Application 2019 & 2032
- Table 48: South Korea Crystalline Silicon Solar PV Market Volume (Gigawatt) Forecast, by Application 2019 & 2032
- Table 49: Southeast Asia Crystalline Silicon Solar PV Market Revenue (Million) Forecast, by Application 2019 & 2032
- Table 50: Southeast Asia Crystalline Silicon Solar PV Market Volume (Gigawatt) Forecast, by Application 2019 & 2032
- Table 51: Australia Crystalline Silicon Solar PV Market Revenue (Million) Forecast, by Application 2019 & 2032
- Table 52: Australia Crystalline Silicon Solar PV Market Volume (Gigawatt) Forecast, by Application 2019 & 2032
- Table 53: Indonesia Crystalline Silicon Solar PV Market Revenue (Million) Forecast, by Application 2019 & 2032
- Table 54: Indonesia Crystalline Silicon Solar PV Market Volume (Gigawatt) Forecast, by Application 2019 & 2032
- Table 55: Phillipes Crystalline Silicon Solar PV Market Revenue (Million) Forecast, by Application 2019 & 2032
- Table 56: Phillipes Crystalline Silicon Solar PV Market Volume (Gigawatt) Forecast, by Application 2019 & 2032
- Table 57: Singapore Crystalline Silicon Solar PV Market Revenue (Million) Forecast, by Application 2019 & 2032
- Table 58: Singapore Crystalline Silicon Solar PV Market Volume (Gigawatt) Forecast, by Application 2019 & 2032
- Table 59: Thailandc Crystalline Silicon Solar PV Market Revenue (Million) Forecast, by Application 2019 & 2032
- Table 60: Thailandc Crystalline Silicon Solar PV Market Volume (Gigawatt) Forecast, by Application 2019 & 2032
- Table 61: Rest of Asia Pacific Crystalline Silicon Solar PV Market Revenue (Million) Forecast, by Application 2019 & 2032
- Table 62: Rest of Asia Pacific Crystalline Silicon Solar PV Market Volume (Gigawatt) Forecast, by Application 2019 & 2032
- Table 63: Global Crystalline Silicon Solar PV Market Revenue Million Forecast, by Country 2019 & 2032
- Table 64: Global Crystalline Silicon Solar PV Market Volume Gigawatt Forecast, by Country 2019 & 2032
- Table 65: Brazil Crystalline Silicon Solar PV Market Revenue (Million) Forecast, by Application 2019 & 2032
- Table 66: Brazil Crystalline Silicon Solar PV Market Volume (Gigawatt) Forecast, by Application 2019 & 2032
- Table 67: Argentina Crystalline Silicon Solar PV Market Revenue (Million) Forecast, by Application 2019 & 2032
- Table 68: Argentina Crystalline Silicon Solar PV Market Volume (Gigawatt) Forecast, by Application 2019 & 2032
- Table 69: Peru Crystalline Silicon Solar PV Market Revenue (Million) Forecast, by Application 2019 & 2032
- Table 70: Peru Crystalline Silicon Solar PV Market Volume (Gigawatt) Forecast, by Application 2019 & 2032
- Table 71: Chile Crystalline Silicon Solar PV Market Revenue (Million) Forecast, by Application 2019 & 2032
- Table 72: Chile Crystalline Silicon Solar PV Market Volume (Gigawatt) Forecast, by Application 2019 & 2032
- Table 73: Colombia Crystalline Silicon Solar PV Market Revenue (Million) Forecast, by Application 2019 & 2032
- Table 74: Colombia Crystalline Silicon Solar PV Market Volume (Gigawatt) Forecast, by Application 2019 & 2032
- Table 75: Ecuador Crystalline Silicon Solar PV Market Revenue (Million) Forecast, by Application 2019 & 2032
- Table 76: Ecuador Crystalline Silicon Solar PV Market Volume (Gigawatt) Forecast, by Application 2019 & 2032
- Table 77: Venezuela Crystalline Silicon Solar PV Market Revenue (Million) Forecast, by Application 2019 & 2032
- Table 78: Venezuela Crystalline Silicon Solar PV Market Volume (Gigawatt) Forecast, by Application 2019 & 2032
- Table 79: Rest of South America Crystalline Silicon Solar PV Market Revenue (Million) Forecast, by Application 2019 & 2032
- Table 80: Rest of South America Crystalline Silicon Solar PV Market Volume (Gigawatt) Forecast, by Application 2019 & 2032
- Table 81: Global Crystalline Silicon Solar PV Market Revenue Million Forecast, by Country 2019 & 2032
- Table 82: Global Crystalline Silicon Solar PV Market Volume Gigawatt Forecast, by Country 2019 & 2032
- Table 83: United Arab Emirates Crystalline Silicon Solar PV Market Revenue (Million) Forecast, by Application 2019 & 2032
- Table 84: United Arab Emirates Crystalline Silicon Solar PV Market Volume (Gigawatt) Forecast, by Application 2019 & 2032
- Table 85: Saudi Arabia Crystalline Silicon Solar PV Market Revenue (Million) Forecast, by Application 2019 & 2032
- Table 86: Saudi Arabia Crystalline Silicon Solar PV Market Volume (Gigawatt) Forecast, by Application 2019 & 2032
- Table 87: South Africa Crystalline Silicon Solar PV Market Revenue (Million) Forecast, by Application 2019 & 2032
- Table 88: South Africa Crystalline Silicon Solar PV Market Volume (Gigawatt) Forecast, by Application 2019 & 2032
- Table 89: Rest of Middle East and Africa Crystalline Silicon Solar PV Market Revenue (Million) Forecast, by Application 2019 & 2032
- Table 90: Rest of Middle East and Africa Crystalline Silicon Solar PV Market Volume (Gigawatt) Forecast, by Application 2019 & 2032
- Table 91: Global Crystalline Silicon Solar PV Market Revenue Million Forecast, by type 2019 & 2032
- Table 92: Global Crystalline Silicon Solar PV Market Volume Gigawatt Forecast, by type 2019 & 2032
- Table 93: Global Crystalline Silicon Solar PV Market Revenue Million Forecast, by End-User 2019 & 2032
- Table 94: Global Crystalline Silicon Solar PV Market Volume Gigawatt Forecast, by End-User 2019 & 2032
- Table 95: Global Crystalline Silicon Solar PV Market Revenue Million Forecast, by Country 2019 & 2032
- Table 96: Global Crystalline Silicon Solar PV Market Volume Gigawatt Forecast, by Country 2019 & 2032
- Table 97: Global Crystalline Silicon Solar PV Market Revenue Million Forecast, by type 2019 & 2032
- Table 98: Global Crystalline Silicon Solar PV Market Volume Gigawatt Forecast, by type 2019 & 2032
- Table 99: Global Crystalline Silicon Solar PV Market Revenue Million Forecast, by End-User 2019 & 2032
- Table 100: Global Crystalline Silicon Solar PV Market Volume Gigawatt Forecast, by End-User 2019 & 2032
- Table 101: Global Crystalline Silicon Solar PV Market Revenue Million Forecast, by Country 2019 & 2032
- Table 102: Global Crystalline Silicon Solar PV Market Volume Gigawatt Forecast, by Country 2019 & 2032
- Table 103: Global Crystalline Silicon Solar PV Market Revenue Million Forecast, by type 2019 & 2032
- Table 104: Global Crystalline Silicon Solar PV Market Volume Gigawatt Forecast, by type 2019 & 2032
- Table 105: Global Crystalline Silicon Solar PV Market Revenue Million Forecast, by End-User 2019 & 2032
- Table 106: Global Crystalline Silicon Solar PV Market Volume Gigawatt Forecast, by End-User 2019 & 2032
- Table 107: Global Crystalline Silicon Solar PV Market Revenue Million Forecast, by Country 2019 & 2032
- Table 108: Global Crystalline Silicon Solar PV Market Volume Gigawatt Forecast, by Country 2019 & 2032
- Table 109: Global Crystalline Silicon Solar PV Market Revenue Million Forecast, by type 2019 & 2032
- Table 110: Global Crystalline Silicon Solar PV Market Volume Gigawatt Forecast, by type 2019 & 2032
- Table 111: Global Crystalline Silicon Solar PV Market Revenue Million Forecast, by End-User 2019 & 2032
- Table 112: Global Crystalline Silicon Solar PV Market Volume Gigawatt Forecast, by End-User 2019 & 2032
- Table 113: Global Crystalline Silicon Solar PV Market Revenue Million Forecast, by Country 2019 & 2032
- Table 114: Global Crystalline Silicon Solar PV Market Volume Gigawatt Forecast, by Country 2019 & 2032
- Table 115: Global Crystalline Silicon Solar PV Market Revenue Million Forecast, by type 2019 & 2032
- Table 116: Global Crystalline Silicon Solar PV Market Volume Gigawatt Forecast, by type 2019 & 2032
- Table 117: Global Crystalline Silicon Solar PV Market Revenue Million Forecast, by End-User 2019 & 2032
- Table 118: Global Crystalline Silicon Solar PV Market Volume Gigawatt Forecast, by End-User 2019 & 2032
- Table 119: Global Crystalline Silicon Solar PV Market Revenue Million Forecast, by Country 2019 & 2032
- Table 120: Global Crystalline Silicon Solar PV Market Volume Gigawatt Forecast, by Country 2019 & 2032
Frequently Asked Questions
1. What is the projected Compound Annual Growth Rate (CAGR) of the Crystalline Silicon Solar PV Market?
The projected CAGR is approximately 5.30%.
2. Which companies are prominent players in the Crystalline Silicon Solar PV Market?
Key companies in the market include JinkoSolar Holding Co Ltd, SolarWorld AG, JA Solar Holdings, Canadian Solar Inc, Sharp Corporation, Hanwha Q CELLS Co Ltd, Trina Solar Limited.
3. What are the main segments of the Crystalline Silicon Solar PV Market?
The market segments include type, End-User.
4. Can you provide details about the market size?
The market size is estimated to be USD XX Million as of 2022.
5. What are some drivers contributing to market growth?
4.; Increasing Production from Unconventional Sources4.; Growing Energy Demand in the Region.
6. What are the notable trends driving market growth?
Multi-Crystalline Silicon PV is Expected to Dominate the Market.
7. Are there any restraints impacting market growth?
4.; Environmental Concerns.
8. Can you provide examples of recent developments in the market?
In January 2020, BLD Power Stations Inc has commissioned 0.673 MW solar photovoltaic plant in Nagasaki, Japan. Ningbo Ulica Solar Science & Technology Co Ltd has supplied 280W polycrystalline silicon solar modules for this project.
9. What pricing options are available for accessing the report?
Pricing options include single-user, multi-user, and enterprise licenses priced at USD 4750, USD 5250, and USD 8750 respectively.
10. Is the market size provided in terms of value or volume?
The market size is provided in terms of value, measured in Million and volume, measured in Gigawatt.
11. Are there any specific market keywords associated with the report?
Yes, the market keyword associated with the report is "Crystalline Silicon Solar PV Market," which aids in identifying and referencing the specific market segment covered.
12. How do I determine which pricing option suits my needs best?
The pricing options vary based on user requirements and access needs. Individual users may opt for single-user licenses, while businesses requiring broader access may choose multi-user or enterprise licenses for cost-effective access to the report.
13. Are there any additional resources or data provided in the Crystalline Silicon Solar PV Market report?
While the report offers comprehensive insights, it's advisable to review the specific contents or supplementary materials provided to ascertain if additional resources or data are available.
14. How can I stay updated on further developments or reports in the Crystalline Silicon Solar PV Market?
To stay informed about further developments, trends, and reports in the Crystalline Silicon Solar PV Market, consider subscribing to industry newsletters, following relevant companies and organizations, or regularly checking reputable industry news sources and publications.
Methodology
Step 1 - Identification of Relevant Samples Size from Population Database


Step 2 - Approaches for Defining Global Market Size (Value, Volume* & Price*)

Note*: In applicable scenarios
Step 3 - Data Sources
Primary Research
- Web Analytics
- Survey Reports
- Research Institute
- Latest Research Reports
- Opinion Leaders
Secondary Research
- Annual Reports
- White Paper
- Latest Press Release
- Industry Association
- Paid Database
- Investor Presentations

Step 4 - Data Triangulation
Involves using different sources of information in order to increase the validity of a study
These sources are likely to be stakeholders in a program - participants, other researchers, program staff, other community members, and so on.
Then we put all data in single framework & apply various statistical tools to find out the dynamic on the market.
During the analysis stage, feedback from the stakeholder groups would be compared to determine areas of agreement as well as areas of divergence


