
Key Insights
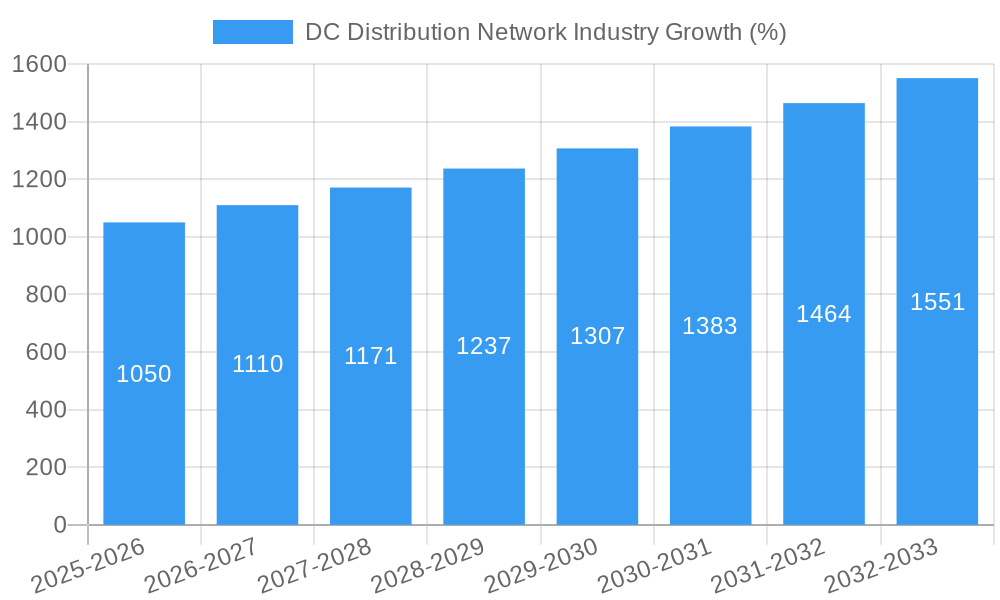
The DC Distribution Network industry is experiencing robust growth, driven by the increasing demand for reliable power in data centers, telecommunications infrastructure, and electric vehicle charging stations. The market's Compound Annual Growth Rate (CAGR) of 7.04% from 2019 to 2024 indicates a consistent upward trajectory. This expansion is fueled by several key factors: the proliferation of data centers supporting cloud computing and big data analytics; the expanding network of remote cell towers improving cellular connectivity; and the rapid adoption of electric vehicles requiring extensive fast-charging infrastructure. Furthermore, the rising adoption of renewable energy sources and the need for efficient power distribution in military applications are contributing to the market's growth. While precise market sizing for 2025 and beyond requires further data, we can project a significant expansion based on the current CAGR. Assuming a similar growth rate continues, we can anticipate substantial market expansion throughout the forecast period (2025-2033). The industry is segmented by end-user applications, with data centers, remote cell towers, and EV fast-charging systems representing significant market shares. Key players such as ABB, Siemens, and Eaton are actively investing in research and development to enhance their product offerings and cater to the evolving needs of this dynamic market.
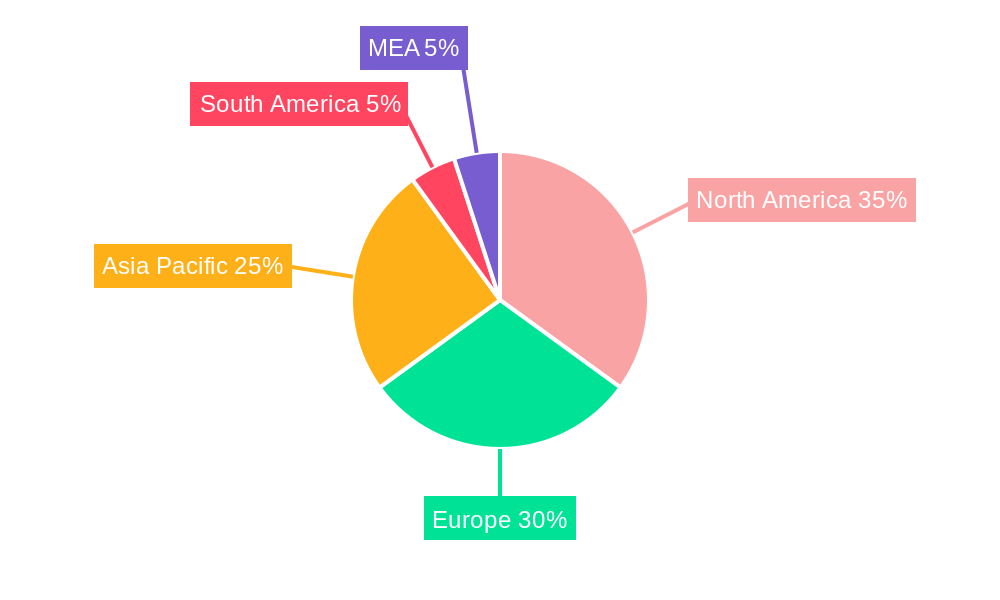
The geographic distribution of the market reveals strong growth across North America, Europe, and Asia-Pacific regions, reflecting the high concentration of data centers and technological advancements in these areas. However, emerging economies in Asia-Pacific and South America also present considerable growth potential as infrastructure development and digitalization accelerate. Competitive intensity within the industry is high, with numerous established players and emerging technology providers competing on price, performance, and innovation. While some constraints, such as supply chain disruptions and regulatory hurdles, could potentially affect market growth, the overall outlook remains optimistic given the strong underlying drivers and increasing demand for reliable and efficient DC power distribution solutions. Strategic partnerships, mergers and acquisitions, and continuous technological advancements are expected to shape the industry landscape in the coming years.
DC Distribution Network Industry: A Comprehensive Market Report (2019-2033)
This in-depth report provides a comprehensive analysis of the DC Distribution Network industry, covering market size, growth drivers, competitive landscape, and future outlook. The study period spans from 2019 to 2033, with 2025 serving as the base and estimated year. The report leverages data from the historical period (2019-2024) to project market trends during the forecast period (2025-2033). This report is crucial for industry stakeholders, investors, and strategists seeking actionable insights into this rapidly evolving sector.
DC Distribution Network Industry Market Concentration & Innovation
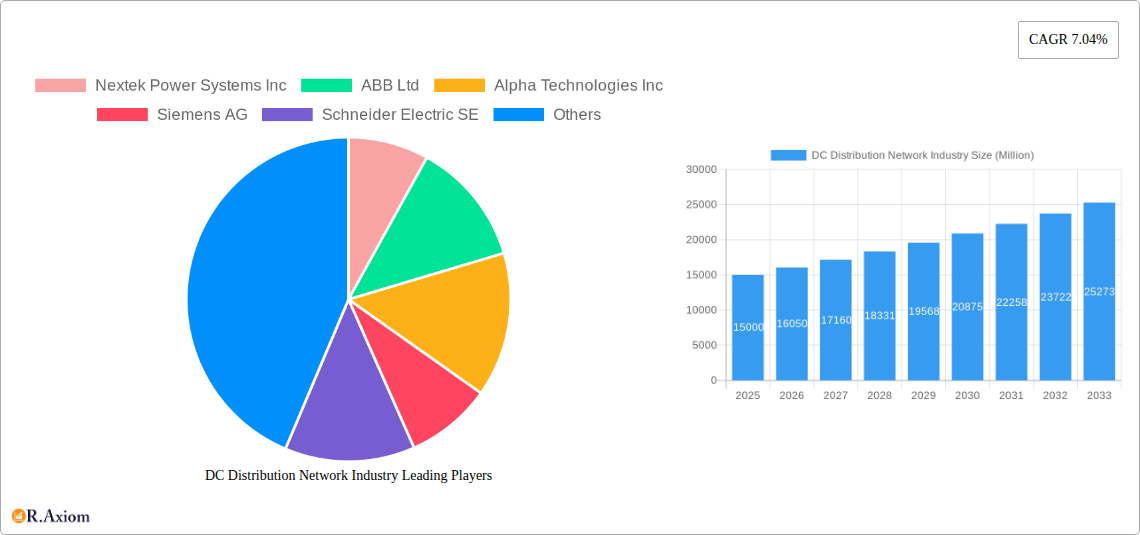
This section analyzes the competitive intensity and innovative forces shaping the DC Distribution Network market. The industry exhibits a moderately concentrated structure, with key players such as ABB Ltd, Siemens AG, Schneider Electric SE, Eaton Corporation PLC, Robert Bosch GmbH, Vertiv Group Corp, and Nextek Power Systems Inc., Alpha Technologies Inc, and Secheron Sa holding significant market share. Precise market share figures are unavailable at this time (xx%). However, analysis suggests a strong focus on innovation, driven by the increasing demand for efficient and reliable DC power distribution.
- Market Concentration: Moderately concentrated, with a few dominant players.
- Innovation Drivers: Growing demand for renewable energy integration, advancements in power electronics, and stringent environmental regulations.
- Regulatory Frameworks: Government policies promoting renewable energy and electric vehicle adoption significantly influence market growth.
- Product Substitutes: Limited direct substitutes, but AC distribution remains a significant competitor.
- End-User Trends: Shifting preferences toward efficient and sustainable energy solutions drive demand.
- M&A Activities: The market has witnessed a moderate level of M&A activity in recent years, with deal values reaching approximately USD xx Million in the past five years. These transactions often involve strategic acquisitions aimed at expanding product portfolios and geographical reach.
DC Distribution Network Industry Industry Trends & Insights
The DC Distribution Network market is experiencing robust growth, driven by several key factors. The global market is projected to witness a Compound Annual Growth Rate (CAGR) of xx% during the forecast period (2025-2033). This growth is fueled by increasing adoption of renewable energy sources, the proliferation of data centers, and the burgeoning electric vehicle (EV) charging infrastructure. Technological disruptions, such as advancements in power semiconductor devices and smart grid technologies, are further accelerating market expansion. Market penetration of DC microgrids and DC distribution systems in commercial buildings and remote areas is steadily increasing, reaching xx% in 2024 and projected to reach xx% by 2033. Competitive dynamics are characterized by intense innovation, strategic partnerships, and ongoing efforts to optimize cost efficiency and reliability.
Dominant Markets & Segments in DC Distribution Network Industry
The data center segment currently dominates the DC Distribution Network market. This dominance is attributed to the massive power requirements of data centers, coupled with the inherent advantages of DC distribution in terms of efficiency and reduced energy losses. The EV fast-charging segment is projected to experience the fastest growth during the forecast period, driven by rising EV adoption and government initiatives to expand EV charging infrastructure.
- Key Drivers for Data Center Dominance:
- High energy demand and efficiency requirements.
- Growing data center construction and capacity expansion.
- Improved energy efficiency with DC distribution.
- Key Drivers for EV Fast Charging Segment Growth:
- Rapid growth in electric vehicle sales.
- Government incentives and regulations promoting EV adoption.
- Need for high-power charging infrastructure.
- Other Important Segments:
- Remote Cell Towers: Reliable power is crucial for continuous operation, making DC distribution advantageous.
- Commercial Buildings: DC distribution offers energy savings and reduced infrastructure costs.
- Military Applications: Reliable, secure, and efficient power is paramount.
DC Distribution Network Industry Product Developments
Recent product innovations focus on enhancing efficiency, reliability, and cost-effectiveness. This includes advancements in power electronic converters, smart sensors, and digital control systems. Manufacturers are also emphasizing modular designs and improved integration capabilities, making DC distribution systems more adaptable and easily scalable to meet diverse end-user needs. The market is witnessing a shift toward compact, standardized, and readily deployable solutions, particularly for EV fast-charging infrastructure. These improvements allow for easier installation and reduced overall costs.
Report Scope & Segmentation Analysis
This report segments the DC Distribution Network market by end-user applications:
- Remote Cell Towers: This segment is experiencing steady growth driven by the expanding telecommunications network and the need for reliable power in remote locations. Market size is projected to reach USD xx Million by 2033.
- Commercial Buildings: Increasing adoption of energy-efficient technologies is driving growth in this segment. The market is expected to reach USD xx Million by 2033.
- Data Centers: This segment holds the largest market share and is expected to continue its dominance, reaching USD xx Million by 2033.
- Military Applications: The demand for reliable and secure power in military installations is driving growth in this niche segment. Market size is projected to reach USD xx Million by 2033.
- EV Fast Charging Systems: This is the fastest-growing segment, fueled by increasing EV adoption. The market is projected to reach USD xx Million by 2033.
- Other End Users: This segment includes various applications, offering a significant but fragmented market opportunity. The market is projected to reach USD xx Million by 2033.
Key Drivers of DC Distribution Network Industry Growth
The growth of the DC distribution network industry is driven by several factors:
- Increasing adoption of renewable energy sources: DC power generation from solar and wind energy is seamlessly integrated into DC distribution networks.
- Growing demand for energy efficiency: DC distribution offers higher efficiency compared to AC systems, reducing energy losses and costs.
- Government regulations and incentives: Policies promoting renewable energy and energy efficiency are driving the adoption of DC distribution systems.
- Expansion of data centers and EV charging infrastructure: These sectors are major drivers of demand for efficient and reliable DC power.
Challenges in the DC Distribution Network Industry Sector
The industry faces several challenges:
- High initial investment costs: Implementing DC distribution systems can be expensive, particularly in existing infrastructure.
- Lack of standardization: The lack of standardized components and systems can hinder interoperability and increase installation complexity.
- Limited skilled workforce: The deployment of advanced DC systems requires specialized technical expertise.
- Competition from established AC distribution technologies: AC systems remain prevalent, posing a competitive challenge to DC distribution.
Emerging Opportunities in DC Distribution Network Industry
Several emerging opportunities exist for growth:
- Smart grid integration: DC distribution systems can facilitate the integration of distributed energy resources and enhance grid stability.
- Microgrid applications: DC microgrids offer enhanced resilience and reliability in remote areas or during grid outages.
- Integration of energy storage systems: DC distribution networks can effectively integrate batteries and other energy storage solutions.
- Development of new materials and technologies: Advancements in power electronics and materials science will further enhance the efficiency and cost-effectiveness of DC distribution systems.
Leading Players in the DC Distribution Network Industry Market
- Nextek Power Systems Inc
- ABB Ltd
- Alpha Technologies Inc
- Siemens AG
- Schneider Electric SE
- Eaton Corporation PLC
- Robert Bosch GmbH
- Vertiv Group Corp
- Secheron Sa
Key Developments in DC Distribution Network Industry Industry
- March 2022: National Grid and Siemens Energy partnered to upgrade a Massachusetts substation using Siemens Energy's Blue DC circuit breakers, showcasing the adoption of innovative, eco-friendly technology. This signifies a significant step towards decarbonization within the US power grid.
- January 2022: Eaton received a USD 4.9 Million award from the US Department of Energy to develop cost-effective DC distribution solutions for fast EV charging, highlighting the government's commitment to accelerating EV adoption. This signifies a potential paradigm shift in reducing the costs associated with large scale DC fast charging infrastructure deployment.
Strategic Outlook for DC Distribution Network Industry Market
The DC Distribution Network market is poised for continued expansion, driven by the convergence of technological advancements, supportive government policies, and increasing demand from key sectors. The growing adoption of renewable energy, the proliferation of data centers, and the rapid growth of the EV charging infrastructure will create significant opportunities for industry players. Strategic partnerships, technological innovations, and a focus on cost-effectiveness will be crucial for success in this dynamic and rapidly evolving market.
DC Distribution Network Industry Segmentation
-
1. End User (Qualitative Analysis Only)
- 1.1. Remote Cell Towers
- 1.2. Commercial Buildings
- 1.3. Data Centers
- 1.4. Military Applications
- 1.5. EV Fast Charging Systems
- 1.6. Other End Users
DC Distribution Network Industry Segmentation By Geography
- 1. North America
- 2. Europe
- 3. Asia Pacific
- 4. South America
- 5. Middle East and Africa
DC Distribution Network Industry REPORT HIGHLIGHTS
| Aspects | Details |
|---|---|
| Study Period | 2019-2033 |
| Base Year | 2024 |
| Estimated Year | 2025 |
| Forecast Period | 2025-2033 |
| Historical Period | 2019-2024 |
| Growth Rate | CAGR of 7.04% from 2019-2033 |
| Segmentation |
|
Table of Contents
- 1. Introduction
- 1.1. Research Scope
- 1.2. Market Segmentation
- 1.3. Research Methodology
- 1.4. Definitions and Assumptions
- 2. Executive Summary
- 2.1. Introduction
- 3. Market Dynamics
- 3.1. Introduction
- 3.2. Market Drivers
- 3.2.1. 4.; Several Government Plans for the Energy Transition in the Region
- 3.3. Market Restrains
- 3.3.1. 4.; Increasing Adoption of Self-generated Renewable Power in the Residential and Commercial Sectors
- 3.4. Market Trends
- 3.4.1. EV Fast Charging Systems to Witness Significant Growth
- 4. Market Factor Analysis
- 4.1. Porters Five Forces
- 4.2. Supply/Value Chain
- 4.3. PESTEL analysis
- 4.4. Market Entropy
- 4.5. Patent/Trademark Analysis
- 5. Global DC Distribution Network Industry Analysis, Insights and Forecast, 2019-2031
- 5.1. Market Analysis, Insights and Forecast - by End User (Qualitative Analysis Only)
- 5.1.1. Remote Cell Towers
- 5.1.2. Commercial Buildings
- 5.1.3. Data Centers
- 5.1.4. Military Applications
- 5.1.5. EV Fast Charging Systems
- 5.1.6. Other End Users
- 5.2. Market Analysis, Insights and Forecast - by Region
- 5.2.1. North America
- 5.2.2. Europe
- 5.2.3. Asia Pacific
- 5.2.4. South America
- 5.2.5. Middle East and Africa
- 5.1. Market Analysis, Insights and Forecast - by End User (Qualitative Analysis Only)
- 6. North America DC Distribution Network Industry Analysis, Insights and Forecast, 2019-2031
- 6.1. Market Analysis, Insights and Forecast - by End User (Qualitative Analysis Only)
- 6.1.1. Remote Cell Towers
- 6.1.2. Commercial Buildings
- 6.1.3. Data Centers
- 6.1.4. Military Applications
- 6.1.5. EV Fast Charging Systems
- 6.1.6. Other End Users
- 6.1. Market Analysis, Insights and Forecast - by End User (Qualitative Analysis Only)
- 7. Europe DC Distribution Network Industry Analysis, Insights and Forecast, 2019-2031
- 7.1. Market Analysis, Insights and Forecast - by End User (Qualitative Analysis Only)
- 7.1.1. Remote Cell Towers
- 7.1.2. Commercial Buildings
- 7.1.3. Data Centers
- 7.1.4. Military Applications
- 7.1.5. EV Fast Charging Systems
- 7.1.6. Other End Users
- 7.1. Market Analysis, Insights and Forecast - by End User (Qualitative Analysis Only)
- 8. Asia Pacific DC Distribution Network Industry Analysis, Insights and Forecast, 2019-2031
- 8.1. Market Analysis, Insights and Forecast - by End User (Qualitative Analysis Only)
- 8.1.1. Remote Cell Towers
- 8.1.2. Commercial Buildings
- 8.1.3. Data Centers
- 8.1.4. Military Applications
- 8.1.5. EV Fast Charging Systems
- 8.1.6. Other End Users
- 8.1. Market Analysis, Insights and Forecast - by End User (Qualitative Analysis Only)
- 9. South America DC Distribution Network Industry Analysis, Insights and Forecast, 2019-2031
- 9.1. Market Analysis, Insights and Forecast - by End User (Qualitative Analysis Only)
- 9.1.1. Remote Cell Towers
- 9.1.2. Commercial Buildings
- 9.1.3. Data Centers
- 9.1.4. Military Applications
- 9.1.5. EV Fast Charging Systems
- 9.1.6. Other End Users
- 9.1. Market Analysis, Insights and Forecast - by End User (Qualitative Analysis Only)
- 10. Middle East and Africa DC Distribution Network Industry Analysis, Insights and Forecast, 2019-2031
- 10.1. Market Analysis, Insights and Forecast - by End User (Qualitative Analysis Only)
- 10.1.1. Remote Cell Towers
- 10.1.2. Commercial Buildings
- 10.1.3. Data Centers
- 10.1.4. Military Applications
- 10.1.5. EV Fast Charging Systems
- 10.1.6. Other End Users
- 10.1. Market Analysis, Insights and Forecast - by End User (Qualitative Analysis Only)
- 11. North America DC Distribution Network Industry Analysis, Insights and Forecast, 2019-2031
- 11.1. Market Analysis, Insights and Forecast - By Country/Sub-region
- 11.1.1 United States
- 11.1.2 Canada
- 11.1.3 Mexico
- 12. Europe DC Distribution Network Industry Analysis, Insights and Forecast, 2019-2031
- 12.1. Market Analysis, Insights and Forecast - By Country/Sub-region
- 12.1.1 Germany
- 12.1.2 United Kingdom
- 12.1.3 France
- 12.1.4 Spain
- 12.1.5 Italy
- 12.1.6 Spain
- 12.1.7 Belgium
- 12.1.8 Netherland
- 12.1.9 Nordics
- 12.1.10 Rest of Europe
- 13. Asia Pacific DC Distribution Network Industry Analysis, Insights and Forecast, 2019-2031
- 13.1. Market Analysis, Insights and Forecast - By Country/Sub-region
- 13.1.1 China
- 13.1.2 Japan
- 13.1.3 India
- 13.1.4 South Korea
- 13.1.5 Southeast Asia
- 13.1.6 Australia
- 13.1.7 Indonesia
- 13.1.8 Phillipes
- 13.1.9 Singapore
- 13.1.10 Thailandc
- 13.1.11 Rest of Asia Pacific
- 14. South America DC Distribution Network Industry Analysis, Insights and Forecast, 2019-2031
- 14.1. Market Analysis, Insights and Forecast - By Country/Sub-region
- 14.1.1 Brazil
- 14.1.2 Argentina
- 14.1.3 Peru
- 14.1.4 Chile
- 14.1.5 Colombia
- 14.1.6 Ecuador
- 14.1.7 Venezuela
- 14.1.8 Rest of South America
- 15. North America DC Distribution Network Industry Analysis, Insights and Forecast, 2019-2031
- 15.1. Market Analysis, Insights and Forecast - By Country/Sub-region
- 15.1.1 United States
- 15.1.2 Canada
- 15.1.3 Mexico
- 16. MEA DC Distribution Network Industry Analysis, Insights and Forecast, 2019-2031
- 16.1. Market Analysis, Insights and Forecast - By Country/Sub-region
- 16.1.1 United Arab Emirates
- 16.1.2 Saudi Arabia
- 16.1.3 South Africa
- 16.1.4 Rest of Middle East and Africa
- 17. Competitive Analysis
- 17.1. Global Market Share Analysis 2024
- 17.2. Company Profiles
- 17.2.1 Nextek Power Systems Inc
- 17.2.1.1. Overview
- 17.2.1.2. Products
- 17.2.1.3. SWOT Analysis
- 17.2.1.4. Recent Developments
- 17.2.1.5. Financials (Based on Availability)
- 17.2.2 ABB Ltd
- 17.2.2.1. Overview
- 17.2.2.2. Products
- 17.2.2.3. SWOT Analysis
- 17.2.2.4. Recent Developments
- 17.2.2.5. Financials (Based on Availability)
- 17.2.3 Alpha Technologies Inc
- 17.2.3.1. Overview
- 17.2.3.2. Products
- 17.2.3.3. SWOT Analysis
- 17.2.3.4. Recent Developments
- 17.2.3.5. Financials (Based on Availability)
- 17.2.4 Siemens AG
- 17.2.4.1. Overview
- 17.2.4.2. Products
- 17.2.4.3. SWOT Analysis
- 17.2.4.4. Recent Developments
- 17.2.4.5. Financials (Based on Availability)
- 17.2.5 Schneider Electric SE
- 17.2.5.1. Overview
- 17.2.5.2. Products
- 17.2.5.3. SWOT Analysis
- 17.2.5.4. Recent Developments
- 17.2.5.5. Financials (Based on Availability)
- 17.2.6 Eaton Corporation PLC
- 17.2.6.1. Overview
- 17.2.6.2. Products
- 17.2.6.3. SWOT Analysis
- 17.2.6.4. Recent Developments
- 17.2.6.5. Financials (Based on Availability)
- 17.2.7 Robert Bosch GmbH
- 17.2.7.1. Overview
- 17.2.7.2. Products
- 17.2.7.3. SWOT Analysis
- 17.2.7.4. Recent Developments
- 17.2.7.5. Financials (Based on Availability)
- 17.2.8 Vertiv Group Corp
- 17.2.8.1. Overview
- 17.2.8.2. Products
- 17.2.8.3. SWOT Analysis
- 17.2.8.4. Recent Developments
- 17.2.8.5. Financials (Based on Availability)
- 17.2.9 Secheron Sa*List Not Exhaustive
- 17.2.9.1. Overview
- 17.2.9.2. Products
- 17.2.9.3. SWOT Analysis
- 17.2.9.4. Recent Developments
- 17.2.9.5. Financials (Based on Availability)
- 17.2.1 Nextek Power Systems Inc
List of Figures
- Figure 1: Global DC Distribution Network Industry Revenue Breakdown (Million, %) by Region 2024 & 2032
- Figure 2: North America DC Distribution Network Industry Revenue (Million), by Country 2024 & 2032
- Figure 3: North America DC Distribution Network Industry Revenue Share (%), by Country 2024 & 2032
- Figure 4: Europe DC Distribution Network Industry Revenue (Million), by Country 2024 & 2032
- Figure 5: Europe DC Distribution Network Industry Revenue Share (%), by Country 2024 & 2032
- Figure 6: Asia Pacific DC Distribution Network Industry Revenue (Million), by Country 2024 & 2032
- Figure 7: Asia Pacific DC Distribution Network Industry Revenue Share (%), by Country 2024 & 2032
- Figure 8: South America DC Distribution Network Industry Revenue (Million), by Country 2024 & 2032
- Figure 9: South America DC Distribution Network Industry Revenue Share (%), by Country 2024 & 2032
- Figure 10: North America DC Distribution Network Industry Revenue (Million), by Country 2024 & 2032
- Figure 11: North America DC Distribution Network Industry Revenue Share (%), by Country 2024 & 2032
- Figure 12: MEA DC Distribution Network Industry Revenue (Million), by Country 2024 & 2032
- Figure 13: MEA DC Distribution Network Industry Revenue Share (%), by Country 2024 & 2032
- Figure 14: North America DC Distribution Network Industry Revenue (Million), by End User (Qualitative Analysis Only) 2024 & 2032
- Figure 15: North America DC Distribution Network Industry Revenue Share (%), by End User (Qualitative Analysis Only) 2024 & 2032
- Figure 16: North America DC Distribution Network Industry Revenue (Million), by Country 2024 & 2032
- Figure 17: North America DC Distribution Network Industry Revenue Share (%), by Country 2024 & 2032
- Figure 18: Europe DC Distribution Network Industry Revenue (Million), by End User (Qualitative Analysis Only) 2024 & 2032
- Figure 19: Europe DC Distribution Network Industry Revenue Share (%), by End User (Qualitative Analysis Only) 2024 & 2032
- Figure 20: Europe DC Distribution Network Industry Revenue (Million), by Country 2024 & 2032
- Figure 21: Europe DC Distribution Network Industry Revenue Share (%), by Country 2024 & 2032
- Figure 22: Asia Pacific DC Distribution Network Industry Revenue (Million), by End User (Qualitative Analysis Only) 2024 & 2032
- Figure 23: Asia Pacific DC Distribution Network Industry Revenue Share (%), by End User (Qualitative Analysis Only) 2024 & 2032
- Figure 24: Asia Pacific DC Distribution Network Industry Revenue (Million), by Country 2024 & 2032
- Figure 25: Asia Pacific DC Distribution Network Industry Revenue Share (%), by Country 2024 & 2032
- Figure 26: South America DC Distribution Network Industry Revenue (Million), by End User (Qualitative Analysis Only) 2024 & 2032
- Figure 27: South America DC Distribution Network Industry Revenue Share (%), by End User (Qualitative Analysis Only) 2024 & 2032
- Figure 28: South America DC Distribution Network Industry Revenue (Million), by Country 2024 & 2032
- Figure 29: South America DC Distribution Network Industry Revenue Share (%), by Country 2024 & 2032
- Figure 30: Middle East and Africa DC Distribution Network Industry Revenue (Million), by End User (Qualitative Analysis Only) 2024 & 2032
- Figure 31: Middle East and Africa DC Distribution Network Industry Revenue Share (%), by End User (Qualitative Analysis Only) 2024 & 2032
- Figure 32: Middle East and Africa DC Distribution Network Industry Revenue (Million), by Country 2024 & 2032
- Figure 33: Middle East and Africa DC Distribution Network Industry Revenue Share (%), by Country 2024 & 2032
List of Tables
- Table 1: Global DC Distribution Network Industry Revenue Million Forecast, by Region 2019 & 2032
- Table 2: Global DC Distribution Network Industry Revenue Million Forecast, by End User (Qualitative Analysis Only) 2019 & 2032
- Table 3: Global DC Distribution Network Industry Revenue Million Forecast, by Region 2019 & 2032
- Table 4: Global DC Distribution Network Industry Revenue Million Forecast, by Country 2019 & 2032
- Table 5: United States DC Distribution Network Industry Revenue (Million) Forecast, by Application 2019 & 2032
- Table 6: Canada DC Distribution Network Industry Revenue (Million) Forecast, by Application 2019 & 2032
- Table 7: Mexico DC Distribution Network Industry Revenue (Million) Forecast, by Application 2019 & 2032
- Table 8: Global DC Distribution Network Industry Revenue Million Forecast, by Country 2019 & 2032
- Table 9: Germany DC Distribution Network Industry Revenue (Million) Forecast, by Application 2019 & 2032
- Table 10: United Kingdom DC Distribution Network Industry Revenue (Million) Forecast, by Application 2019 & 2032
- Table 11: France DC Distribution Network Industry Revenue (Million) Forecast, by Application 2019 & 2032
- Table 12: Spain DC Distribution Network Industry Revenue (Million) Forecast, by Application 2019 & 2032
- Table 13: Italy DC Distribution Network Industry Revenue (Million) Forecast, by Application 2019 & 2032
- Table 14: Spain DC Distribution Network Industry Revenue (Million) Forecast, by Application 2019 & 2032
- Table 15: Belgium DC Distribution Network Industry Revenue (Million) Forecast, by Application 2019 & 2032
- Table 16: Netherland DC Distribution Network Industry Revenue (Million) Forecast, by Application 2019 & 2032
- Table 17: Nordics DC Distribution Network Industry Revenue (Million) Forecast, by Application 2019 & 2032
- Table 18: Rest of Europe DC Distribution Network Industry Revenue (Million) Forecast, by Application 2019 & 2032
- Table 19: Global DC Distribution Network Industry Revenue Million Forecast, by Country 2019 & 2032
- Table 20: China DC Distribution Network Industry Revenue (Million) Forecast, by Application 2019 & 2032
- Table 21: Japan DC Distribution Network Industry Revenue (Million) Forecast, by Application 2019 & 2032
- Table 22: India DC Distribution Network Industry Revenue (Million) Forecast, by Application 2019 & 2032
- Table 23: South Korea DC Distribution Network Industry Revenue (Million) Forecast, by Application 2019 & 2032
- Table 24: Southeast Asia DC Distribution Network Industry Revenue (Million) Forecast, by Application 2019 & 2032
- Table 25: Australia DC Distribution Network Industry Revenue (Million) Forecast, by Application 2019 & 2032
- Table 26: Indonesia DC Distribution Network Industry Revenue (Million) Forecast, by Application 2019 & 2032
- Table 27: Phillipes DC Distribution Network Industry Revenue (Million) Forecast, by Application 2019 & 2032
- Table 28: Singapore DC Distribution Network Industry Revenue (Million) Forecast, by Application 2019 & 2032
- Table 29: Thailandc DC Distribution Network Industry Revenue (Million) Forecast, by Application 2019 & 2032
- Table 30: Rest of Asia Pacific DC Distribution Network Industry Revenue (Million) Forecast, by Application 2019 & 2032
- Table 31: Global DC Distribution Network Industry Revenue Million Forecast, by Country 2019 & 2032
- Table 32: Brazil DC Distribution Network Industry Revenue (Million) Forecast, by Application 2019 & 2032
- Table 33: Argentina DC Distribution Network Industry Revenue (Million) Forecast, by Application 2019 & 2032
- Table 34: Peru DC Distribution Network Industry Revenue (Million) Forecast, by Application 2019 & 2032
- Table 35: Chile DC Distribution Network Industry Revenue (Million) Forecast, by Application 2019 & 2032
- Table 36: Colombia DC Distribution Network Industry Revenue (Million) Forecast, by Application 2019 & 2032
- Table 37: Ecuador DC Distribution Network Industry Revenue (Million) Forecast, by Application 2019 & 2032
- Table 38: Venezuela DC Distribution Network Industry Revenue (Million) Forecast, by Application 2019 & 2032
- Table 39: Rest of South America DC Distribution Network Industry Revenue (Million) Forecast, by Application 2019 & 2032
- Table 40: Global DC Distribution Network Industry Revenue Million Forecast, by Country 2019 & 2032
- Table 41: United States DC Distribution Network Industry Revenue (Million) Forecast, by Application 2019 & 2032
- Table 42: Canada DC Distribution Network Industry Revenue (Million) Forecast, by Application 2019 & 2032
- Table 43: Mexico DC Distribution Network Industry Revenue (Million) Forecast, by Application 2019 & 2032
- Table 44: Global DC Distribution Network Industry Revenue Million Forecast, by Country 2019 & 2032
- Table 45: United Arab Emirates DC Distribution Network Industry Revenue (Million) Forecast, by Application 2019 & 2032
- Table 46: Saudi Arabia DC Distribution Network Industry Revenue (Million) Forecast, by Application 2019 & 2032
- Table 47: South Africa DC Distribution Network Industry Revenue (Million) Forecast, by Application 2019 & 2032
- Table 48: Rest of Middle East and Africa DC Distribution Network Industry Revenue (Million) Forecast, by Application 2019 & 2032
- Table 49: Global DC Distribution Network Industry Revenue Million Forecast, by End User (Qualitative Analysis Only) 2019 & 2032
- Table 50: Global DC Distribution Network Industry Revenue Million Forecast, by Country 2019 & 2032
- Table 51: Global DC Distribution Network Industry Revenue Million Forecast, by End User (Qualitative Analysis Only) 2019 & 2032
- Table 52: Global DC Distribution Network Industry Revenue Million Forecast, by Country 2019 & 2032
- Table 53: Global DC Distribution Network Industry Revenue Million Forecast, by End User (Qualitative Analysis Only) 2019 & 2032
- Table 54: Global DC Distribution Network Industry Revenue Million Forecast, by Country 2019 & 2032
- Table 55: Global DC Distribution Network Industry Revenue Million Forecast, by End User (Qualitative Analysis Only) 2019 & 2032
- Table 56: Global DC Distribution Network Industry Revenue Million Forecast, by Country 2019 & 2032
- Table 57: Global DC Distribution Network Industry Revenue Million Forecast, by End User (Qualitative Analysis Only) 2019 & 2032
- Table 58: Global DC Distribution Network Industry Revenue Million Forecast, by Country 2019 & 2032
Frequently Asked Questions
1. What is the projected Compound Annual Growth Rate (CAGR) of the DC Distribution Network Industry?
The projected CAGR is approximately 7.04%.
2. Which companies are prominent players in the DC Distribution Network Industry?
Key companies in the market include Nextek Power Systems Inc, ABB Ltd, Alpha Technologies Inc, Siemens AG, Schneider Electric SE, Eaton Corporation PLC, Robert Bosch GmbH, Vertiv Group Corp, Secheron Sa*List Not Exhaustive.
3. What are the main segments of the DC Distribution Network Industry?
The market segments include End User (Qualitative Analysis Only) .
4. Can you provide details about the market size?
The market size is estimated to be USD XX Million as of 2022.
5. What are some drivers contributing to market growth?
4.; Several Government Plans for the Energy Transition in the Region.
6. What are the notable trends driving market growth?
EV Fast Charging Systems to Witness Significant Growth.
7. Are there any restraints impacting market growth?
4.; Increasing Adoption of Self-generated Renewable Power in the Residential and Commercial Sectors.
8. Can you provide examples of recent developments in the market?
March 2022: In line with shared commitments to decarbonize, National Grid and Siemens Energy teamed up to undertake an upgrade of a National Grid substation using Siemens Energy-designed fluorinated gas-free Blue DC circuit breakers, which are made of clean air insulation and vacuum switching technology. Scheduled for commissioning in 2023, Siemens Energy's Blue DC circuit breakers will be installed in Massachusetts at the United States substation that serves several Massachusetts communities. The first Siemens Energy Blue circuit breaker installation will be in National Grid's United States electricity network.
9. What pricing options are available for accessing the report?
Pricing options include single-user, multi-user, and enterprise licenses priced at USD 4750, USD 5250, and USD 8750 respectively.
10. Is the market size provided in terms of value or volume?
The market size is provided in terms of value, measured in Million.
11. Are there any specific market keywords associated with the report?
Yes, the market keyword associated with the report is "DC Distribution Network Industry," which aids in identifying and referencing the specific market segment covered.
12. How do I determine which pricing option suits my needs best?
The pricing options vary based on user requirements and access needs. Individual users may opt for single-user licenses, while businesses requiring broader access may choose multi-user or enterprise licenses for cost-effective access to the report.
13. Are there any additional resources or data provided in the DC Distribution Network Industry report?
While the report offers comprehensive insights, it's advisable to review the specific contents or supplementary materials provided to ascertain if additional resources or data are available.
14. How can I stay updated on further developments or reports in the DC Distribution Network Industry?
To stay informed about further developments, trends, and reports in the DC Distribution Network Industry, consider subscribing to industry newsletters, following relevant companies and organizations, or regularly checking reputable industry news sources and publications.
Methodology
Step 1 - Identification of Relevant Samples Size from Population Database


Step 2 - Approaches for Defining Global Market Size (Value, Volume* & Price*)

Note*: In applicable scenarios
Step 3 - Data Sources
Primary Research
- Web Analytics
- Survey Reports
- Research Institute
- Latest Research Reports
- Opinion Leaders
Secondary Research
- Annual Reports
- White Paper
- Latest Press Release
- Industry Association
- Paid Database
- Investor Presentations

Step 4 - Data Triangulation
Involves using different sources of information in order to increase the validity of a study
These sources are likely to be stakeholders in a program - participants, other researchers, program staff, other community members, and so on.
Then we put all data in single framework & apply various statistical tools to find out the dynamic on the market.
During the analysis stage, feedback from the stakeholder groups would be compared to determine areas of agreement as well as areas of divergence


