
Key Insights
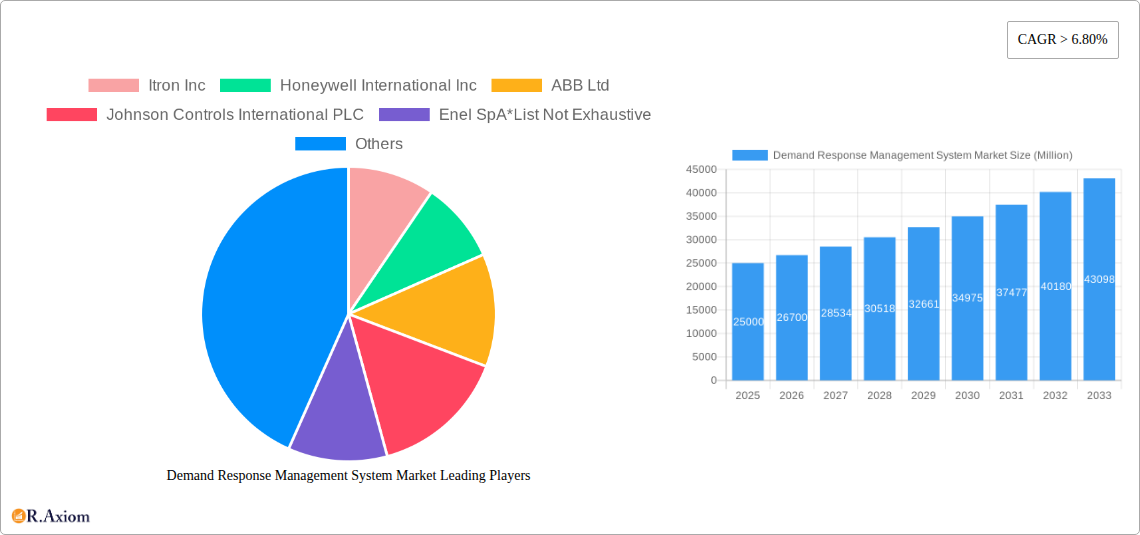
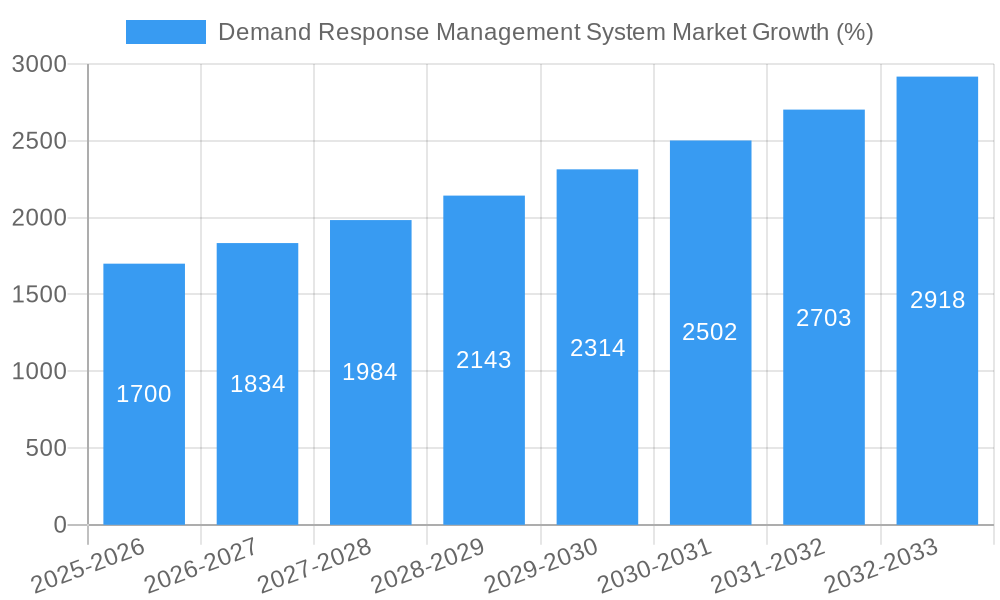
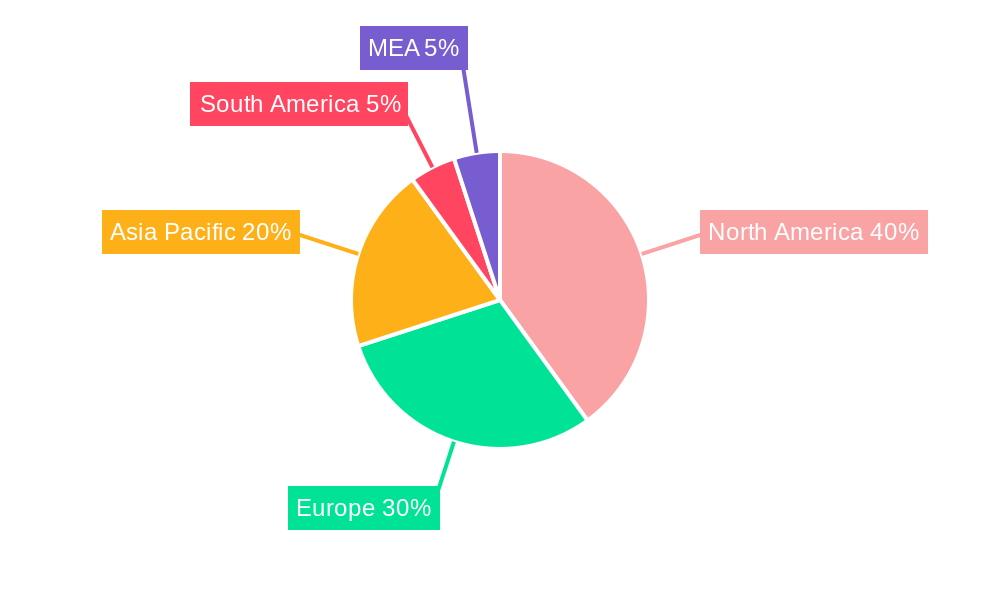
The Demand Response Management System (DRMS) market is experiencing robust growth, driven by increasing electricity prices, stringent environmental regulations promoting energy efficiency, and the integration of renewable energy sources into the grid. The market's Compound Annual Growth Rate (CAGR) exceeding 6.80% from 2019 to 2024 indicates a significant upward trajectory. This growth is fueled by the rising adoption of both conventional and automated demand response systems across various sectors, including commercial, industrial, and residential. Automated systems are gaining traction due to their enhanced efficiency and ability to optimize energy consumption in real-time, responding dynamically to grid fluctuations. The North American market, particularly the United States, currently holds a dominant share, owing to well-established infrastructure and supportive government policies. However, the Asia-Pacific region is poised for rapid expansion, driven by increasing energy demand and government initiatives promoting smart grid technologies in countries like China and India. Key players like Itron, Honeywell, ABB, and Siemens are actively investing in R&D and strategic partnerships to capitalize on this expanding market, further contributing to market expansion and innovation.
Despite the promising outlook, challenges remain. High initial investment costs for DRMS implementation can hinder adoption, particularly among smaller businesses and residential consumers. Furthermore, concerns surrounding data security and privacy related to the collection and analysis of energy consumption data need to be addressed to foster wider acceptance. However, technological advancements leading to cost reductions and improved security measures are expected to mitigate these challenges in the coming years. The increasing integration of smart meters and the development of sophisticated analytics platforms will further propel market growth throughout the forecast period (2025-2033), creating a more efficient and resilient energy grid. The market segmentation between conventional and automated systems reflects differing levels of sophistication and cost, catering to a wide range of consumer needs and budgets.
Demand Response Management System Market: A Comprehensive Report (2019-2033)
This detailed report provides a comprehensive analysis of the Demand Response Management System market, offering invaluable insights for stakeholders, investors, and industry professionals. The study period covers 2019-2033, with a base year of 2025 and a forecast period of 2025-2033. The report leverages extensive market research and data analysis to provide a clear understanding of market dynamics, trends, and future prospects. The global market is estimated to be valued at XX Million in 2025. The CAGR for the forecast period is projected at XX%.
Demand Response Management System Market Concentration & Innovation
This section analyzes the competitive landscape of the Demand Response Management System market, encompassing market concentration, innovation drivers, regulatory influences, product substitution, end-user trends, and mergers & acquisitions (M&A) activities. The market exhibits a moderately concentrated structure, with key players holding significant market share. However, the presence of numerous smaller players fosters innovation and competition.
- Market Concentration: The top 5 players account for approximately XX% of the global market share in 2025. Market share data for 2019, 2024, and projected values for 2033 are included in the full report.
- Innovation Drivers: Technological advancements, such as AI and IoT integration, are driving innovation, leading to more sophisticated and efficient demand response systems. Stringent environmental regulations and increasing energy costs also incentivize innovation.
- Regulatory Frameworks: Government policies promoting renewable energy and energy efficiency significantly influence market growth. Differing regulations across regions impact market dynamics and adoption rates.
- Product Substitutes: While there are limited direct substitutes, alternative energy solutions and energy conservation strategies pose indirect competition.
- End-User Trends: Growing awareness of energy efficiency and sustainability is driving demand among various end-users, including utilities, industrial facilities, and commercial buildings.
- M&A Activities: Consolidation within the market is observed through several strategic M&A deals. The total value of M&A deals in the last 5 years is estimated at XX Million, with notable transactions detailed within the report.
Demand Response Management System Market Industry Trends & Insights
This section delves into the key market growth drivers, technological disruptions, evolving consumer preferences, and competitive dynamics shaping the Demand Response Management System market. The market is experiencing robust growth, propelled by factors such as increasing energy prices, growing concerns regarding climate change, and supportive government policies.
The adoption of smart grids and the integration of renewable energy sources are transforming the market landscape. Technological advancements such as AI and machine learning are enhancing the capabilities of demand response systems, improving efficiency and predictive capabilities. Consumer preferences are shifting towards sustainable energy solutions, creating significant demand for advanced demand response technologies. Competitive dynamics are characterized by both consolidation and innovation, with established players investing in R&D and emerging companies introducing disruptive technologies.
Dominant Markets & Segments in Demand Response Management System Market
This section identifies the leading regions, countries, and segments within the Demand Response Management System market, focusing on System Type: Conventional Demand Response and Automated Demand Response.
System Type:
- Conventional Demand Response: This segment is characterized by manual or semi-automated methods. Growth is driven by cost-effectiveness in specific applications. Mature markets with established infrastructure dominate this segment.
- Automated Demand Response: This segment exhibits higher growth potential driven by technological advancements and automation. Factors such as ease of implementation and enhanced efficiency are key drivers. North America is a leading market for this segment.
Regional Dominance:
North America currently holds a significant market share due to advanced infrastructure and supportive regulatory frameworks. However, Asia-Pacific is expected to witness substantial growth driven by rapid industrialization and government initiatives to promote energy efficiency. Europe's market is also mature, with significant investment in smart grid technologies. Key drivers for each region are detailed with specific examples within the complete report.
Demand Response Management System Market Product Developments
Recent product innovations focus on improving system efficiency, integrating advanced analytics, and enhancing user interfaces. New applications are emerging in various sectors, including industrial automation and smart building management. The key competitive advantages stem from superior technology, scalability, and cost-effectiveness. The integration of AI and machine learning is revolutionizing demand response systems, enabling better predictive modeling and optimization.
Report Scope & Segmentation Analysis
This report segments the Demand Response Management System market primarily by System Type: Conventional Demand Response and Automated Demand Response.
Conventional Demand Response: This segment encompasses traditional methods of demand response, with growth projections influenced by cost-effectiveness and existing infrastructure. Competitive dynamics are marked by established players and a relatively mature market. The market size for this segment in 2025 is estimated at XX Million.
Automated Demand Response: This rapidly expanding segment is driven by technological advancements and increasing automation. The market size for this segment in 2025 is estimated at XX Million. The competitive landscape is dynamic, with both established and emerging players competing for market share.
Key Drivers of Demand Response Management System Market Growth
Several factors contribute to the growth of the Demand Response Management System market. Increasing energy costs are pushing consumers and businesses to adopt efficient energy management solutions. Stringent environmental regulations incentivize the adoption of cleaner energy sources and demand response technologies. Government initiatives promoting renewable energy and smart grid infrastructure also fuel market growth. Technological advancements, particularly in AI and IoT, continuously enhance the capabilities of demand response systems.
Challenges in the Demand Response Management System Market Sector
Despite strong growth prospects, the market faces several challenges. High initial investment costs can deter adoption, especially for smaller businesses. Interoperability issues between different systems can hinder seamless integration. The complexity of implementing and managing demand response programs can also pose obstacles. Cybersecurity concerns associated with interconnected smart grids require robust security measures. These challenges are estimated to impact market growth by approximately XX% in the next 5 years.
Emerging Opportunities in Demand Response Management System Market
Several emerging opportunities are shaping the future of the Demand Response Management System market. The growing adoption of electric vehicles (EVs) and their integration into smart grids present a substantial opportunity for demand response management. The increasing adoption of distributed energy resources (DERs), such as solar panels and batteries, creates new opportunities for optimizing energy consumption. The development of advanced analytics and AI-powered solutions will further improve the efficiency and effectiveness of demand response systems.
Leading Players in the Demand Response Management System Market Market
- Itron Inc
- Honeywell International Inc
- ABB Ltd
- Johnson Controls International PLC
- Enel SpA
- EnerNOC Inc
- Siemens AG
- Schneider Electric SE
- General Electric Company
- AutoGrid Systems Inc
Key Developments in Demand Response Management System Market Industry
- February 2022: Tata Consultancy Services (TCS) launched its suite of sustainability solutions, including TCS Clever Energy, focusing on demand response. This significantly boosted the market's focus on sustainability and data-driven solutions.
- July 2020: Enel X launched a demand response program in Taiwan, expanding its market reach and demonstrating the increasing global adoption of DR systems.
Strategic Outlook for Demand Response Management System Market Market
The Demand Response Management System market is poised for significant growth in the coming years. Technological advancements, supportive government policies, and increasing awareness of energy efficiency will continue to drive market expansion. The integration of AI, IoT, and big data analytics will further enhance the capabilities of demand response systems, creating new opportunities for growth. The market's future is bright, with substantial potential for innovation and expansion across various sectors and geographic regions.
Demand Response Management System Market Segmentation
-
1. System Type
- 1.1. Conventional Demand Response
- 1.2. Automated Demand Response
Demand Response Management System Market Segmentation By Geography
- 1. North America
- 2. Europe
- 3. Asia Pacific
- 4. South America
- 5. Middle East
Demand Response Management System Market REPORT HIGHLIGHTS
| Aspects | Details |
|---|---|
| Study Period | 2019-2033 |
| Base Year | 2024 |
| Estimated Year | 2025 |
| Forecast Period | 2025-2033 |
| Historical Period | 2019-2024 |
| Growth Rate | CAGR of > 6.80% from 2019-2033 |
| Segmentation |
|
Table of Contents
- 1. Introduction
- 1.1. Research Scope
- 1.2. Market Segmentation
- 1.3. Research Methodology
- 1.4. Definitions and Assumptions
- 2. Executive Summary
- 2.1. Introduction
- 3. Market Dynamics
- 3.1. Introduction
- 3.2. Market Drivers
- 3.2.1. 4.; Increasing Integration Of Renewable Energy Generation4.; Aging Power Grids And Investments In Transmission And Distribution Infrastructure
- 3.3. Market Restrains
- 3.3.1. 4.; Lack Of Investor Confidence Due To Sociopolitical Instability In Some Countries
- 3.4. Market Trends
- 3.4.1. Automated Demand Response Management System Type to Witness Significant Growth
- 4. Market Factor Analysis
- 4.1. Porters Five Forces
- 4.2. Supply/Value Chain
- 4.3. PESTEL analysis
- 4.4. Market Entropy
- 4.5. Patent/Trademark Analysis
- 5. Global Demand Response Management System Market Analysis, Insights and Forecast, 2019-2031
- 5.1. Market Analysis, Insights and Forecast - by System Type
- 5.1.1. Conventional Demand Response
- 5.1.2. Automated Demand Response
- 5.2. Market Analysis, Insights and Forecast - by Region
- 5.2.1. North America
- 5.2.2. Europe
- 5.2.3. Asia Pacific
- 5.2.4. South America
- 5.2.5. Middle East
- 5.1. Market Analysis, Insights and Forecast - by System Type
- 6. North America Demand Response Management System Market Analysis, Insights and Forecast, 2019-2031
- 6.1. Market Analysis, Insights and Forecast - by System Type
- 6.1.1. Conventional Demand Response
- 6.1.2. Automated Demand Response
- 6.1. Market Analysis, Insights and Forecast - by System Type
- 7. Europe Demand Response Management System Market Analysis, Insights and Forecast, 2019-2031
- 7.1. Market Analysis, Insights and Forecast - by System Type
- 7.1.1. Conventional Demand Response
- 7.1.2. Automated Demand Response
- 7.1. Market Analysis, Insights and Forecast - by System Type
- 8. Asia Pacific Demand Response Management System Market Analysis, Insights and Forecast, 2019-2031
- 8.1. Market Analysis, Insights and Forecast - by System Type
- 8.1.1. Conventional Demand Response
- 8.1.2. Automated Demand Response
- 8.1. Market Analysis, Insights and Forecast - by System Type
- 9. South America Demand Response Management System Market Analysis, Insights and Forecast, 2019-2031
- 9.1. Market Analysis, Insights and Forecast - by System Type
- 9.1.1. Conventional Demand Response
- 9.1.2. Automated Demand Response
- 9.1. Market Analysis, Insights and Forecast - by System Type
- 10. Middle East Demand Response Management System Market Analysis, Insights and Forecast, 2019-2031
- 10.1. Market Analysis, Insights and Forecast - by System Type
- 10.1.1. Conventional Demand Response
- 10.1.2. Automated Demand Response
- 10.1. Market Analysis, Insights and Forecast - by System Type
- 11. North America Demand Response Management System Market Analysis, Insights and Forecast, 2019-2031
- 11.1. Market Analysis, Insights and Forecast - By Country/Sub-region
- 11.1.1 United States
- 11.1.2 Canada
- 11.1.3 Mexico
- 12. Europe Demand Response Management System Market Analysis, Insights and Forecast, 2019-2031
- 12.1. Market Analysis, Insights and Forecast - By Country/Sub-region
- 12.1.1 Germany
- 12.1.2 United Kingdom
- 12.1.3 France
- 12.1.4 Spain
- 12.1.5 Italy
- 12.1.6 Spain
- 12.1.7 Belgium
- 12.1.8 Netherland
- 12.1.9 Nordics
- 12.1.10 Rest of Europe
- 13. Asia Pacific Demand Response Management System Market Analysis, Insights and Forecast, 2019-2031
- 13.1. Market Analysis, Insights and Forecast - By Country/Sub-region
- 13.1.1 China
- 13.1.2 Japan
- 13.1.3 India
- 13.1.4 South Korea
- 13.1.5 Southeast Asia
- 13.1.6 Australia
- 13.1.7 Indonesia
- 13.1.8 Phillipes
- 13.1.9 Singapore
- 13.1.10 Thailandc
- 13.1.11 Rest of Asia Pacific
- 14. South America Demand Response Management System Market Analysis, Insights and Forecast, 2019-2031
- 14.1. Market Analysis, Insights and Forecast - By Country/Sub-region
- 14.1.1 Brazil
- 14.1.2 Argentina
- 14.1.3 Peru
- 14.1.4 Chile
- 14.1.5 Colombia
- 14.1.6 Ecuador
- 14.1.7 Venezuela
- 14.1.8 Rest of South America
- 15. North America Demand Response Management System Market Analysis, Insights and Forecast, 2019-2031
- 15.1. Market Analysis, Insights and Forecast - By Country/Sub-region
- 15.1.1 United States
- 15.1.2 Canada
- 15.1.3 Mexico
- 16. MEA Demand Response Management System Market Analysis, Insights and Forecast, 2019-2031
- 16.1. Market Analysis, Insights and Forecast - By Country/Sub-region
- 16.1.1 United Arab Emirates
- 16.1.2 Saudi Arabia
- 16.1.3 South Africa
- 16.1.4 Rest of Middle East and Africa
- 17. Competitive Analysis
- 17.1. Global Market Share Analysis 2024
- 17.2. Company Profiles
- 17.2.1 Itron Inc
- 17.2.1.1. Overview
- 17.2.1.2. Products
- 17.2.1.3. SWOT Analysis
- 17.2.1.4. Recent Developments
- 17.2.1.5. Financials (Based on Availability)
- 17.2.2 Honeywell International Inc
- 17.2.2.1. Overview
- 17.2.2.2. Products
- 17.2.2.3. SWOT Analysis
- 17.2.2.4. Recent Developments
- 17.2.2.5. Financials (Based on Availability)
- 17.2.3 ABB Ltd
- 17.2.3.1. Overview
- 17.2.3.2. Products
- 17.2.3.3. SWOT Analysis
- 17.2.3.4. Recent Developments
- 17.2.3.5. Financials (Based on Availability)
- 17.2.4 Johnson Controls International PLC
- 17.2.4.1. Overview
- 17.2.4.2. Products
- 17.2.4.3. SWOT Analysis
- 17.2.4.4. Recent Developments
- 17.2.4.5. Financials (Based on Availability)
- 17.2.5 Enel SpA*List Not Exhaustive
- 17.2.5.1. Overview
- 17.2.5.2. Products
- 17.2.5.3. SWOT Analysis
- 17.2.5.4. Recent Developments
- 17.2.5.5. Financials (Based on Availability)
- 17.2.6 EnerNOC Inc
- 17.2.6.1. Overview
- 17.2.6.2. Products
- 17.2.6.3. SWOT Analysis
- 17.2.6.4. Recent Developments
- 17.2.6.5. Financials (Based on Availability)
- 17.2.7 Siemens AG
- 17.2.7.1. Overview
- 17.2.7.2. Products
- 17.2.7.3. SWOT Analysis
- 17.2.7.4. Recent Developments
- 17.2.7.5. Financials (Based on Availability)
- 17.2.8 Schneider Electric SE
- 17.2.8.1. Overview
- 17.2.8.2. Products
- 17.2.8.3. SWOT Analysis
- 17.2.8.4. Recent Developments
- 17.2.8.5. Financials (Based on Availability)
- 17.2.9 General Electric Company
- 17.2.9.1. Overview
- 17.2.9.2. Products
- 17.2.9.3. SWOT Analysis
- 17.2.9.4. Recent Developments
- 17.2.9.5. Financials (Based on Availability)
- 17.2.10 AutoGrid Systems Inc
- 17.2.10.1. Overview
- 17.2.10.2. Products
- 17.2.10.3. SWOT Analysis
- 17.2.10.4. Recent Developments
- 17.2.10.5. Financials (Based on Availability)
- 17.2.1 Itron Inc
List of Figures
- Figure 1: Global Demand Response Management System Market Revenue Breakdown (Million, %) by Region 2024 & 2032
- Figure 2: North America Demand Response Management System Market Revenue (Million), by Country 2024 & 2032
- Figure 3: North America Demand Response Management System Market Revenue Share (%), by Country 2024 & 2032
- Figure 4: Europe Demand Response Management System Market Revenue (Million), by Country 2024 & 2032
- Figure 5: Europe Demand Response Management System Market Revenue Share (%), by Country 2024 & 2032
- Figure 6: Asia Pacific Demand Response Management System Market Revenue (Million), by Country 2024 & 2032
- Figure 7: Asia Pacific Demand Response Management System Market Revenue Share (%), by Country 2024 & 2032
- Figure 8: South America Demand Response Management System Market Revenue (Million), by Country 2024 & 2032
- Figure 9: South America Demand Response Management System Market Revenue Share (%), by Country 2024 & 2032
- Figure 10: North America Demand Response Management System Market Revenue (Million), by Country 2024 & 2032
- Figure 11: North America Demand Response Management System Market Revenue Share (%), by Country 2024 & 2032
- Figure 12: MEA Demand Response Management System Market Revenue (Million), by Country 2024 & 2032
- Figure 13: MEA Demand Response Management System Market Revenue Share (%), by Country 2024 & 2032
- Figure 14: North America Demand Response Management System Market Revenue (Million), by System Type 2024 & 2032
- Figure 15: North America Demand Response Management System Market Revenue Share (%), by System Type 2024 & 2032
- Figure 16: North America Demand Response Management System Market Revenue (Million), by Country 2024 & 2032
- Figure 17: North America Demand Response Management System Market Revenue Share (%), by Country 2024 & 2032
- Figure 18: Europe Demand Response Management System Market Revenue (Million), by System Type 2024 & 2032
- Figure 19: Europe Demand Response Management System Market Revenue Share (%), by System Type 2024 & 2032
- Figure 20: Europe Demand Response Management System Market Revenue (Million), by Country 2024 & 2032
- Figure 21: Europe Demand Response Management System Market Revenue Share (%), by Country 2024 & 2032
- Figure 22: Asia Pacific Demand Response Management System Market Revenue (Million), by System Type 2024 & 2032
- Figure 23: Asia Pacific Demand Response Management System Market Revenue Share (%), by System Type 2024 & 2032
- Figure 24: Asia Pacific Demand Response Management System Market Revenue (Million), by Country 2024 & 2032
- Figure 25: Asia Pacific Demand Response Management System Market Revenue Share (%), by Country 2024 & 2032
- Figure 26: South America Demand Response Management System Market Revenue (Million), by System Type 2024 & 2032
- Figure 27: South America Demand Response Management System Market Revenue Share (%), by System Type 2024 & 2032
- Figure 28: South America Demand Response Management System Market Revenue (Million), by Country 2024 & 2032
- Figure 29: South America Demand Response Management System Market Revenue Share (%), by Country 2024 & 2032
- Figure 30: Middle East Demand Response Management System Market Revenue (Million), by System Type 2024 & 2032
- Figure 31: Middle East Demand Response Management System Market Revenue Share (%), by System Type 2024 & 2032
- Figure 32: Middle East Demand Response Management System Market Revenue (Million), by Country 2024 & 2032
- Figure 33: Middle East Demand Response Management System Market Revenue Share (%), by Country 2024 & 2032
List of Tables
- Table 1: Global Demand Response Management System Market Revenue Million Forecast, by Region 2019 & 2032
- Table 2: Global Demand Response Management System Market Revenue Million Forecast, by System Type 2019 & 2032
- Table 3: Global Demand Response Management System Market Revenue Million Forecast, by Region 2019 & 2032
- Table 4: Global Demand Response Management System Market Revenue Million Forecast, by Country 2019 & 2032
- Table 5: United States Demand Response Management System Market Revenue (Million) Forecast, by Application 2019 & 2032
- Table 6: Canada Demand Response Management System Market Revenue (Million) Forecast, by Application 2019 & 2032
- Table 7: Mexico Demand Response Management System Market Revenue (Million) Forecast, by Application 2019 & 2032
- Table 8: Global Demand Response Management System Market Revenue Million Forecast, by Country 2019 & 2032
- Table 9: Germany Demand Response Management System Market Revenue (Million) Forecast, by Application 2019 & 2032
- Table 10: United Kingdom Demand Response Management System Market Revenue (Million) Forecast, by Application 2019 & 2032
- Table 11: France Demand Response Management System Market Revenue (Million) Forecast, by Application 2019 & 2032
- Table 12: Spain Demand Response Management System Market Revenue (Million) Forecast, by Application 2019 & 2032
- Table 13: Italy Demand Response Management System Market Revenue (Million) Forecast, by Application 2019 & 2032
- Table 14: Spain Demand Response Management System Market Revenue (Million) Forecast, by Application 2019 & 2032
- Table 15: Belgium Demand Response Management System Market Revenue (Million) Forecast, by Application 2019 & 2032
- Table 16: Netherland Demand Response Management System Market Revenue (Million) Forecast, by Application 2019 & 2032
- Table 17: Nordics Demand Response Management System Market Revenue (Million) Forecast, by Application 2019 & 2032
- Table 18: Rest of Europe Demand Response Management System Market Revenue (Million) Forecast, by Application 2019 & 2032
- Table 19: Global Demand Response Management System Market Revenue Million Forecast, by Country 2019 & 2032
- Table 20: China Demand Response Management System Market Revenue (Million) Forecast, by Application 2019 & 2032
- Table 21: Japan Demand Response Management System Market Revenue (Million) Forecast, by Application 2019 & 2032
- Table 22: India Demand Response Management System Market Revenue (Million) Forecast, by Application 2019 & 2032
- Table 23: South Korea Demand Response Management System Market Revenue (Million) Forecast, by Application 2019 & 2032
- Table 24: Southeast Asia Demand Response Management System Market Revenue (Million) Forecast, by Application 2019 & 2032
- Table 25: Australia Demand Response Management System Market Revenue (Million) Forecast, by Application 2019 & 2032
- Table 26: Indonesia Demand Response Management System Market Revenue (Million) Forecast, by Application 2019 & 2032
- Table 27: Phillipes Demand Response Management System Market Revenue (Million) Forecast, by Application 2019 & 2032
- Table 28: Singapore Demand Response Management System Market Revenue (Million) Forecast, by Application 2019 & 2032
- Table 29: Thailandc Demand Response Management System Market Revenue (Million) Forecast, by Application 2019 & 2032
- Table 30: Rest of Asia Pacific Demand Response Management System Market Revenue (Million) Forecast, by Application 2019 & 2032
- Table 31: Global Demand Response Management System Market Revenue Million Forecast, by Country 2019 & 2032
- Table 32: Brazil Demand Response Management System Market Revenue (Million) Forecast, by Application 2019 & 2032
- Table 33: Argentina Demand Response Management System Market Revenue (Million) Forecast, by Application 2019 & 2032
- Table 34: Peru Demand Response Management System Market Revenue (Million) Forecast, by Application 2019 & 2032
- Table 35: Chile Demand Response Management System Market Revenue (Million) Forecast, by Application 2019 & 2032
- Table 36: Colombia Demand Response Management System Market Revenue (Million) Forecast, by Application 2019 & 2032
- Table 37: Ecuador Demand Response Management System Market Revenue (Million) Forecast, by Application 2019 & 2032
- Table 38: Venezuela Demand Response Management System Market Revenue (Million) Forecast, by Application 2019 & 2032
- Table 39: Rest of South America Demand Response Management System Market Revenue (Million) Forecast, by Application 2019 & 2032
- Table 40: Global Demand Response Management System Market Revenue Million Forecast, by Country 2019 & 2032
- Table 41: United States Demand Response Management System Market Revenue (Million) Forecast, by Application 2019 & 2032
- Table 42: Canada Demand Response Management System Market Revenue (Million) Forecast, by Application 2019 & 2032
- Table 43: Mexico Demand Response Management System Market Revenue (Million) Forecast, by Application 2019 & 2032
- Table 44: Global Demand Response Management System Market Revenue Million Forecast, by Country 2019 & 2032
- Table 45: United Arab Emirates Demand Response Management System Market Revenue (Million) Forecast, by Application 2019 & 2032
- Table 46: Saudi Arabia Demand Response Management System Market Revenue (Million) Forecast, by Application 2019 & 2032
- Table 47: South Africa Demand Response Management System Market Revenue (Million) Forecast, by Application 2019 & 2032
- Table 48: Rest of Middle East and Africa Demand Response Management System Market Revenue (Million) Forecast, by Application 2019 & 2032
- Table 49: Global Demand Response Management System Market Revenue Million Forecast, by System Type 2019 & 2032
- Table 50: Global Demand Response Management System Market Revenue Million Forecast, by Country 2019 & 2032
- Table 51: Global Demand Response Management System Market Revenue Million Forecast, by System Type 2019 & 2032
- Table 52: Global Demand Response Management System Market Revenue Million Forecast, by Country 2019 & 2032
- Table 53: Global Demand Response Management System Market Revenue Million Forecast, by System Type 2019 & 2032
- Table 54: Global Demand Response Management System Market Revenue Million Forecast, by Country 2019 & 2032
- Table 55: Global Demand Response Management System Market Revenue Million Forecast, by System Type 2019 & 2032
- Table 56: Global Demand Response Management System Market Revenue Million Forecast, by Country 2019 & 2032
- Table 57: Global Demand Response Management System Market Revenue Million Forecast, by System Type 2019 & 2032
- Table 58: Global Demand Response Management System Market Revenue Million Forecast, by Country 2019 & 2032
Frequently Asked Questions
1. What is the projected Compound Annual Growth Rate (CAGR) of the Demand Response Management System Market?
The projected CAGR is approximately > 6.80%.
2. Which companies are prominent players in the Demand Response Management System Market?
Key companies in the market include Itron Inc, Honeywell International Inc, ABB Ltd, Johnson Controls International PLC, Enel SpA*List Not Exhaustive, EnerNOC Inc, Siemens AG, Schneider Electric SE, General Electric Company, AutoGrid Systems Inc.
3. What are the main segments of the Demand Response Management System Market?
The market segments include System Type.
4. Can you provide details about the market size?
The market size is estimated to be USD XX Million as of 2022.
5. What are some drivers contributing to market growth?
4.; Increasing Integration Of Renewable Energy Generation4.; Aging Power Grids And Investments In Transmission And Distribution Infrastructure.
6. What are the notable trends driving market growth?
Automated Demand Response Management System Type to Witness Significant Growth.
7. Are there any restraints impacting market growth?
4.; Lack Of Investor Confidence Due To Sociopolitical Instability In Some Countries.
8. Can you provide examples of recent developments in the market?
In February 2022, Tata Consultancy Services (TCS) offered its suite of sustainability solutions consisting of TCS Clever Energy, Intelligent Power Plant, and TCS Envirozone to help organizations gain insights into energy usage and reduce waste and emissions. TCS Clever Energy addresses various key functions, including demand response.
9. What pricing options are available for accessing the report?
Pricing options include single-user, multi-user, and enterprise licenses priced at USD 4750, USD 5250, and USD 8750 respectively.
10. Is the market size provided in terms of value or volume?
The market size is provided in terms of value, measured in Million.
11. Are there any specific market keywords associated with the report?
Yes, the market keyword associated with the report is "Demand Response Management System Market," which aids in identifying and referencing the specific market segment covered.
12. How do I determine which pricing option suits my needs best?
The pricing options vary based on user requirements and access needs. Individual users may opt for single-user licenses, while businesses requiring broader access may choose multi-user or enterprise licenses for cost-effective access to the report.
13. Are there any additional resources or data provided in the Demand Response Management System Market report?
While the report offers comprehensive insights, it's advisable to review the specific contents or supplementary materials provided to ascertain if additional resources or data are available.
14. How can I stay updated on further developments or reports in the Demand Response Management System Market?
To stay informed about further developments, trends, and reports in the Demand Response Management System Market, consider subscribing to industry newsletters, following relevant companies and organizations, or regularly checking reputable industry news sources and publications.
Methodology
Step 1 - Identification of Relevant Samples Size from Population Database


Step 2 - Approaches for Defining Global Market Size (Value, Volume* & Price*)

Note*: In applicable scenarios
Step 3 - Data Sources
Primary Research
- Web Analytics
- Survey Reports
- Research Institute
- Latest Research Reports
- Opinion Leaders
Secondary Research
- Annual Reports
- White Paper
- Latest Press Release
- Industry Association
- Paid Database
- Investor Presentations

Step 4 - Data Triangulation
Involves using different sources of information in order to increase the validity of a study
These sources are likely to be stakeholders in a program - participants, other researchers, program staff, other community members, and so on.
Then we put all data in single framework & apply various statistical tools to find out the dynamic on the market.
During the analysis stage, feedback from the stakeholder groups would be compared to determine areas of agreement as well as areas of divergence


