
Key Insights
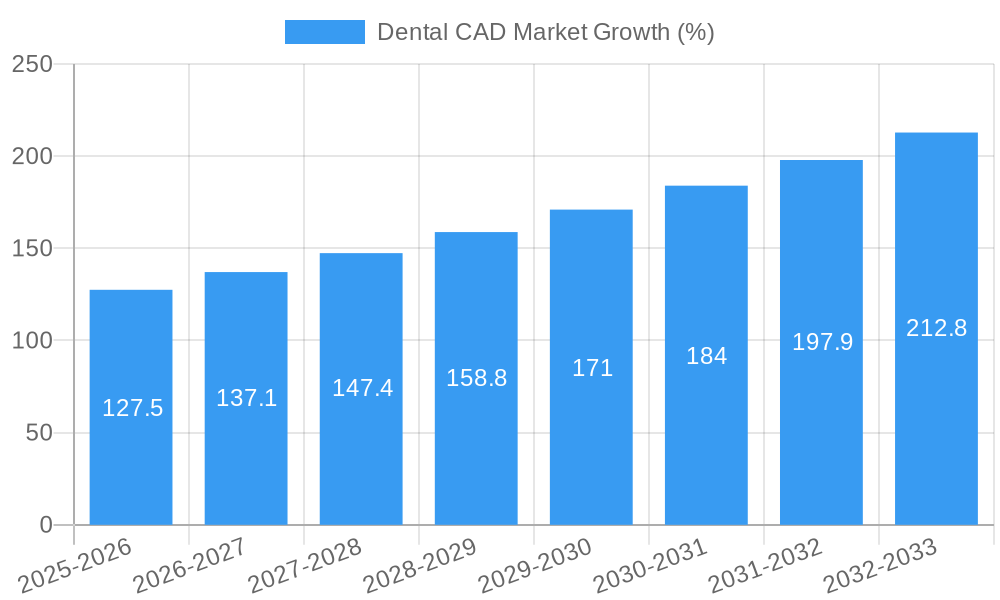
The global dental CAD market is experiencing robust growth, driven by the increasing prevalence of dental procedures, technological advancements in CAD/CAM systems, and a rising demand for aesthetically pleasing and precise restorations. The market's compound annual growth rate (CAGR) of 8.50% from 2019 to 2024 suggests a significant expansion, which is projected to continue into the forecast period (2025-2033). Key drivers include the increasing adoption of digital dentistry workflows, improving accuracy and efficiency of dental treatments, and the growing preference for minimally invasive procedures. The market segmentation reveals a strong demand for both scanners and milling machines, with software solutions also playing a crucial role in streamlining the overall process. Dental prosthesis and implants are the major application areas, reflecting the substantial use of CAD/CAM technology in restorative and implant dentistry. The competitive landscape is marked by the presence of both established players like Planmeca Oy, Dentsply Sirona, and 3Shape, and emerging companies focusing on innovative solutions. Geographic analysis indicates strong growth across North America and Europe, driven by advanced healthcare infrastructure and high adoption rates of digital technologies. The Asia-Pacific region also presents significant opportunities given the growing middle class and increasing awareness of aesthetic dentistry. However, high initial investment costs associated with CAD/CAM systems and a lack of skilled professionals in some regions may act as potential restraints to market growth. Nevertheless, the long-term outlook remains positive, with continued technological innovation expected to further propel the market forward.
The future of the dental CAD market hinges on several key factors. Further miniaturization and integration of CAD/CAM systems will lead to improved workflow efficiency and accessibility. The increasing development of AI-powered diagnostic and treatment planning tools will enhance the precision and predictability of dental restorations. Expansion into emerging markets through strategic partnerships and affordable solutions will also significantly contribute to growth. Moreover, the growing focus on personalized medicine and patient-specific solutions will further increase the demand for CAD/CAM technology in the dental industry. Continuous research and development focused on biocompatible materials and improved software capabilities will ensure the market's continued expansion and adaptation to the evolving needs of dentists and patients. We anticipate the market will see continued consolidation among players, with larger companies potentially acquiring smaller firms to strengthen their portfolios and expand their global reach.
This comprehensive report provides a detailed analysis of the Dental CAD market, encompassing market size, growth drivers, competitive landscape, and future trends. With a study period spanning from 2019 to 2033, a base year of 2025, and a forecast period of 2025-2033, this report is an invaluable resource for industry stakeholders, investors, and researchers seeking a comprehensive understanding of this dynamic market. The report leverages extensive primary and secondary research, incorporating data from key players, industry experts, and regulatory bodies. The total market value is projected to reach xx Million by 2033, exhibiting a CAGR of xx% during the forecast period.
Dental CAD Market Concentration & Innovation
The Dental CAD market is characterized by a moderately concentrated landscape with several major players holding significant market share. Key players such as Dentsply Sirona and 3Shape dominate the market, holding a combined market share of approximately xx%. However, smaller companies and innovative startups are constantly entering the market, presenting both opportunities and challenges for established players.
Market Concentration Metrics:
- Top 5 Players Market Share: xx%
- Herfindahl-Hirschman Index (HHI): xx (indicating a moderately concentrated market)
Innovation Drivers:
- Advancements in CAD/CAM software and hardware leading to increased efficiency and accuracy.
- The rising adoption of digital dentistry and the increasing demand for aesthetically pleasing and precise dental restorations.
- Continuous research and development in biocompatible materials and manufacturing processes.
Regulatory Frameworks & Product Substitutes:
The market is subject to various regulatory approvals and certifications to ensure safety and efficacy. Traditional methods of dental restoration represent the primary substitute, but the shift towards digital technology continues to erode their market share.
End-User Trends & M&A Activities:
The increasing demand for minimally invasive procedures and patient-centric care drives the adoption of Dental CAD technology. Significant M&A activities have been observed in recent years, with deal values totaling xx Million over the past five years, reflecting consolidation efforts and strategic acquisitions within the market.
Dental CAD Market Industry Trends & Insights
The Dental CAD market is experiencing robust growth, driven by several key factors. The increasing prevalence of dental diseases, coupled with a growing awareness of cosmetic dentistry, fuels demand for advanced restorative solutions. Technological advancements, such as the integration of artificial intelligence (AI) and machine learning (ML), are enhancing the efficiency and accuracy of CAD/CAM systems. Furthermore, the rising adoption of cloud-based software solutions is streamlining workflows and improving collaboration among dental professionals. Consumer preferences are shifting towards minimally invasive, aesthetically pleasing, and long-lasting dental restorations, further propelling market growth. Competitive dynamics are intense, with leading players focusing on product innovation, strategic partnerships, and geographical expansion to gain a competitive edge.
The market penetration of CAD/CAM technology in dental laboratories and clinics is steadily increasing, currently estimated at approximately xx%, projected to reach xx% by 2033. The Compound Annual Growth Rate (CAGR) of the Dental CAD market is expected to be xx% during the forecast period (2025-2033).
Dominant Markets & Segments in Dental CAD Market
Geographic Dominance:
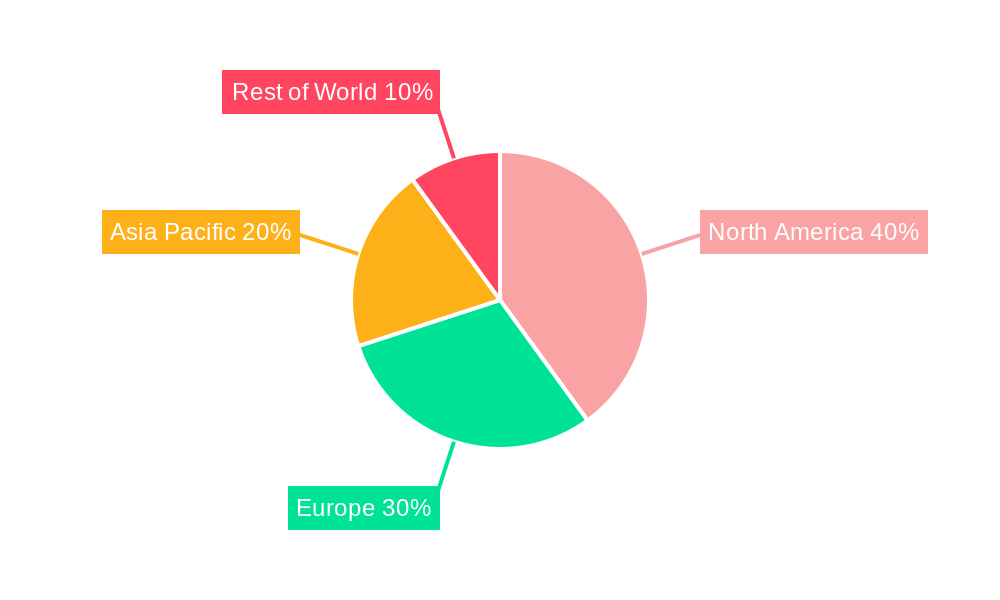
North America currently holds the largest market share, followed by Europe and Asia-Pacific. This is driven by high healthcare expenditure, advanced dental infrastructure, and a high adoption rate of advanced dental technologies.
Segment Dominance:
- By Component: The software segment is experiencing the fastest growth due to ongoing innovations and the rising demand for efficient and user-friendly software solutions. The scanners segment holds the largest market share due to their crucial role in digital workflow.
- By Application: Dental prosthesis accounts for a larger market share due to higher demand compared to dental implants. However, the implants segment is projected to grow at a faster rate due to the rising prevalence of tooth loss and advancements in implant technology.
Key Drivers (By Region/Segment):
- North America: High disposable income, advanced healthcare infrastructure, and favorable regulatory environment.
- Europe: Growing awareness of cosmetic dentistry, increased focus on digital dentistry initiatives, and government support for healthcare innovation.
- Asia-Pacific: Rising disposable incomes, expanding healthcare infrastructure, and growing adoption of advanced medical technologies.
- Scanners: High demand due to their critical role in digital workflow and the development of innovative intraoral scanning technology.
- Software: High growth potential driven by the rising demand for user-friendly, efficient software, and ongoing innovation in CAD/CAM design and manufacturing software.
Dental CAD Market Product Developments
Recent product innovations in the Dental CAD market showcase a trend towards enhanced accuracy, speed, and user-friendliness. New software modules offer streamlined workflows, while improvements in milling machines ensure faster and more precise fabrication of dental restorations. These innovations are improving efficiency, reducing treatment times, and enhancing the overall patient experience. This trend indicates a significant market fit, as dentists and dental laboratories seek to optimize their operations and deliver high-quality patient care.
Report Scope & Segmentation Analysis
This report provides a comprehensive analysis of the Dental CAD market, segmented by component (scanners, milling machines, software, other components) and application (dental prosthesis, dental implants). Each segment is analyzed based on its market size, growth rate, and competitive dynamics. The report includes detailed projections for each segment, providing valuable insights into future market trends. The software segment exhibits the highest growth potential due to continued innovation and increasing demand for user-friendly solutions, while the scanners segment retains the largest market share due to their indispensable role in digital workflows. The dental prosthesis application currently holds a larger market share than dental implants; however, the dental implant segment displays a higher growth projection driven by the expanding prevalence of tooth loss and technological advancements.
Key Drivers of Dental CAD Market Growth
The growth of the Dental CAD market is propelled by several key factors:
- Technological advancements in CAD/CAM technology, leading to increased precision, speed, and efficiency.
- Rising adoption of digital dentistry, which simplifies workflows and improves patient care.
- Growing awareness of cosmetic dentistry and the demand for aesthetically pleasing restorations.
- Increased prevalence of dental diseases, leading to a higher demand for restorative solutions.
- Favorable regulatory environment supporting innovation and adoption of advanced dental technologies.
Challenges in the Dental CAD Market Sector
The Dental CAD market faces several challenges, including:
- High initial investment costs for CAD/CAM systems, hindering adoption among smaller dental practices.
- Complexity of software and hardware, requiring substantial training and expertise.
- Potential supply chain disruptions affecting the availability of key components.
- Intense competition among established players and emerging companies.
- Regulatory hurdles and compliance requirements varying across different geographic regions. These factors could lead to a xx% reduction in market growth if not effectively addressed.
Emerging Opportunities in Dental CAD Market
The Dental CAD market presents several emerging opportunities:
- Integration of artificial intelligence (AI) and machine learning (ML) to enhance the accuracy and efficiency of CAD/CAM systems.
- Development of more biocompatible and aesthetically pleasing materials for dental restorations.
- Expansion into emerging markets with growing demand for advanced dental care.
- Development of cloud-based software solutions to facilitate collaboration and streamline workflows.
- Personalized and customized dental solutions tailored to individual patient needs.
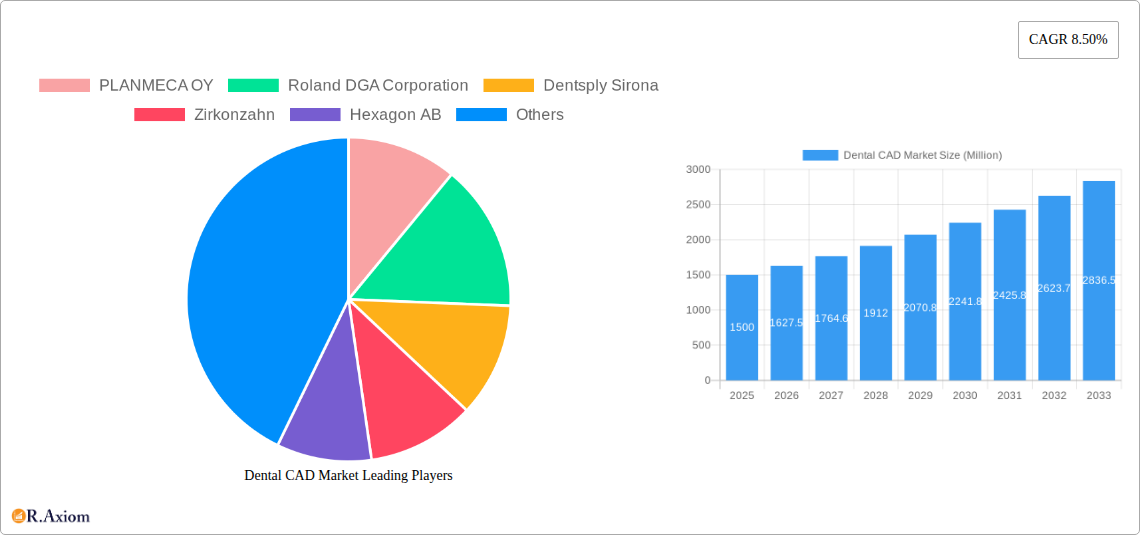
Leading Players in the Dental CAD Market Market
- PLANMECA OY
- Roland DGA Corporation
- Dentsply Sirona
- Zirkonzahn
- Hexagon AB
- Kelkar Dynamics LLP
- Amann Girrbach AG
- Carestream Dental LLC
- 3Shape
- Align Technology Inc
- Envista Holdings Corporation
- Datron AG
- Institut Straumann AG
- ZimVie Inc
Key Developments in Dental CAD Market Industry
- September 2022: Planmeca launched a new software module for Planmeca Romexis, simplifying digital impression workflows.
- April 2022: Dentsply Sirona released inLab Software 22.0, featuring a harmonized user interface and enhanced design options.
Strategic Outlook for Dental CAD Market Market
The Dental CAD market is poised for continued growth, driven by technological advancements, increasing demand for advanced dental solutions, and favorable regulatory environments. The integration of AI and ML, coupled with the development of innovative materials and processes, will further enhance the efficiency and precision of CAD/CAM systems. Expansion into emerging markets and the rising adoption of cloud-based solutions will create additional growth opportunities for market players. The future of the Dental CAD market is bright, with significant potential for innovation and expansion.
Dental CAD Market Segmentation
-
1. Component
- 1.1. Scanners
- 1.2. Milling Machines
- 1.3. Software
- 1.4. Other Components
-
2. Application
- 2.1. Dental Prosthesis
- 2.2. Dental Implants
Dental CAD Market Segmentation By Geography
-
1. North America
- 1.1. United States
- 1.2. Canada
- 1.3. Mexico
-
2. Europe
- 2.1. Germany
- 2.2. United Kingdom
- 2.3. France
- 2.4. Italy
- 2.5. Spain
- 2.6. Rest of Europe
-
3. Asia Pacific
- 3.1. China
- 3.2. Japan
- 3.3. India
- 3.4. Australia
- 3.5. South Korea
- 3.6. Rest of Asia Pacific
-
4. Middle East and Africa
- 4.1. GCC
- 4.2. South Africa
- 4.3. Rest of Middle East and Africa
-
5. South America
- 5.1. Brazil
- 5.2. Argentina
- 5.3. Rest of South America
Dental CAD Market REPORT HIGHLIGHTS
| Aspects | Details |
|---|---|
| Study Period | 2019-2033 |
| Base Year | 2024 |
| Estimated Year | 2025 |
| Forecast Period | 2025-2033 |
| Historical Period | 2019-2024 |
| Growth Rate | CAGR of 8.50% from 2019-2033 |
| Segmentation |
|
Table of Contents
- 1. Introduction
- 1.1. Research Scope
- 1.2. Market Segmentation
- 1.3. Research Methodology
- 1.4. Definitions and Assumptions
- 2. Executive Summary
- 2.1. Introduction
- 3. Market Dynamics
- 3.1. Introduction
- 3.2. Market Drivers
- 3.2.1. Increasing Burden of Oral Diseases And Ageing Population; Technological Advancements in Dental Imaging Methodologies
- 3.3. Market Restrains
- 3.3.1. Excessive Costs Involved in Private Health Insurance
- 3.4. Market Trends
- 3.4.1. The Scanners Segment is Expected to Hold Significant Share in Dental CAD Market Over the Forecast Period
- 4. Market Factor Analysis
- 4.1. Porters Five Forces
- 4.2. Supply/Value Chain
- 4.3. PESTEL analysis
- 4.4. Market Entropy
- 4.5. Patent/Trademark Analysis
- 5. Global Dental CAD Market Analysis, Insights and Forecast, 2019-2031
- 5.1. Market Analysis, Insights and Forecast - by Component
- 5.1.1. Scanners
- 5.1.2. Milling Machines
- 5.1.3. Software
- 5.1.4. Other Components
- 5.2. Market Analysis, Insights and Forecast - by Application
- 5.2.1. Dental Prosthesis
- 5.2.2. Dental Implants
- 5.3. Market Analysis, Insights and Forecast - by Region
- 5.3.1. North America
- 5.3.2. Europe
- 5.3.3. Asia Pacific
- 5.3.4. Middle East and Africa
- 5.3.5. South America
- 5.1. Market Analysis, Insights and Forecast - by Component
- 6. North America Dental CAD Market Analysis, Insights and Forecast, 2019-2031
- 6.1. Market Analysis, Insights and Forecast - by Component
- 6.1.1. Scanners
- 6.1.2. Milling Machines
- 6.1.3. Software
- 6.1.4. Other Components
- 6.2. Market Analysis, Insights and Forecast - by Application
- 6.2.1. Dental Prosthesis
- 6.2.2. Dental Implants
- 6.1. Market Analysis, Insights and Forecast - by Component
- 7. Europe Dental CAD Market Analysis, Insights and Forecast, 2019-2031
- 7.1. Market Analysis, Insights and Forecast - by Component
- 7.1.1. Scanners
- 7.1.2. Milling Machines
- 7.1.3. Software
- 7.1.4. Other Components
- 7.2. Market Analysis, Insights and Forecast - by Application
- 7.2.1. Dental Prosthesis
- 7.2.2. Dental Implants
- 7.1. Market Analysis, Insights and Forecast - by Component
- 8. Asia Pacific Dental CAD Market Analysis, Insights and Forecast, 2019-2031
- 8.1. Market Analysis, Insights and Forecast - by Component
- 8.1.1. Scanners
- 8.1.2. Milling Machines
- 8.1.3. Software
- 8.1.4. Other Components
- 8.2. Market Analysis, Insights and Forecast - by Application
- 8.2.1. Dental Prosthesis
- 8.2.2. Dental Implants
- 8.1. Market Analysis, Insights and Forecast - by Component
- 9. Middle East and Africa Dental CAD Market Analysis, Insights and Forecast, 2019-2031
- 9.1. Market Analysis, Insights and Forecast - by Component
- 9.1.1. Scanners
- 9.1.2. Milling Machines
- 9.1.3. Software
- 9.1.4. Other Components
- 9.2. Market Analysis, Insights and Forecast - by Application
- 9.2.1. Dental Prosthesis
- 9.2.2. Dental Implants
- 9.1. Market Analysis, Insights and Forecast - by Component
- 10. South America Dental CAD Market Analysis, Insights and Forecast, 2019-2031
- 10.1. Market Analysis, Insights and Forecast - by Component
- 10.1.1. Scanners
- 10.1.2. Milling Machines
- 10.1.3. Software
- 10.1.4. Other Components
- 10.2. Market Analysis, Insights and Forecast - by Application
- 10.2.1. Dental Prosthesis
- 10.2.2. Dental Implants
- 10.1. Market Analysis, Insights and Forecast - by Component
- 11. North America Dental CAD Market Analysis, Insights and Forecast, 2019-2031
- 11.1. Market Analysis, Insights and Forecast - By Country/Sub-region
- 11.1.1 United States
- 11.1.2 Canada
- 11.1.3 Mexico
- 12. Europe Dental CAD Market Analysis, Insights and Forecast, 2019-2031
- 12.1. Market Analysis, Insights and Forecast - By Country/Sub-region
- 12.1.1 Germany
- 12.1.2 United Kingdom
- 12.1.3 France
- 12.1.4 Italy
- 12.1.5 Spain
- 12.1.6 Rest of Europe
- 13. Asia Pacific Dental CAD Market Analysis, Insights and Forecast, 2019-2031
- 13.1. Market Analysis, Insights and Forecast - By Country/Sub-region
- 13.1.1 China
- 13.1.2 Japan
- 13.1.3 India
- 13.1.4 Australia
- 13.1.5 South Korea
- 13.1.6 Rest of Asia Pacific
- 14. Middle East and Africa Dental CAD Market Analysis, Insights and Forecast, 2019-2031
- 14.1. Market Analysis, Insights and Forecast - By Country/Sub-region
- 14.1.1 GCC
- 14.1.2 South Africa
- 14.1.3 Rest of Middle East and Africa
- 15. South America Dental CAD Market Analysis, Insights and Forecast, 2019-2031
- 15.1. Market Analysis, Insights and Forecast - By Country/Sub-region
- 15.1.1 Brazil
- 15.1.2 Argentina
- 15.1.3 Rest of South America
- 16. Competitive Analysis
- 16.1. Global Market Share Analysis 2024
- 16.2. Company Profiles
- 16.2.1 PLANMECA OY
- 16.2.1.1. Overview
- 16.2.1.2. Products
- 16.2.1.3. SWOT Analysis
- 16.2.1.4. Recent Developments
- 16.2.1.5. Financials (Based on Availability)
- 16.2.2 Roland DGA Corporation
- 16.2.2.1. Overview
- 16.2.2.2. Products
- 16.2.2.3. SWOT Analysis
- 16.2.2.4. Recent Developments
- 16.2.2.5. Financials (Based on Availability)
- 16.2.3 Dentsply Sirona
- 16.2.3.1. Overview
- 16.2.3.2. Products
- 16.2.3.3. SWOT Analysis
- 16.2.3.4. Recent Developments
- 16.2.3.5. Financials (Based on Availability)
- 16.2.4 Zirkonzahn
- 16.2.4.1. Overview
- 16.2.4.2. Products
- 16.2.4.3. SWOT Analysis
- 16.2.4.4. Recent Developments
- 16.2.4.5. Financials (Based on Availability)
- 16.2.5 Hexagon AB
- 16.2.5.1. Overview
- 16.2.5.2. Products
- 16.2.5.3. SWOT Analysis
- 16.2.5.4. Recent Developments
- 16.2.5.5. Financials (Based on Availability)
- 16.2.6 Kelkar Dynamics LLP
- 16.2.6.1. Overview
- 16.2.6.2. Products
- 16.2.6.3. SWOT Analysis
- 16.2.6.4. Recent Developments
- 16.2.6.5. Financials (Based on Availability)
- 16.2.7 Amann Girrbach AG
- 16.2.7.1. Overview
- 16.2.7.2. Products
- 16.2.7.3. SWOT Analysis
- 16.2.7.4. Recent Developments
- 16.2.7.5. Financials (Based on Availability)
- 16.2.8 Carestream Dental LLC
- 16.2.8.1. Overview
- 16.2.8.2. Products
- 16.2.8.3. SWOT Analysis
- 16.2.8.4. Recent Developments
- 16.2.8.5. Financials (Based on Availability)
- 16.2.9 3Shape
- 16.2.9.1. Overview
- 16.2.9.2. Products
- 16.2.9.3. SWOT Analysis
- 16.2.9.4. Recent Developments
- 16.2.9.5. Financials (Based on Availability)
- 16.2.10 Align Technology Inc
- 16.2.10.1. Overview
- 16.2.10.2. Products
- 16.2.10.3. SWOT Analysis
- 16.2.10.4. Recent Developments
- 16.2.10.5. Financials (Based on Availability)
- 16.2.11 Envista Holdings Corporation
- 16.2.11.1. Overview
- 16.2.11.2. Products
- 16.2.11.3. SWOT Analysis
- 16.2.11.4. Recent Developments
- 16.2.11.5. Financials (Based on Availability)
- 16.2.12 Datron AG
- 16.2.12.1. Overview
- 16.2.12.2. Products
- 16.2.12.3. SWOT Analysis
- 16.2.12.4. Recent Developments
- 16.2.12.5. Financials (Based on Availability)
- 16.2.13 Institut Straumann AG
- 16.2.13.1. Overview
- 16.2.13.2. Products
- 16.2.13.3. SWOT Analysis
- 16.2.13.4. Recent Developments
- 16.2.13.5. Financials (Based on Availability)
- 16.2.14 ZimVie Inc
- 16.2.14.1. Overview
- 16.2.14.2. Products
- 16.2.14.3. SWOT Analysis
- 16.2.14.4. Recent Developments
- 16.2.14.5. Financials (Based on Availability)
- 16.2.1 PLANMECA OY
List of Figures
- Figure 1: Global Dental CAD Market Revenue Breakdown (Million, %) by Region 2024 & 2032
- Figure 2: Global Dental CAD Market Volume Breakdown (K Unit, %) by Region 2024 & 2032
- Figure 3: North America Dental CAD Market Revenue (Million), by Country 2024 & 2032
- Figure 4: North America Dental CAD Market Volume (K Unit), by Country 2024 & 2032
- Figure 5: North America Dental CAD Market Revenue Share (%), by Country 2024 & 2032
- Figure 6: North America Dental CAD Market Volume Share (%), by Country 2024 & 2032
- Figure 7: Europe Dental CAD Market Revenue (Million), by Country 2024 & 2032
- Figure 8: Europe Dental CAD Market Volume (K Unit), by Country 2024 & 2032
- Figure 9: Europe Dental CAD Market Revenue Share (%), by Country 2024 & 2032
- Figure 10: Europe Dental CAD Market Volume Share (%), by Country 2024 & 2032
- Figure 11: Asia Pacific Dental CAD Market Revenue (Million), by Country 2024 & 2032
- Figure 12: Asia Pacific Dental CAD Market Volume (K Unit), by Country 2024 & 2032
- Figure 13: Asia Pacific Dental CAD Market Revenue Share (%), by Country 2024 & 2032
- Figure 14: Asia Pacific Dental CAD Market Volume Share (%), by Country 2024 & 2032
- Figure 15: Middle East and Africa Dental CAD Market Revenue (Million), by Country 2024 & 2032
- Figure 16: Middle East and Africa Dental CAD Market Volume (K Unit), by Country 2024 & 2032
- Figure 17: Middle East and Africa Dental CAD Market Revenue Share (%), by Country 2024 & 2032
- Figure 18: Middle East and Africa Dental CAD Market Volume Share (%), by Country 2024 & 2032
- Figure 19: South America Dental CAD Market Revenue (Million), by Country 2024 & 2032
- Figure 20: South America Dental CAD Market Volume (K Unit), by Country 2024 & 2032
- Figure 21: South America Dental CAD Market Revenue Share (%), by Country 2024 & 2032
- Figure 22: South America Dental CAD Market Volume Share (%), by Country 2024 & 2032
- Figure 23: North America Dental CAD Market Revenue (Million), by Component 2024 & 2032
- Figure 24: North America Dental CAD Market Volume (K Unit), by Component 2024 & 2032
- Figure 25: North America Dental CAD Market Revenue Share (%), by Component 2024 & 2032
- Figure 26: North America Dental CAD Market Volume Share (%), by Component 2024 & 2032
- Figure 27: North America Dental CAD Market Revenue (Million), by Application 2024 & 2032
- Figure 28: North America Dental CAD Market Volume (K Unit), by Application 2024 & 2032
- Figure 29: North America Dental CAD Market Revenue Share (%), by Application 2024 & 2032
- Figure 30: North America Dental CAD Market Volume Share (%), by Application 2024 & 2032
- Figure 31: North America Dental CAD Market Revenue (Million), by Country 2024 & 2032
- Figure 32: North America Dental CAD Market Volume (K Unit), by Country 2024 & 2032
- Figure 33: North America Dental CAD Market Revenue Share (%), by Country 2024 & 2032
- Figure 34: North America Dental CAD Market Volume Share (%), by Country 2024 & 2032
- Figure 35: Europe Dental CAD Market Revenue (Million), by Component 2024 & 2032
- Figure 36: Europe Dental CAD Market Volume (K Unit), by Component 2024 & 2032
- Figure 37: Europe Dental CAD Market Revenue Share (%), by Component 2024 & 2032
- Figure 38: Europe Dental CAD Market Volume Share (%), by Component 2024 & 2032
- Figure 39: Europe Dental CAD Market Revenue (Million), by Application 2024 & 2032
- Figure 40: Europe Dental CAD Market Volume (K Unit), by Application 2024 & 2032
- Figure 41: Europe Dental CAD Market Revenue Share (%), by Application 2024 & 2032
- Figure 42: Europe Dental CAD Market Volume Share (%), by Application 2024 & 2032
- Figure 43: Europe Dental CAD Market Revenue (Million), by Country 2024 & 2032
- Figure 44: Europe Dental CAD Market Volume (K Unit), by Country 2024 & 2032
- Figure 45: Europe Dental CAD Market Revenue Share (%), by Country 2024 & 2032
- Figure 46: Europe Dental CAD Market Volume Share (%), by Country 2024 & 2032
- Figure 47: Asia Pacific Dental CAD Market Revenue (Million), by Component 2024 & 2032
- Figure 48: Asia Pacific Dental CAD Market Volume (K Unit), by Component 2024 & 2032
- Figure 49: Asia Pacific Dental CAD Market Revenue Share (%), by Component 2024 & 2032
- Figure 50: Asia Pacific Dental CAD Market Volume Share (%), by Component 2024 & 2032
- Figure 51: Asia Pacific Dental CAD Market Revenue (Million), by Application 2024 & 2032
- Figure 52: Asia Pacific Dental CAD Market Volume (K Unit), by Application 2024 & 2032
- Figure 53: Asia Pacific Dental CAD Market Revenue Share (%), by Application 2024 & 2032
- Figure 54: Asia Pacific Dental CAD Market Volume Share (%), by Application 2024 & 2032
- Figure 55: Asia Pacific Dental CAD Market Revenue (Million), by Country 2024 & 2032
- Figure 56: Asia Pacific Dental CAD Market Volume (K Unit), by Country 2024 & 2032
- Figure 57: Asia Pacific Dental CAD Market Revenue Share (%), by Country 2024 & 2032
- Figure 58: Asia Pacific Dental CAD Market Volume Share (%), by Country 2024 & 2032
- Figure 59: Middle East and Africa Dental CAD Market Revenue (Million), by Component 2024 & 2032
- Figure 60: Middle East and Africa Dental CAD Market Volume (K Unit), by Component 2024 & 2032
- Figure 61: Middle East and Africa Dental CAD Market Revenue Share (%), by Component 2024 & 2032
- Figure 62: Middle East and Africa Dental CAD Market Volume Share (%), by Component 2024 & 2032
- Figure 63: Middle East and Africa Dental CAD Market Revenue (Million), by Application 2024 & 2032
- Figure 64: Middle East and Africa Dental CAD Market Volume (K Unit), by Application 2024 & 2032
- Figure 65: Middle East and Africa Dental CAD Market Revenue Share (%), by Application 2024 & 2032
- Figure 66: Middle East and Africa Dental CAD Market Volume Share (%), by Application 2024 & 2032
- Figure 67: Middle East and Africa Dental CAD Market Revenue (Million), by Country 2024 & 2032
- Figure 68: Middle East and Africa Dental CAD Market Volume (K Unit), by Country 2024 & 2032
- Figure 69: Middle East and Africa Dental CAD Market Revenue Share (%), by Country 2024 & 2032
- Figure 70: Middle East and Africa Dental CAD Market Volume Share (%), by Country 2024 & 2032
- Figure 71: South America Dental CAD Market Revenue (Million), by Component 2024 & 2032
- Figure 72: South America Dental CAD Market Volume (K Unit), by Component 2024 & 2032
- Figure 73: South America Dental CAD Market Revenue Share (%), by Component 2024 & 2032
- Figure 74: South America Dental CAD Market Volume Share (%), by Component 2024 & 2032
- Figure 75: South America Dental CAD Market Revenue (Million), by Application 2024 & 2032
- Figure 76: South America Dental CAD Market Volume (K Unit), by Application 2024 & 2032
- Figure 77: South America Dental CAD Market Revenue Share (%), by Application 2024 & 2032
- Figure 78: South America Dental CAD Market Volume Share (%), by Application 2024 & 2032
- Figure 79: South America Dental CAD Market Revenue (Million), by Country 2024 & 2032
- Figure 80: South America Dental CAD Market Volume (K Unit), by Country 2024 & 2032
- Figure 81: South America Dental CAD Market Revenue Share (%), by Country 2024 & 2032
- Figure 82: South America Dental CAD Market Volume Share (%), by Country 2024 & 2032
List of Tables
- Table 1: Global Dental CAD Market Revenue Million Forecast, by Region 2019 & 2032
- Table 2: Global Dental CAD Market Volume K Unit Forecast, by Region 2019 & 2032
- Table 3: Global Dental CAD Market Revenue Million Forecast, by Component 2019 & 2032
- Table 4: Global Dental CAD Market Volume K Unit Forecast, by Component 2019 & 2032
- Table 5: Global Dental CAD Market Revenue Million Forecast, by Application 2019 & 2032
- Table 6: Global Dental CAD Market Volume K Unit Forecast, by Application 2019 & 2032
- Table 7: Global Dental CAD Market Revenue Million Forecast, by Region 2019 & 2032
- Table 8: Global Dental CAD Market Volume K Unit Forecast, by Region 2019 & 2032
- Table 9: Global Dental CAD Market Revenue Million Forecast, by Country 2019 & 2032
- Table 10: Global Dental CAD Market Volume K Unit Forecast, by Country 2019 & 2032
- Table 11: United States Dental CAD Market Revenue (Million) Forecast, by Application 2019 & 2032
- Table 12: United States Dental CAD Market Volume (K Unit) Forecast, by Application 2019 & 2032
- Table 13: Canada Dental CAD Market Revenue (Million) Forecast, by Application 2019 & 2032
- Table 14: Canada Dental CAD Market Volume (K Unit) Forecast, by Application 2019 & 2032
- Table 15: Mexico Dental CAD Market Revenue (Million) Forecast, by Application 2019 & 2032
- Table 16: Mexico Dental CAD Market Volume (K Unit) Forecast, by Application 2019 & 2032
- Table 17: Global Dental CAD Market Revenue Million Forecast, by Country 2019 & 2032
- Table 18: Global Dental CAD Market Volume K Unit Forecast, by Country 2019 & 2032
- Table 19: Germany Dental CAD Market Revenue (Million) Forecast, by Application 2019 & 2032
- Table 20: Germany Dental CAD Market Volume (K Unit) Forecast, by Application 2019 & 2032
- Table 21: United Kingdom Dental CAD Market Revenue (Million) Forecast, by Application 2019 & 2032
- Table 22: United Kingdom Dental CAD Market Volume (K Unit) Forecast, by Application 2019 & 2032
- Table 23: France Dental CAD Market Revenue (Million) Forecast, by Application 2019 & 2032
- Table 24: France Dental CAD Market Volume (K Unit) Forecast, by Application 2019 & 2032
- Table 25: Italy Dental CAD Market Revenue (Million) Forecast, by Application 2019 & 2032
- Table 26: Italy Dental CAD Market Volume (K Unit) Forecast, by Application 2019 & 2032
- Table 27: Spain Dental CAD Market Revenue (Million) Forecast, by Application 2019 & 2032
- Table 28: Spain Dental CAD Market Volume (K Unit) Forecast, by Application 2019 & 2032
- Table 29: Rest of Europe Dental CAD Market Revenue (Million) Forecast, by Application 2019 & 2032
- Table 30: Rest of Europe Dental CAD Market Volume (K Unit) Forecast, by Application 2019 & 2032
- Table 31: Global Dental CAD Market Revenue Million Forecast, by Country 2019 & 2032
- Table 32: Global Dental CAD Market Volume K Unit Forecast, by Country 2019 & 2032
- Table 33: China Dental CAD Market Revenue (Million) Forecast, by Application 2019 & 2032
- Table 34: China Dental CAD Market Volume (K Unit) Forecast, by Application 2019 & 2032
- Table 35: Japan Dental CAD Market Revenue (Million) Forecast, by Application 2019 & 2032
- Table 36: Japan Dental CAD Market Volume (K Unit) Forecast, by Application 2019 & 2032
- Table 37: India Dental CAD Market Revenue (Million) Forecast, by Application 2019 & 2032
- Table 38: India Dental CAD Market Volume (K Unit) Forecast, by Application 2019 & 2032
- Table 39: Australia Dental CAD Market Revenue (Million) Forecast, by Application 2019 & 2032
- Table 40: Australia Dental CAD Market Volume (K Unit) Forecast, by Application 2019 & 2032
- Table 41: South Korea Dental CAD Market Revenue (Million) Forecast, by Application 2019 & 2032
- Table 42: South Korea Dental CAD Market Volume (K Unit) Forecast, by Application 2019 & 2032
- Table 43: Rest of Asia Pacific Dental CAD Market Revenue (Million) Forecast, by Application 2019 & 2032
- Table 44: Rest of Asia Pacific Dental CAD Market Volume (K Unit) Forecast, by Application 2019 & 2032
- Table 45: Global Dental CAD Market Revenue Million Forecast, by Country 2019 & 2032
- Table 46: Global Dental CAD Market Volume K Unit Forecast, by Country 2019 & 2032
- Table 47: GCC Dental CAD Market Revenue (Million) Forecast, by Application 2019 & 2032
- Table 48: GCC Dental CAD Market Volume (K Unit) Forecast, by Application 2019 & 2032
- Table 49: South Africa Dental CAD Market Revenue (Million) Forecast, by Application 2019 & 2032
- Table 50: South Africa Dental CAD Market Volume (K Unit) Forecast, by Application 2019 & 2032
- Table 51: Rest of Middle East and Africa Dental CAD Market Revenue (Million) Forecast, by Application 2019 & 2032
- Table 52: Rest of Middle East and Africa Dental CAD Market Volume (K Unit) Forecast, by Application 2019 & 2032
- Table 53: Global Dental CAD Market Revenue Million Forecast, by Country 2019 & 2032
- Table 54: Global Dental CAD Market Volume K Unit Forecast, by Country 2019 & 2032
- Table 55: Brazil Dental CAD Market Revenue (Million) Forecast, by Application 2019 & 2032
- Table 56: Brazil Dental CAD Market Volume (K Unit) Forecast, by Application 2019 & 2032
- Table 57: Argentina Dental CAD Market Revenue (Million) Forecast, by Application 2019 & 2032
- Table 58: Argentina Dental CAD Market Volume (K Unit) Forecast, by Application 2019 & 2032
- Table 59: Rest of South America Dental CAD Market Revenue (Million) Forecast, by Application 2019 & 2032
- Table 60: Rest of South America Dental CAD Market Volume (K Unit) Forecast, by Application 2019 & 2032
- Table 61: Global Dental CAD Market Revenue Million Forecast, by Component 2019 & 2032
- Table 62: Global Dental CAD Market Volume K Unit Forecast, by Component 2019 & 2032
- Table 63: Global Dental CAD Market Revenue Million Forecast, by Application 2019 & 2032
- Table 64: Global Dental CAD Market Volume K Unit Forecast, by Application 2019 & 2032
- Table 65: Global Dental CAD Market Revenue Million Forecast, by Country 2019 & 2032
- Table 66: Global Dental CAD Market Volume K Unit Forecast, by Country 2019 & 2032
- Table 67: United States Dental CAD Market Revenue (Million) Forecast, by Application 2019 & 2032
- Table 68: United States Dental CAD Market Volume (K Unit) Forecast, by Application 2019 & 2032
- Table 69: Canada Dental CAD Market Revenue (Million) Forecast, by Application 2019 & 2032
- Table 70: Canada Dental CAD Market Volume (K Unit) Forecast, by Application 2019 & 2032
- Table 71: Mexico Dental CAD Market Revenue (Million) Forecast, by Application 2019 & 2032
- Table 72: Mexico Dental CAD Market Volume (K Unit) Forecast, by Application 2019 & 2032
- Table 73: Global Dental CAD Market Revenue Million Forecast, by Component 2019 & 2032
- Table 74: Global Dental CAD Market Volume K Unit Forecast, by Component 2019 & 2032
- Table 75: Global Dental CAD Market Revenue Million Forecast, by Application 2019 & 2032
- Table 76: Global Dental CAD Market Volume K Unit Forecast, by Application 2019 & 2032
- Table 77: Global Dental CAD Market Revenue Million Forecast, by Country 2019 & 2032
- Table 78: Global Dental CAD Market Volume K Unit Forecast, by Country 2019 & 2032
- Table 79: Germany Dental CAD Market Revenue (Million) Forecast, by Application 2019 & 2032
- Table 80: Germany Dental CAD Market Volume (K Unit) Forecast, by Application 2019 & 2032
- Table 81: United Kingdom Dental CAD Market Revenue (Million) Forecast, by Application 2019 & 2032
- Table 82: United Kingdom Dental CAD Market Volume (K Unit) Forecast, by Application 2019 & 2032
- Table 83: France Dental CAD Market Revenue (Million) Forecast, by Application 2019 & 2032
- Table 84: France Dental CAD Market Volume (K Unit) Forecast, by Application 2019 & 2032
- Table 85: Italy Dental CAD Market Revenue (Million) Forecast, by Application 2019 & 2032
- Table 86: Italy Dental CAD Market Volume (K Unit) Forecast, by Application 2019 & 2032
- Table 87: Spain Dental CAD Market Revenue (Million) Forecast, by Application 2019 & 2032
- Table 88: Spain Dental CAD Market Volume (K Unit) Forecast, by Application 2019 & 2032
- Table 89: Rest of Europe Dental CAD Market Revenue (Million) Forecast, by Application 2019 & 2032
- Table 90: Rest of Europe Dental CAD Market Volume (K Unit) Forecast, by Application 2019 & 2032
- Table 91: Global Dental CAD Market Revenue Million Forecast, by Component 2019 & 2032
- Table 92: Global Dental CAD Market Volume K Unit Forecast, by Component 2019 & 2032
- Table 93: Global Dental CAD Market Revenue Million Forecast, by Application 2019 & 2032
- Table 94: Global Dental CAD Market Volume K Unit Forecast, by Application 2019 & 2032
- Table 95: Global Dental CAD Market Revenue Million Forecast, by Country 2019 & 2032
- Table 96: Global Dental CAD Market Volume K Unit Forecast, by Country 2019 & 2032
- Table 97: China Dental CAD Market Revenue (Million) Forecast, by Application 2019 & 2032
- Table 98: China Dental CAD Market Volume (K Unit) Forecast, by Application 2019 & 2032
- Table 99: Japan Dental CAD Market Revenue (Million) Forecast, by Application 2019 & 2032
- Table 100: Japan Dental CAD Market Volume (K Unit) Forecast, by Application 2019 & 2032
- Table 101: India Dental CAD Market Revenue (Million) Forecast, by Application 2019 & 2032
- Table 102: India Dental CAD Market Volume (K Unit) Forecast, by Application 2019 & 2032
- Table 103: Australia Dental CAD Market Revenue (Million) Forecast, by Application 2019 & 2032
- Table 104: Australia Dental CAD Market Volume (K Unit) Forecast, by Application 2019 & 2032
- Table 105: South Korea Dental CAD Market Revenue (Million) Forecast, by Application 2019 & 2032
- Table 106: South Korea Dental CAD Market Volume (K Unit) Forecast, by Application 2019 & 2032
- Table 107: Rest of Asia Pacific Dental CAD Market Revenue (Million) Forecast, by Application 2019 & 2032
- Table 108: Rest of Asia Pacific Dental CAD Market Volume (K Unit) Forecast, by Application 2019 & 2032
- Table 109: Global Dental CAD Market Revenue Million Forecast, by Component 2019 & 2032
- Table 110: Global Dental CAD Market Volume K Unit Forecast, by Component 2019 & 2032
- Table 111: Global Dental CAD Market Revenue Million Forecast, by Application 2019 & 2032
- Table 112: Global Dental CAD Market Volume K Unit Forecast, by Application 2019 & 2032
- Table 113: Global Dental CAD Market Revenue Million Forecast, by Country 2019 & 2032
- Table 114: Global Dental CAD Market Volume K Unit Forecast, by Country 2019 & 2032
- Table 115: GCC Dental CAD Market Revenue (Million) Forecast, by Application 2019 & 2032
- Table 116: GCC Dental CAD Market Volume (K Unit) Forecast, by Application 2019 & 2032
- Table 117: South Africa Dental CAD Market Revenue (Million) Forecast, by Application 2019 & 2032
- Table 118: South Africa Dental CAD Market Volume (K Unit) Forecast, by Application 2019 & 2032
- Table 119: Rest of Middle East and Africa Dental CAD Market Revenue (Million) Forecast, by Application 2019 & 2032
- Table 120: Rest of Middle East and Africa Dental CAD Market Volume (K Unit) Forecast, by Application 2019 & 2032
- Table 121: Global Dental CAD Market Revenue Million Forecast, by Component 2019 & 2032
- Table 122: Global Dental CAD Market Volume K Unit Forecast, by Component 2019 & 2032
- Table 123: Global Dental CAD Market Revenue Million Forecast, by Application 2019 & 2032
- Table 124: Global Dental CAD Market Volume K Unit Forecast, by Application 2019 & 2032
- Table 125: Global Dental CAD Market Revenue Million Forecast, by Country 2019 & 2032
- Table 126: Global Dental CAD Market Volume K Unit Forecast, by Country 2019 & 2032
- Table 127: Brazil Dental CAD Market Revenue (Million) Forecast, by Application 2019 & 2032
- Table 128: Brazil Dental CAD Market Volume (K Unit) Forecast, by Application 2019 & 2032
- Table 129: Argentina Dental CAD Market Revenue (Million) Forecast, by Application 2019 & 2032
- Table 130: Argentina Dental CAD Market Volume (K Unit) Forecast, by Application 2019 & 2032
- Table 131: Rest of South America Dental CAD Market Revenue (Million) Forecast, by Application 2019 & 2032
- Table 132: Rest of South America Dental CAD Market Volume (K Unit) Forecast, by Application 2019 & 2032
Frequently Asked Questions
1. What is the projected Compound Annual Growth Rate (CAGR) of the Dental CAD Market?
The projected CAGR is approximately 8.50%.
2. Which companies are prominent players in the Dental CAD Market?
Key companies in the market include PLANMECA OY, Roland DGA Corporation, Dentsply Sirona, Zirkonzahn, Hexagon AB, Kelkar Dynamics LLP, Amann Girrbach AG, Carestream Dental LLC, 3Shape, Align Technology Inc, Envista Holdings Corporation, Datron AG, Institut Straumann AG, ZimVie Inc.
3. What are the main segments of the Dental CAD Market?
The market segments include Component, Application.
4. Can you provide details about the market size?
The market size is estimated to be USD XX Million as of 2022.
5. What are some drivers contributing to market growth?
Increasing Burden of Oral Diseases And Ageing Population; Technological Advancements in Dental Imaging Methodologies.
6. What are the notable trends driving market growth?
The Scanners Segment is Expected to Hold Significant Share in Dental CAD Market Over the Forecast Period.
7. Are there any restraints impacting market growth?
Excessive Costs Involved in Private Health Insurance.
8. Can you provide examples of recent developments in the market?
In September 2022, Planmeca introduced a completely new software module for Planmeca Romexis, which makes working with digital impressions easier and faster. The Planmeca Romexis CAD/CAM module streamlines the scan-and-send workflow for capturing, analyzing, and exporting digital impressions and offers new intraoral scanner users a smooth CAD/CAM dentistry experience.
9. What pricing options are available for accessing the report?
Pricing options include single-user, multi-user, and enterprise licenses priced at USD 4750, USD 5250, and USD 8750 respectively.
10. Is the market size provided in terms of value or volume?
The market size is provided in terms of value, measured in Million and volume, measured in K Unit.
11. Are there any specific market keywords associated with the report?
Yes, the market keyword associated with the report is "Dental CAD Market," which aids in identifying and referencing the specific market segment covered.
12. How do I determine which pricing option suits my needs best?
The pricing options vary based on user requirements and access needs. Individual users may opt for single-user licenses, while businesses requiring broader access may choose multi-user or enterprise licenses for cost-effective access to the report.
13. Are there any additional resources or data provided in the Dental CAD Market report?
While the report offers comprehensive insights, it's advisable to review the specific contents or supplementary materials provided to ascertain if additional resources or data are available.
14. How can I stay updated on further developments or reports in the Dental CAD Market?
To stay informed about further developments, trends, and reports in the Dental CAD Market, consider subscribing to industry newsletters, following relevant companies and organizations, or regularly checking reputable industry news sources and publications.
Methodology
Step 1 - Identification of Relevant Samples Size from Population Database


Step 2 - Approaches for Defining Global Market Size (Value, Volume* & Price*)

Note*: In applicable scenarios
Step 3 - Data Sources
Primary Research
- Web Analytics
- Survey Reports
- Research Institute
- Latest Research Reports
- Opinion Leaders
Secondary Research
- Annual Reports
- White Paper
- Latest Press Release
- Industry Association
- Paid Database
- Investor Presentations

Step 4 - Data Triangulation
Involves using different sources of information in order to increase the validity of a study
These sources are likely to be stakeholders in a program - participants, other researchers, program staff, other community members, and so on.
Then we put all data in single framework & apply various statistical tools to find out the dynamic on the market.
During the analysis stage, feedback from the stakeholder groups would be compared to determine areas of agreement as well as areas of divergence


