
Key Insights
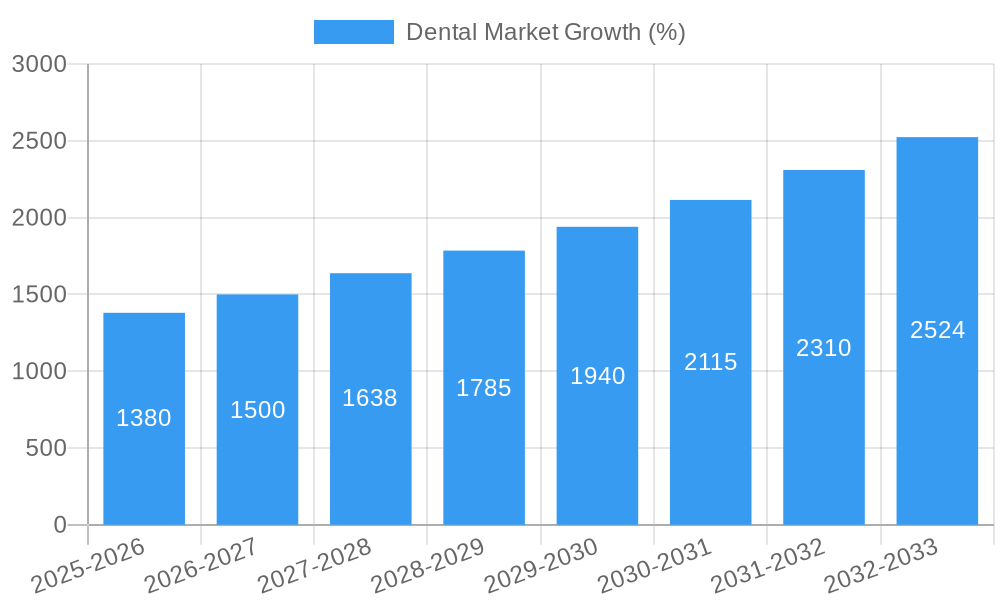
The global dental market, currently experiencing robust growth, is projected to reach a substantial size within the forecast period (2025-2033). A Compound Annual Growth Rate (CAGR) of 9.20% indicates significant expansion driven by several key factors. Technological advancements, such as the increasing adoption of digital dentistry (CAD/CAM technology, 3D printing, and cone-beam computed tomography), are revolutionizing procedures and improving patient outcomes. The rising prevalence of dental diseases, aging populations in developed nations, and increased disposable incomes in emerging economies are fueling demand for sophisticated dental treatments and advanced materials. Further, the growing awareness of oral hygiene and cosmetic dentistry contributes to market expansion. The market is segmented by end-user (hospitals, dental clinics, others) and product type (instruments and consumables). Hospitals and clinics represent the largest segments, while instruments are expected to maintain a larger market share compared to consumables due to higher upfront investment. Leading players like Planmeca Oy, Shofu Dental, and Dentsply Sirona are driving innovation and competition. Geographic analysis reveals strong performance in North America and Europe, reflecting high healthcare expenditure and technological adoption. However, the Asia-Pacific region shows high growth potential due to rapidly expanding middle classes and improving healthcare infrastructure. While challenges such as stringent regulatory approvals and high treatment costs exist, the overall outlook remains positive, predicting continued expansion throughout the forecast period.
The competitive landscape is marked by both established players and emerging companies offering a diverse range of products and services. Strategic collaborations, mergers and acquisitions, and product launches are defining market dynamics. The market will likely witness continued consolidation as larger players seek to expand their market share and product portfolios. Further segmentation could emerge based on specific procedures (e.g., orthodontics, implantology), further refining market analysis and targeting specific needs. Addressing the challenges related to accessibility and affordability of dental care, particularly in underserved regions, will be crucial for inclusive market growth. The future of the dental market rests on continuous innovation, improved patient access, and the ongoing integration of advanced technologies to ensure comprehensive and high-quality oral healthcare.

Dental Market: Comprehensive Market Analysis & Forecast 2019-2033
This in-depth report provides a comprehensive analysis of the global dental market, encompassing market size, segmentation, growth drivers, challenges, and key players. The report covers the period from 2019 to 2033, with a focus on the forecast period of 2025-2033 and a base year of 2025. The market is segmented by end-user (Hospitals, Dental Clinics, Others) and product type (Instruments, Consumables). This report offers actionable insights for industry stakeholders, including manufacturers, distributors, investors, and healthcare professionals. The total market value is projected to reach xx Million by 2033.
Dental Market Concentration & Innovation
The dental market exhibits a moderately concentrated structure, with a few dominant players holding significant market share. Companies like Dentsply Sirona and 3M hold substantial market power due to their extensive product portfolios and global reach. However, the market also features several smaller, specialized players that cater to niche segments. The market share of the top five companies is estimated at xx%. Innovation is a crucial driver, with significant investments in R&D focused on digital dentistry, including CAD/CAM technology, intraoral scanners, and AI-powered diagnostic tools. The regulatory landscape varies across different regions, impacting market access and product approvals. Furthermore, the market faces substitution pressures from alternative treatment methods and materials. Mergers and acquisitions (M&A) are frequent, with deal values averaging xx Million in recent years. Key M&A activities have included strategic acquisitions to expand product portfolios and geographic reach. End-user trends reflect a growing preference for minimally invasive procedures, digital dentistry, and improved patient experience.
Dental Market Industry Trends & Insights
The global dental market is experiencing robust growth, driven by factors such as increasing dental awareness, rising disposable incomes, aging populations, and technological advancements. The market is expected to register a CAGR of xx% during the forecast period (2025-2033). Technological disruptions, particularly the adoption of digital technologies like intraoral scanners and CAD/CAM systems, are significantly impacting market dynamics, enhancing efficiency and improving treatment outcomes. Consumer preferences are shifting towards aesthetically pleasing treatments, minimally invasive procedures, and personalized care. The competitive landscape is intense, with companies constantly striving to innovate and differentiate their offerings. Market penetration of digital technologies is increasing rapidly, with xx% of dental clinics currently utilizing intraoral scanners. This trend is expected to accelerate in the coming years.
Dominant Markets & Segments in Dental Market
The North American region currently dominates the global dental market, driven by high per capita healthcare expenditure, advanced dental infrastructure, and a high prevalence of dental diseases. Within this region, the United States holds the largest market share. Key drivers for this dominance include favorable economic policies supporting healthcare investments and a robust healthcare infrastructure.
- End-User Segmentation: Dental clinics account for the largest segment of the market, driven by the high number of dental clinics globally.
- Type Segmentation: The consumables segment is larger than the instruments segment due to the continuous and recurring nature of consumable purchases.
Europe represents a significant market due to its developed healthcare infrastructure and increasing awareness of oral hygiene. Asia-Pacific is also exhibiting strong growth potential.
Dental Market Product Developments
Recent product innovations emphasize digital dentistry, AI-powered diagnostics, and minimally invasive procedures. New intraoral scanners offer improved image quality and faster scanning times. AI-driven diagnostic tools are enhancing the accuracy and efficiency of dental practices. These advancements offer significant competitive advantages by improving workflow efficiency and providing superior patient care. The market is witnessing a strong trend towards integrating digital technologies into all aspects of dental care.
Report Scope & Segmentation Analysis
This report provides a comprehensive analysis of the global dental market, segmented by end-user and product type.
- End-User: Hospitals: xx Million (2025), Dental Clinics: xx Million (2025), Others: xx Million (2025)
- Product Type: Instruments: xx Million (2025), Consumables: xx Million (2025)
Growth projections vary across segments, with the consumables segment expected to experience faster growth due to its recurring nature. Competitive dynamics differ across segments, with varying levels of competition and market concentration.
Key Drivers of Dental Market Growth
Several key factors drive the growth of the dental market:
- Technological advancements: Digital dentistry, AI-powered diagnostics, and minimally invasive procedures.
- Rising disposable incomes: Increased affordability of dental care in developing economies.
- Aging population: Higher prevalence of age-related dental issues.
- Increased dental awareness: Growing awareness of oral health and its link to overall health.
Challenges in the Dental Market Sector
The dental market faces several challenges:
- Regulatory hurdles: Stringent regulatory processes for new product approvals.
- Supply chain disruptions: Global supply chain issues impacting the availability of raw materials and components.
- High competition: Intense competition amongst existing and new market entrants.
- Pricing pressures: Pressure on prices from both payers and providers.
Emerging Opportunities in Dental Market
Emerging opportunities in the dental market include:
- Expansion in emerging markets: Significant growth potential in developing countries.
- Development of personalized dental solutions: Tailoring treatments to individual needs.
- Tele-dentistry: Remote dental consultations and diagnosis using technology.
- Integration of AI and machine learning: Enhanced diagnostic capabilities and treatment planning.
Leading Players in the Dental Market Market
- PLANMECA OY
- Shofu Dental
- Zimmer Biomet
- Dentsply Sirona
- Apteryx Imaging Inc
- GC Corporation
- J MORITA CORP
- Carestream Dental LLC
- Kulzer GmbH
- Align Technology Inc
- Midmark Corporation
- Ivoclar Vivadent
Key Developments in Dental Market Industry
- November 2022: Imagoworks Inc. launched the AI-based web dental CAD 3Dme Crown, automating crown design.
- October 2022: DEXIS launched the DEXIS IS (Intraoral Scanner) portfolio, offering a complete digital dental diagnostic system.
These developments reflect the ongoing trend towards digitalization and AI integration in the dental market, improving efficiency and treatment quality.
Strategic Outlook for Dental Market Market
The future of the dental market is bright, driven by technological innovation, increasing demand for advanced dental care, and expanding access in emerging markets. Companies focusing on digital dentistry, personalized treatments, and AI-powered solutions are well-positioned for significant growth. The market presents significant opportunities for both established players and new entrants, creating a dynamic and evolving landscape.
Dental Market Segmentation
-
1. Type
- 1.1. Instruments
- 1.2. Consumables
-
2. End User
- 2.1. Hospitals
- 2.2. Dental Clinics
- 2.3. Other End Users
Dental Market Segmentation By Geography
-
1. North America
- 1.1. United States
- 1.2. Canada
- 1.3. Mexico
-
2. Europe
- 2.1. Germany
- 2.2. United Kingdom
- 2.3. France
- 2.4. Italy
- 2.5. Spain
- 2.6. Rest of Europe
-
3. Asia Pacific
- 3.1. China
- 3.2. Japan
- 3.3. India
- 3.4. Australia
- 3.5. South Korea
- 3.6. Rest of Asia Pacific
-
4. Middle East and Africa
- 4.1. GCC
- 4.2. South Africa
- 4.3. Rest of Middle East and Africa
-
5. South America
- 5.1. Brazil
- 5.2. Argentina
- 5.3. Rest of South America

Dental Market REPORT HIGHLIGHTS
| Aspects | Details |
|---|---|
| Study Period | 2019-2033 |
| Base Year | 2024 |
| Estimated Year | 2025 |
| Forecast Period | 2025-2033 |
| Historical Period | 2019-2024 |
| Growth Rate | CAGR of 9.20% from 2019-2033 |
| Segmentation |
|
Table of Contents
- 1. Introduction
- 1.1. Research Scope
- 1.2. Market Segmentation
- 1.3. Research Methodology
- 1.4. Definitions and Assumptions
- 2. Executive Summary
- 2.1. Introduction
- 3. Market Dynamics
- 3.1. Introduction
- 3.2. Market Drivers
- 3.2.1. Increasing Focus on Digital Dentistry; Increasing Geriatric Population
- 3.3. Market Restrains
- 3.3.1. High Cost Associated With Implementation
- 3.4. Market Trends
- 3.4.1. Hospitals are Expected to Witness Significant Growth Over the Forecast Period
- 4. Market Factor Analysis
- 4.1. Porters Five Forces
- 4.2. Supply/Value Chain
- 4.3. PESTEL analysis
- 4.4. Market Entropy
- 4.5. Patent/Trademark Analysis
- 5. Global Dental Market Analysis, Insights and Forecast, 2019-2031
- 5.1. Market Analysis, Insights and Forecast - by Type
- 5.1.1. Instruments
- 5.1.2. Consumables
- 5.2. Market Analysis, Insights and Forecast - by End User
- 5.2.1. Hospitals
- 5.2.2. Dental Clinics
- 5.2.3. Other End Users
- 5.3. Market Analysis, Insights and Forecast - by Region
- 5.3.1. North America
- 5.3.2. Europe
- 5.3.3. Asia Pacific
- 5.3.4. Middle East and Africa
- 5.3.5. South America
- 5.1. Market Analysis, Insights and Forecast - by Type
- 6. North America Dental Market Analysis, Insights and Forecast, 2019-2031
- 6.1. Market Analysis, Insights and Forecast - by Type
- 6.1.1. Instruments
- 6.1.2. Consumables
- 6.2. Market Analysis, Insights and Forecast - by End User
- 6.2.1. Hospitals
- 6.2.2. Dental Clinics
- 6.2.3. Other End Users
- 6.1. Market Analysis, Insights and Forecast - by Type
- 7. Europe Dental Market Analysis, Insights and Forecast, 2019-2031
- 7.1. Market Analysis, Insights and Forecast - by Type
- 7.1.1. Instruments
- 7.1.2. Consumables
- 7.2. Market Analysis, Insights and Forecast - by End User
- 7.2.1. Hospitals
- 7.2.2. Dental Clinics
- 7.2.3. Other End Users
- 7.1. Market Analysis, Insights and Forecast - by Type
- 8. Asia Pacific Dental Market Analysis, Insights and Forecast, 2019-2031
- 8.1. Market Analysis, Insights and Forecast - by Type
- 8.1.1. Instruments
- 8.1.2. Consumables
- 8.2. Market Analysis, Insights and Forecast - by End User
- 8.2.1. Hospitals
- 8.2.2. Dental Clinics
- 8.2.3. Other End Users
- 8.1. Market Analysis, Insights and Forecast - by Type
- 9. Middle East and Africa Dental Market Analysis, Insights and Forecast, 2019-2031
- 9.1. Market Analysis, Insights and Forecast - by Type
- 9.1.1. Instruments
- 9.1.2. Consumables
- 9.2. Market Analysis, Insights and Forecast - by End User
- 9.2.1. Hospitals
- 9.2.2. Dental Clinics
- 9.2.3. Other End Users
- 9.1. Market Analysis, Insights and Forecast - by Type
- 10. South America Dental Market Analysis, Insights and Forecast, 2019-2031
- 10.1. Market Analysis, Insights and Forecast - by Type
- 10.1.1. Instruments
- 10.1.2. Consumables
- 10.2. Market Analysis, Insights and Forecast - by End User
- 10.2.1. Hospitals
- 10.2.2. Dental Clinics
- 10.2.3. Other End Users
- 10.1. Market Analysis, Insights and Forecast - by Type
- 11. North America Dental Market Analysis, Insights and Forecast, 2019-2031
- 11.1. Market Analysis, Insights and Forecast - By Country/Sub-region
- 11.1.1 United States
- 11.1.2 Canada
- 11.1.3 Mexico
- 12. Europe Dental Market Analysis, Insights and Forecast, 2019-2031
- 12.1. Market Analysis, Insights and Forecast - By Country/Sub-region
- 12.1.1 Germany
- 12.1.2 United Kingdom
- 12.1.3 France
- 12.1.4 Italy
- 12.1.5 Spain
- 12.1.6 Rest of Europe
- 13. Asia Pacific Dental Market Analysis, Insights and Forecast, 2019-2031
- 13.1. Market Analysis, Insights and Forecast - By Country/Sub-region
- 13.1.1 China
- 13.1.2 Japan
- 13.1.3 India
- 13.1.4 Australia
- 13.1.5 South Korea
- 13.1.6 Rest of Asia Pacific
- 14. Middle East and Africa Dental Market Analysis, Insights and Forecast, 2019-2031
- 14.1. Market Analysis, Insights and Forecast - By Country/Sub-region
- 14.1.1 GCC
- 14.1.2 South Africa
- 14.1.3 Rest of Middle East and Africa
- 15. South America Dental Market Analysis, Insights and Forecast, 2019-2031
- 15.1. Market Analysis, Insights and Forecast - By Country/Sub-region
- 15.1.1 Brazil
- 15.1.2 Argentina
- 15.1.3 Rest of South America
- 16. Competitive Analysis
- 16.1. Global Market Share Analysis 2024
- 16.2. Company Profiles
- 16.2.1 PLANMECA OY
- 16.2.1.1. Overview
- 16.2.1.2. Products
- 16.2.1.3. SWOT Analysis
- 16.2.1.4. Recent Developments
- 16.2.1.5. Financials (Based on Availability)
- 16.2.2 Shofu Dental
- 16.2.2.1. Overview
- 16.2.2.2. Products
- 16.2.2.3. SWOT Analysis
- 16.2.2.4. Recent Developments
- 16.2.2.5. Financials (Based on Availability)
- 16.2.3 Zimmer Biomet
- 16.2.3.1. Overview
- 16.2.3.2. Products
- 16.2.3.3. SWOT Analysis
- 16.2.3.4. Recent Developments
- 16.2.3.5. Financials (Based on Availability)
- 16.2.4 Dentsply Sirona
- 16.2.4.1. Overview
- 16.2.4.2. Products
- 16.2.4.3. SWOT Analysis
- 16.2.4.4. Recent Developments
- 16.2.4.5. Financials (Based on Availability)
- 16.2.5 Apteryx Imaging Inc
- 16.2.5.1. Overview
- 16.2.5.2. Products
- 16.2.5.3. SWOT Analysis
- 16.2.5.4. Recent Developments
- 16.2.5.5. Financials (Based on Availability)
- 16.2.6 GC Corporation
- 16.2.6.1. Overview
- 16.2.6.2. Products
- 16.2.6.3. SWOT Analysis
- 16.2.6.4. Recent Developments
- 16.2.6.5. Financials (Based on Availability)
- 16.2.7 J MORITA CORP
- 16.2.7.1. Overview
- 16.2.7.2. Products
- 16.2.7.3. SWOT Analysis
- 16.2.7.4. Recent Developments
- 16.2.7.5. Financials (Based on Availability)
- 16.2.8 Carestream Dental LLC
- 16.2.8.1. Overview
- 16.2.8.2. Products
- 16.2.8.3. SWOT Analysis
- 16.2.8.4. Recent Developments
- 16.2.8.5. Financials (Based on Availability)
- 16.2.9 Kulzer GmbH
- 16.2.9.1. Overview
- 16.2.9.2. Products
- 16.2.9.3. SWOT Analysis
- 16.2.9.4. Recent Developments
- 16.2.9.5. Financials (Based on Availability)
- 16.2.10 Align Technology Inc
- 16.2.10.1. Overview
- 16.2.10.2. Products
- 16.2.10.3. SWOT Analysis
- 16.2.10.4. Recent Developments
- 16.2.10.5. Financials (Based on Availability)
- 16.2.11 Midmark Corporation
- 16.2.11.1. Overview
- 16.2.11.2. Products
- 16.2.11.3. SWOT Analysis
- 16.2.11.4. Recent Developments
- 16.2.11.5. Financials (Based on Availability)
- 16.2.12 Ivoclar Vivadent
- 16.2.12.1. Overview
- 16.2.12.2. Products
- 16.2.12.3. SWOT Analysis
- 16.2.12.4. Recent Developments
- 16.2.12.5. Financials (Based on Availability)
- 16.2.1 PLANMECA OY
List of Figures
- Figure 1: Global Dental Market Revenue Breakdown (Million, %) by Region 2024 & 2032
- Figure 2: Global Dental Market Volume Breakdown (K Units, %) by Region 2024 & 2032
- Figure 3: North America Dental Market Revenue (Million), by Country 2024 & 2032
- Figure 4: North America Dental Market Volume (K Units), by Country 2024 & 2032
- Figure 5: North America Dental Market Revenue Share (%), by Country 2024 & 2032
- Figure 6: North America Dental Market Volume Share (%), by Country 2024 & 2032
- Figure 7: Europe Dental Market Revenue (Million), by Country 2024 & 2032
- Figure 8: Europe Dental Market Volume (K Units), by Country 2024 & 2032
- Figure 9: Europe Dental Market Revenue Share (%), by Country 2024 & 2032
- Figure 10: Europe Dental Market Volume Share (%), by Country 2024 & 2032
- Figure 11: Asia Pacific Dental Market Revenue (Million), by Country 2024 & 2032
- Figure 12: Asia Pacific Dental Market Volume (K Units), by Country 2024 & 2032
- Figure 13: Asia Pacific Dental Market Revenue Share (%), by Country 2024 & 2032
- Figure 14: Asia Pacific Dental Market Volume Share (%), by Country 2024 & 2032
- Figure 15: Middle East and Africa Dental Market Revenue (Million), by Country 2024 & 2032
- Figure 16: Middle East and Africa Dental Market Volume (K Units), by Country 2024 & 2032
- Figure 17: Middle East and Africa Dental Market Revenue Share (%), by Country 2024 & 2032
- Figure 18: Middle East and Africa Dental Market Volume Share (%), by Country 2024 & 2032
- Figure 19: South America Dental Market Revenue (Million), by Country 2024 & 2032
- Figure 20: South America Dental Market Volume (K Units), by Country 2024 & 2032
- Figure 21: South America Dental Market Revenue Share (%), by Country 2024 & 2032
- Figure 22: South America Dental Market Volume Share (%), by Country 2024 & 2032
- Figure 23: North America Dental Market Revenue (Million), by Type 2024 & 2032
- Figure 24: North America Dental Market Volume (K Units), by Type 2024 & 2032
- Figure 25: North America Dental Market Revenue Share (%), by Type 2024 & 2032
- Figure 26: North America Dental Market Volume Share (%), by Type 2024 & 2032
- Figure 27: North America Dental Market Revenue (Million), by End User 2024 & 2032
- Figure 28: North America Dental Market Volume (K Units), by End User 2024 & 2032
- Figure 29: North America Dental Market Revenue Share (%), by End User 2024 & 2032
- Figure 30: North America Dental Market Volume Share (%), by End User 2024 & 2032
- Figure 31: North America Dental Market Revenue (Million), by Country 2024 & 2032
- Figure 32: North America Dental Market Volume (K Units), by Country 2024 & 2032
- Figure 33: North America Dental Market Revenue Share (%), by Country 2024 & 2032
- Figure 34: North America Dental Market Volume Share (%), by Country 2024 & 2032
- Figure 35: Europe Dental Market Revenue (Million), by Type 2024 & 2032
- Figure 36: Europe Dental Market Volume (K Units), by Type 2024 & 2032
- Figure 37: Europe Dental Market Revenue Share (%), by Type 2024 & 2032
- Figure 38: Europe Dental Market Volume Share (%), by Type 2024 & 2032
- Figure 39: Europe Dental Market Revenue (Million), by End User 2024 & 2032
- Figure 40: Europe Dental Market Volume (K Units), by End User 2024 & 2032
- Figure 41: Europe Dental Market Revenue Share (%), by End User 2024 & 2032
- Figure 42: Europe Dental Market Volume Share (%), by End User 2024 & 2032
- Figure 43: Europe Dental Market Revenue (Million), by Country 2024 & 2032
- Figure 44: Europe Dental Market Volume (K Units), by Country 2024 & 2032
- Figure 45: Europe Dental Market Revenue Share (%), by Country 2024 & 2032
- Figure 46: Europe Dental Market Volume Share (%), by Country 2024 & 2032
- Figure 47: Asia Pacific Dental Market Revenue (Million), by Type 2024 & 2032
- Figure 48: Asia Pacific Dental Market Volume (K Units), by Type 2024 & 2032
- Figure 49: Asia Pacific Dental Market Revenue Share (%), by Type 2024 & 2032
- Figure 50: Asia Pacific Dental Market Volume Share (%), by Type 2024 & 2032
- Figure 51: Asia Pacific Dental Market Revenue (Million), by End User 2024 & 2032
- Figure 52: Asia Pacific Dental Market Volume (K Units), by End User 2024 & 2032
- Figure 53: Asia Pacific Dental Market Revenue Share (%), by End User 2024 & 2032
- Figure 54: Asia Pacific Dental Market Volume Share (%), by End User 2024 & 2032
- Figure 55: Asia Pacific Dental Market Revenue (Million), by Country 2024 & 2032
- Figure 56: Asia Pacific Dental Market Volume (K Units), by Country 2024 & 2032
- Figure 57: Asia Pacific Dental Market Revenue Share (%), by Country 2024 & 2032
- Figure 58: Asia Pacific Dental Market Volume Share (%), by Country 2024 & 2032
- Figure 59: Middle East and Africa Dental Market Revenue (Million), by Type 2024 & 2032
- Figure 60: Middle East and Africa Dental Market Volume (K Units), by Type 2024 & 2032
- Figure 61: Middle East and Africa Dental Market Revenue Share (%), by Type 2024 & 2032
- Figure 62: Middle East and Africa Dental Market Volume Share (%), by Type 2024 & 2032
- Figure 63: Middle East and Africa Dental Market Revenue (Million), by End User 2024 & 2032
- Figure 64: Middle East and Africa Dental Market Volume (K Units), by End User 2024 & 2032
- Figure 65: Middle East and Africa Dental Market Revenue Share (%), by End User 2024 & 2032
- Figure 66: Middle East and Africa Dental Market Volume Share (%), by End User 2024 & 2032
- Figure 67: Middle East and Africa Dental Market Revenue (Million), by Country 2024 & 2032
- Figure 68: Middle East and Africa Dental Market Volume (K Units), by Country 2024 & 2032
- Figure 69: Middle East and Africa Dental Market Revenue Share (%), by Country 2024 & 2032
- Figure 70: Middle East and Africa Dental Market Volume Share (%), by Country 2024 & 2032
- Figure 71: South America Dental Market Revenue (Million), by Type 2024 & 2032
- Figure 72: South America Dental Market Volume (K Units), by Type 2024 & 2032
- Figure 73: South America Dental Market Revenue Share (%), by Type 2024 & 2032
- Figure 74: South America Dental Market Volume Share (%), by Type 2024 & 2032
- Figure 75: South America Dental Market Revenue (Million), by End User 2024 & 2032
- Figure 76: South America Dental Market Volume (K Units), by End User 2024 & 2032
- Figure 77: South America Dental Market Revenue Share (%), by End User 2024 & 2032
- Figure 78: South America Dental Market Volume Share (%), by End User 2024 & 2032
- Figure 79: South America Dental Market Revenue (Million), by Country 2024 & 2032
- Figure 80: South America Dental Market Volume (K Units), by Country 2024 & 2032
- Figure 81: South America Dental Market Revenue Share (%), by Country 2024 & 2032
- Figure 82: South America Dental Market Volume Share (%), by Country 2024 & 2032
List of Tables
- Table 1: Global Dental Market Revenue Million Forecast, by Region 2019 & 2032
- Table 2: Global Dental Market Volume K Units Forecast, by Region 2019 & 2032
- Table 3: Global Dental Market Revenue Million Forecast, by Type 2019 & 2032
- Table 4: Global Dental Market Volume K Units Forecast, by Type 2019 & 2032
- Table 5: Global Dental Market Revenue Million Forecast, by End User 2019 & 2032
- Table 6: Global Dental Market Volume K Units Forecast, by End User 2019 & 2032
- Table 7: Global Dental Market Revenue Million Forecast, by Region 2019 & 2032
- Table 8: Global Dental Market Volume K Units Forecast, by Region 2019 & 2032
- Table 9: Global Dental Market Revenue Million Forecast, by Country 2019 & 2032
- Table 10: Global Dental Market Volume K Units Forecast, by Country 2019 & 2032
- Table 11: United States Dental Market Revenue (Million) Forecast, by Application 2019 & 2032
- Table 12: United States Dental Market Volume (K Units) Forecast, by Application 2019 & 2032
- Table 13: Canada Dental Market Revenue (Million) Forecast, by Application 2019 & 2032
- Table 14: Canada Dental Market Volume (K Units) Forecast, by Application 2019 & 2032
- Table 15: Mexico Dental Market Revenue (Million) Forecast, by Application 2019 & 2032
- Table 16: Mexico Dental Market Volume (K Units) Forecast, by Application 2019 & 2032
- Table 17: Global Dental Market Revenue Million Forecast, by Country 2019 & 2032
- Table 18: Global Dental Market Volume K Units Forecast, by Country 2019 & 2032
- Table 19: Germany Dental Market Revenue (Million) Forecast, by Application 2019 & 2032
- Table 20: Germany Dental Market Volume (K Units) Forecast, by Application 2019 & 2032
- Table 21: United Kingdom Dental Market Revenue (Million) Forecast, by Application 2019 & 2032
- Table 22: United Kingdom Dental Market Volume (K Units) Forecast, by Application 2019 & 2032
- Table 23: France Dental Market Revenue (Million) Forecast, by Application 2019 & 2032
- Table 24: France Dental Market Volume (K Units) Forecast, by Application 2019 & 2032
- Table 25: Italy Dental Market Revenue (Million) Forecast, by Application 2019 & 2032
- Table 26: Italy Dental Market Volume (K Units) Forecast, by Application 2019 & 2032
- Table 27: Spain Dental Market Revenue (Million) Forecast, by Application 2019 & 2032
- Table 28: Spain Dental Market Volume (K Units) Forecast, by Application 2019 & 2032
- Table 29: Rest of Europe Dental Market Revenue (Million) Forecast, by Application 2019 & 2032
- Table 30: Rest of Europe Dental Market Volume (K Units) Forecast, by Application 2019 & 2032
- Table 31: Global Dental Market Revenue Million Forecast, by Country 2019 & 2032
- Table 32: Global Dental Market Volume K Units Forecast, by Country 2019 & 2032
- Table 33: China Dental Market Revenue (Million) Forecast, by Application 2019 & 2032
- Table 34: China Dental Market Volume (K Units) Forecast, by Application 2019 & 2032
- Table 35: Japan Dental Market Revenue (Million) Forecast, by Application 2019 & 2032
- Table 36: Japan Dental Market Volume (K Units) Forecast, by Application 2019 & 2032
- Table 37: India Dental Market Revenue (Million) Forecast, by Application 2019 & 2032
- Table 38: India Dental Market Volume (K Units) Forecast, by Application 2019 & 2032
- Table 39: Australia Dental Market Revenue (Million) Forecast, by Application 2019 & 2032
- Table 40: Australia Dental Market Volume (K Units) Forecast, by Application 2019 & 2032
- Table 41: South Korea Dental Market Revenue (Million) Forecast, by Application 2019 & 2032
- Table 42: South Korea Dental Market Volume (K Units) Forecast, by Application 2019 & 2032
- Table 43: Rest of Asia Pacific Dental Market Revenue (Million) Forecast, by Application 2019 & 2032
- Table 44: Rest of Asia Pacific Dental Market Volume (K Units) Forecast, by Application 2019 & 2032
- Table 45: Global Dental Market Revenue Million Forecast, by Country 2019 & 2032
- Table 46: Global Dental Market Volume K Units Forecast, by Country 2019 & 2032
- Table 47: GCC Dental Market Revenue (Million) Forecast, by Application 2019 & 2032
- Table 48: GCC Dental Market Volume (K Units) Forecast, by Application 2019 & 2032
- Table 49: South Africa Dental Market Revenue (Million) Forecast, by Application 2019 & 2032
- Table 50: South Africa Dental Market Volume (K Units) Forecast, by Application 2019 & 2032
- Table 51: Rest of Middle East and Africa Dental Market Revenue (Million) Forecast, by Application 2019 & 2032
- Table 52: Rest of Middle East and Africa Dental Market Volume (K Units) Forecast, by Application 2019 & 2032
- Table 53: Global Dental Market Revenue Million Forecast, by Country 2019 & 2032
- Table 54: Global Dental Market Volume K Units Forecast, by Country 2019 & 2032
- Table 55: Brazil Dental Market Revenue (Million) Forecast, by Application 2019 & 2032
- Table 56: Brazil Dental Market Volume (K Units) Forecast, by Application 2019 & 2032
- Table 57: Argentina Dental Market Revenue (Million) Forecast, by Application 2019 & 2032
- Table 58: Argentina Dental Market Volume (K Units) Forecast, by Application 2019 & 2032
- Table 59: Rest of South America Dental Market Revenue (Million) Forecast, by Application 2019 & 2032
- Table 60: Rest of South America Dental Market Volume (K Units) Forecast, by Application 2019 & 2032
- Table 61: Global Dental Market Revenue Million Forecast, by Type 2019 & 2032
- Table 62: Global Dental Market Volume K Units Forecast, by Type 2019 & 2032
- Table 63: Global Dental Market Revenue Million Forecast, by End User 2019 & 2032
- Table 64: Global Dental Market Volume K Units Forecast, by End User 2019 & 2032
- Table 65: Global Dental Market Revenue Million Forecast, by Country 2019 & 2032
- Table 66: Global Dental Market Volume K Units Forecast, by Country 2019 & 2032
- Table 67: United States Dental Market Revenue (Million) Forecast, by Application 2019 & 2032
- Table 68: United States Dental Market Volume (K Units) Forecast, by Application 2019 & 2032
- Table 69: Canada Dental Market Revenue (Million) Forecast, by Application 2019 & 2032
- Table 70: Canada Dental Market Volume (K Units) Forecast, by Application 2019 & 2032
- Table 71: Mexico Dental Market Revenue (Million) Forecast, by Application 2019 & 2032
- Table 72: Mexico Dental Market Volume (K Units) Forecast, by Application 2019 & 2032
- Table 73: Global Dental Market Revenue Million Forecast, by Type 2019 & 2032
- Table 74: Global Dental Market Volume K Units Forecast, by Type 2019 & 2032
- Table 75: Global Dental Market Revenue Million Forecast, by End User 2019 & 2032
- Table 76: Global Dental Market Volume K Units Forecast, by End User 2019 & 2032
- Table 77: Global Dental Market Revenue Million Forecast, by Country 2019 & 2032
- Table 78: Global Dental Market Volume K Units Forecast, by Country 2019 & 2032
- Table 79: Germany Dental Market Revenue (Million) Forecast, by Application 2019 & 2032
- Table 80: Germany Dental Market Volume (K Units) Forecast, by Application 2019 & 2032
- Table 81: United Kingdom Dental Market Revenue (Million) Forecast, by Application 2019 & 2032
- Table 82: United Kingdom Dental Market Volume (K Units) Forecast, by Application 2019 & 2032
- Table 83: France Dental Market Revenue (Million) Forecast, by Application 2019 & 2032
- Table 84: France Dental Market Volume (K Units) Forecast, by Application 2019 & 2032
- Table 85: Italy Dental Market Revenue (Million) Forecast, by Application 2019 & 2032
- Table 86: Italy Dental Market Volume (K Units) Forecast, by Application 2019 & 2032
- Table 87: Spain Dental Market Revenue (Million) Forecast, by Application 2019 & 2032
- Table 88: Spain Dental Market Volume (K Units) Forecast, by Application 2019 & 2032
- Table 89: Rest of Europe Dental Market Revenue (Million) Forecast, by Application 2019 & 2032
- Table 90: Rest of Europe Dental Market Volume (K Units) Forecast, by Application 2019 & 2032
- Table 91: Global Dental Market Revenue Million Forecast, by Type 2019 & 2032
- Table 92: Global Dental Market Volume K Units Forecast, by Type 2019 & 2032
- Table 93: Global Dental Market Revenue Million Forecast, by End User 2019 & 2032
- Table 94: Global Dental Market Volume K Units Forecast, by End User 2019 & 2032
- Table 95: Global Dental Market Revenue Million Forecast, by Country 2019 & 2032
- Table 96: Global Dental Market Volume K Units Forecast, by Country 2019 & 2032
- Table 97: China Dental Market Revenue (Million) Forecast, by Application 2019 & 2032
- Table 98: China Dental Market Volume (K Units) Forecast, by Application 2019 & 2032
- Table 99: Japan Dental Market Revenue (Million) Forecast, by Application 2019 & 2032
- Table 100: Japan Dental Market Volume (K Units) Forecast, by Application 2019 & 2032
- Table 101: India Dental Market Revenue (Million) Forecast, by Application 2019 & 2032
- Table 102: India Dental Market Volume (K Units) Forecast, by Application 2019 & 2032
- Table 103: Australia Dental Market Revenue (Million) Forecast, by Application 2019 & 2032
- Table 104: Australia Dental Market Volume (K Units) Forecast, by Application 2019 & 2032
- Table 105: South Korea Dental Market Revenue (Million) Forecast, by Application 2019 & 2032
- Table 106: South Korea Dental Market Volume (K Units) Forecast, by Application 2019 & 2032
- Table 107: Rest of Asia Pacific Dental Market Revenue (Million) Forecast, by Application 2019 & 2032
- Table 108: Rest of Asia Pacific Dental Market Volume (K Units) Forecast, by Application 2019 & 2032
- Table 109: Global Dental Market Revenue Million Forecast, by Type 2019 & 2032
- Table 110: Global Dental Market Volume K Units Forecast, by Type 2019 & 2032
- Table 111: Global Dental Market Revenue Million Forecast, by End User 2019 & 2032
- Table 112: Global Dental Market Volume K Units Forecast, by End User 2019 & 2032
- Table 113: Global Dental Market Revenue Million Forecast, by Country 2019 & 2032
- Table 114: Global Dental Market Volume K Units Forecast, by Country 2019 & 2032
- Table 115: GCC Dental Market Revenue (Million) Forecast, by Application 2019 & 2032
- Table 116: GCC Dental Market Volume (K Units) Forecast, by Application 2019 & 2032
- Table 117: South Africa Dental Market Revenue (Million) Forecast, by Application 2019 & 2032
- Table 118: South Africa Dental Market Volume (K Units) Forecast, by Application 2019 & 2032
- Table 119: Rest of Middle East and Africa Dental Market Revenue (Million) Forecast, by Application 2019 & 2032
- Table 120: Rest of Middle East and Africa Dental Market Volume (K Units) Forecast, by Application 2019 & 2032
- Table 121: Global Dental Market Revenue Million Forecast, by Type 2019 & 2032
- Table 122: Global Dental Market Volume K Units Forecast, by Type 2019 & 2032
- Table 123: Global Dental Market Revenue Million Forecast, by End User 2019 & 2032
- Table 124: Global Dental Market Volume K Units Forecast, by End User 2019 & 2032
- Table 125: Global Dental Market Revenue Million Forecast, by Country 2019 & 2032
- Table 126: Global Dental Market Volume K Units Forecast, by Country 2019 & 2032
- Table 127: Brazil Dental Market Revenue (Million) Forecast, by Application 2019 & 2032
- Table 128: Brazil Dental Market Volume (K Units) Forecast, by Application 2019 & 2032
- Table 129: Argentina Dental Market Revenue (Million) Forecast, by Application 2019 & 2032
- Table 130: Argentina Dental Market Volume (K Units) Forecast, by Application 2019 & 2032
- Table 131: Rest of South America Dental Market Revenue (Million) Forecast, by Application 2019 & 2032
- Table 132: Rest of South America Dental Market Volume (K Units) Forecast, by Application 2019 & 2032
Frequently Asked Questions
1. What is the projected Compound Annual Growth Rate (CAGR) of the Dental Market?
The projected CAGR is approximately 9.20%.
2. Which companies are prominent players in the Dental Market?
Key companies in the market include PLANMECA OY, Shofu Dental, Zimmer Biomet, Dentsply Sirona, Apteryx Imaging Inc, GC Corporation, J MORITA CORP, Carestream Dental LLC, Kulzer GmbH, Align Technology Inc, Midmark Corporation, Ivoclar Vivadent.
3. What are the main segments of the Dental Market?
The market segments include Type, End User.
4. Can you provide details about the market size?
The market size is estimated to be USD XX Million as of 2022.
5. What are some drivers contributing to market growth?
Increasing Focus on Digital Dentistry; Increasing Geriatric Population.
6. What are the notable trends driving market growth?
Hospitals are Expected to Witness Significant Growth Over the Forecast Period.
7. Are there any restraints impacting market growth?
High Cost Associated With Implementation.
8. Can you provide examples of recent developments in the market?
In November 2022, Imagoworks Inc., launched an artificial intelligence-based web dental CAD 3Dme Crown, an automatic crown design module of 3Dme solutions that helps in generating the crown prosthesis design according to the patient's oral environment.
9. What pricing options are available for accessing the report?
Pricing options include single-user, multi-user, and enterprise licenses priced at USD 4750, USD 5250, and USD 8750 respectively.
10. Is the market size provided in terms of value or volume?
The market size is provided in terms of value, measured in Million and volume, measured in K Units.
11. Are there any specific market keywords associated with the report?
Yes, the market keyword associated with the report is "Dental Market," which aids in identifying and referencing the specific market segment covered.
12. How do I determine which pricing option suits my needs best?
The pricing options vary based on user requirements and access needs. Individual users may opt for single-user licenses, while businesses requiring broader access may choose multi-user or enterprise licenses for cost-effective access to the report.
13. Are there any additional resources or data provided in the Dental Market report?
While the report offers comprehensive insights, it's advisable to review the specific contents or supplementary materials provided to ascertain if additional resources or data are available.
14. How can I stay updated on further developments or reports in the Dental Market?
To stay informed about further developments, trends, and reports in the Dental Market, consider subscribing to industry newsletters, following relevant companies and organizations, or regularly checking reputable industry news sources and publications.
Methodology
Step 1 - Identification of Relevant Samples Size from Population Database


Step 2 - Approaches for Defining Global Market Size (Value, Volume* & Price*)

Note*: In applicable scenarios
Step 3 - Data Sources
Primary Research
- Web Analytics
- Survey Reports
- Research Institute
- Latest Research Reports
- Opinion Leaders
Secondary Research
- Annual Reports
- White Paper
- Latest Press Release
- Industry Association
- Paid Database
- Investor Presentations

Step 4 - Data Triangulation
Involves using different sources of information in order to increase the validity of a study
These sources are likely to be stakeholders in a program - participants, other researchers, program staff, other community members, and so on.
Then we put all data in single framework & apply various statistical tools to find out the dynamic on the market.
During the analysis stage, feedback from the stakeholder groups would be compared to determine areas of agreement as well as areas of divergence


