
Key Insights
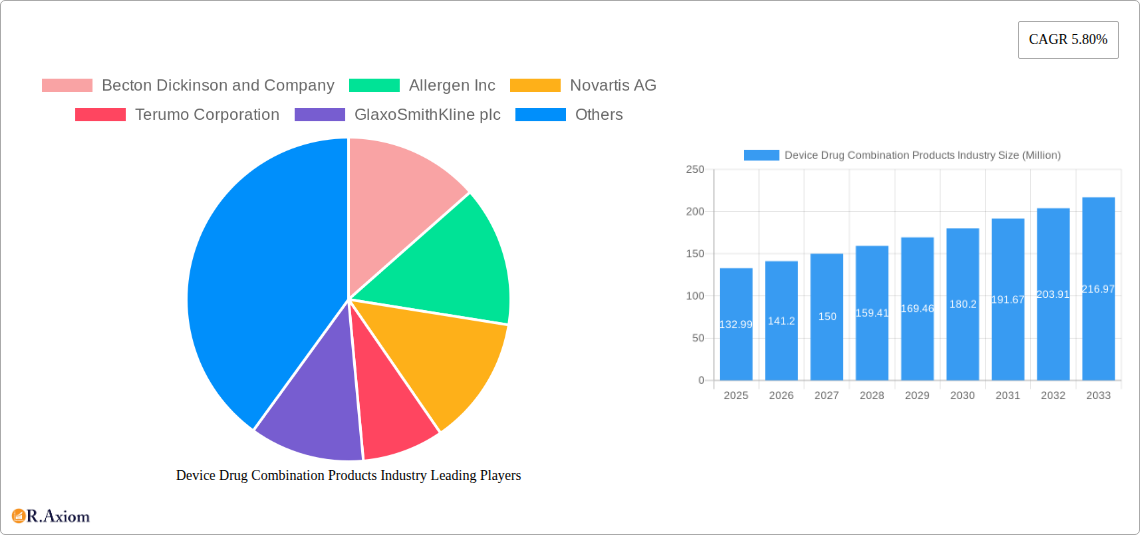
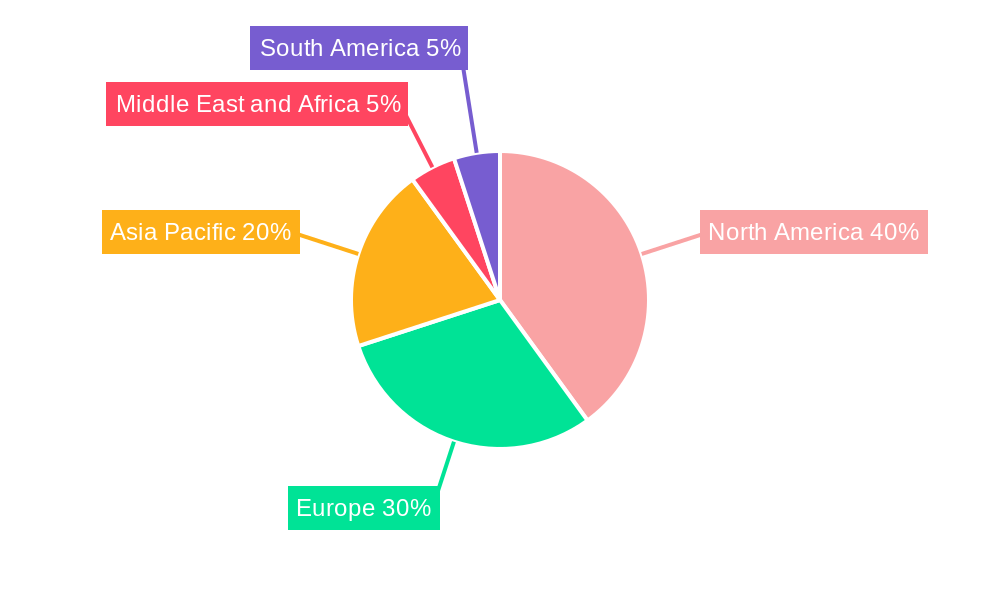
The Device Drug Combination Products market, valued at $132.99 million in 2025, is projected to experience robust growth, driven by several key factors. The increasing prevalence of chronic diseases like cardiovascular conditions, diabetes, and cancer, coupled with the rising geriatric population globally, fuels demand for effective and convenient drug delivery systems. Technological advancements leading to the development of innovative drug-eluting stents, transdermal patches with enhanced efficacy, and sophisticated infusion pumps contribute significantly to market expansion. Furthermore, the growing preference for minimally invasive procedures and outpatient care settings further boosts the adoption of these combination products. The market is segmented by product type (Drug Eluting Stents, Transdermal Patches, Infusion Pumps, Drug Eluting Balloons, Inhalers, and Others), application (Cardiovascular, Diabetes, Cancer Treatment, Respiratory Diseases, and Others), and end-user (Hospitals, Ambulatory Surgical Centers, and Others). North America currently holds a significant market share due to advanced healthcare infrastructure and high adoption rates of innovative medical technologies. However, the Asia-Pacific region is expected to witness substantial growth in the coming years, fueled by rising healthcare expenditure and increasing awareness of advanced treatment options.
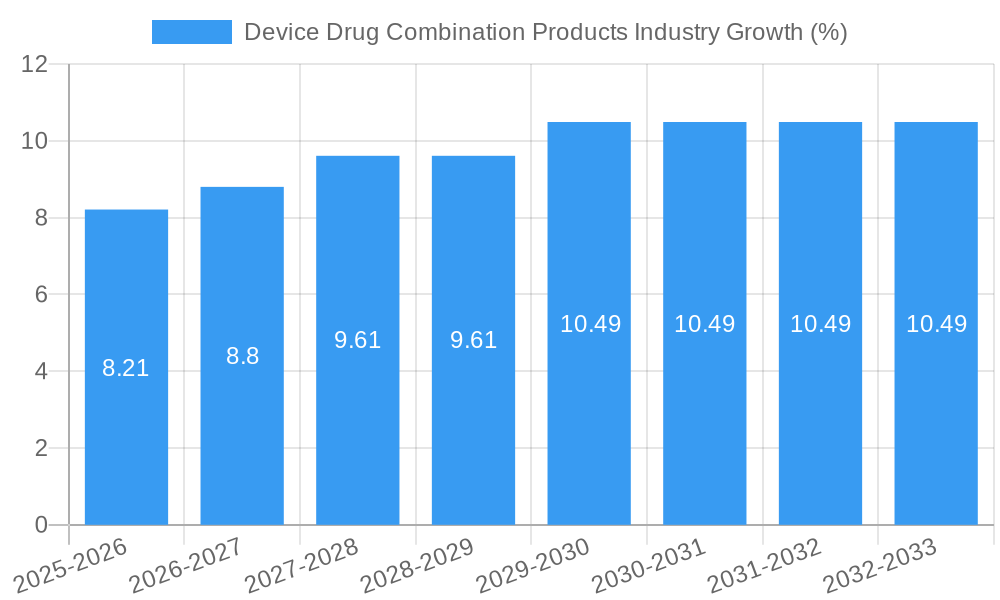
Competition in this market is intense, with major players like Becton Dickinson, Allergan, Novartis, Terumo, GlaxoSmithKline, Abbott Laboratories, W L Gore, Medtronic, Mylan, Stryker, Cook Medical, and Boston Scientific vying for market dominance through research and development, strategic partnerships, and geographic expansion. The projected Compound Annual Growth Rate (CAGR) of 5.80% from 2025 to 2033 indicates a promising future for the industry. While regulatory hurdles and pricing pressures pose potential challenges, the overall market outlook remains positive, driven by continued innovation and the unmet needs of a growing patient population requiring effective and convenient drug delivery solutions. This growth trajectory is expected to continue, fueled by the ongoing development of more sophisticated and targeted drug delivery systems and an expanding global healthcare market.
Device Drug Combination Products Industry: A Comprehensive Market Report (2019-2033)
This in-depth report provides a comprehensive analysis of the Device Drug Combination Products industry, offering invaluable insights for stakeholders, investors, and industry professionals. The report covers the period from 2019 to 2033, with a base year of 2025 and a forecast period spanning 2025-2033. The historical period analyzed is 2019-2024. The global market size in 2025 is estimated at xx Million.
Device Drug Combination Products Industry Market Concentration & Innovation
The Device Drug Combination Products market exhibits a moderately concentrated structure, with a few major players holding significant market share. Becton Dickinson and Company, Allergen Inc, Novartis AG, and Medtronic Plc are among the leading companies, collectively accounting for an estimated xx% of the global market in 2025. However, the market also features several smaller, specialized firms contributing to innovation and competition.
Market concentration is influenced by factors such as:
- High barriers to entry: Significant capital investment, rigorous regulatory approvals, and specialized manufacturing capabilities create high barriers to entry, limiting the number of new entrants.
- Intellectual property protection: Strong patent protection for innovative drug-device combinations provides competitive advantages to established players.
- Mergers and acquisitions (M&A): Strategic acquisitions, such as Novartis' acquisition of Kedalion Therapeutics in June 2022 (value: xx Million), consolidate market share and expand product portfolios. M&A activity in the forecast period is projected to reach xx Million.
Innovation within the industry is driven by:
- Advancements in drug delivery technology: Miniaturization, improved targeting, and controlled release mechanisms enhance treatment efficacy and patient compliance.
- Technological convergence: Integration of advanced materials, sensors, and digital technologies creates smarter, more efficient drug-device combinations.
- Growing demand for personalized medicine: Tailored therapies require innovative delivery systems to address individual patient needs.
Device Drug Combination Products Industry Industry Trends & Insights
The Device Drug Combination Products market is experiencing robust growth, fueled by several key factors. The Compound Annual Growth Rate (CAGR) from 2025 to 2033 is projected to be xx%, driven by an aging global population, increasing prevalence of chronic diseases, and rising healthcare expenditure. Market penetration of innovative drug-device combinations is also increasing, particularly in developed economies.
Key trends include:
- Technological advancements: The development of novel drug-eluting stents, sophisticated implantable devices, and advanced transdermal patches is transforming treatment modalities.
- Focus on improving patient outcomes: Drug-device combination products offer enhanced therapeutic efficacy, reduced side effects, and improved patient compliance compared to conventional therapies.
- Shift toward minimally invasive procedures: These products enable less invasive treatments, leading to shorter hospital stays and faster recovery times.
- Growing adoption of digital health technologies: Integration of connected devices and data analytics is enhancing treatment monitoring and personalized care.
- Increasing regulatory scrutiny: Stringent regulatory requirements are pushing manufacturers to focus on product safety and efficacy. This, in turn, is leading to higher R&D costs and longer development timelines.
Dominant Markets & Segments in Device Drug Combination Products Industry
The North American region currently holds the largest market share due to factors such as high healthcare spending, advanced healthcare infrastructure, and early adoption of new technologies. Within this region, the United States represents the most significant market. In Europe, Western European countries exhibit higher market growth compared to Eastern European countries. Asia-Pacific is expected to witness the fastest growth due to rising healthcare awareness, improving healthcare infrastructure, and the burgeoning middle class.
Key Drivers by Segment:
- Products: Drug-eluting stents dominate the product segment due to their wide application in cardiovascular treatments. However, growth is also expected in other segments such as transdermal patches and drug-eluting balloons, driven by innovations in materials science and delivery systems.
- Application: Cardiovascular applications account for the largest segment share due to the high prevalence of heart diseases. However, other applications, such as diabetes and cancer treatment, are also experiencing substantial growth driven by technological advancements.
- End-User: Hospitals are the largest end-users due to their sophisticated infrastructure and specialized medical professionals. However, the ambulatory surgical center segment is expected to see faster growth owing to cost-effectiveness and convenience for patients.
Detailed analysis reveals that the cardiovascular application segment within hospitals continues to dominate the market, driven by high prevalence of cardiovascular diseases and advancements in drug-eluting stents.
Device Drug Combination Products Industry Product Developments
Recent innovations focus on improving drug delivery efficiency, minimizing side effects, and enhancing patient compliance. Examples include advancements in biodegradable stents, personalized drug-eluting balloons, and advanced transdermal patch technologies that improve drug absorption and reduce skin irritation. These developments are enhancing the market appeal of drug-device combination products by creating more effective and patient-friendly treatment options. Technological trends like miniaturization, smart sensors, and remote monitoring capabilities are shaping the future product landscape.
Report Scope & Segmentation Analysis
This report segments the Device Drug Combination Products market based on Product (Drug Eluting Stents, Transdermal Patches, Infusion Pumps, Drug Eluting Balloon, Inhalers, Others), Application (Cardiovascular, Diabetes, Cancer Treatment, Respiratory Diseases, Others), and End-User (Hospitals, Ambulatory Surgical Centers, Others). Each segment’s growth projections, market size, and competitive dynamics are comprehensively analyzed. The forecast suggests significant growth across all segments, with variations in growth rates depending on technological advancements and regulatory approvals. Competitive landscapes are analyzed for each segment, highlighting key players and their market strategies.
Key Drivers of Device Drug Combination Products Industry Growth
The growth of the Device Drug Combination Products industry is primarily driven by several converging factors. Technological advancements such as the development of smart drug delivery systems and minimally invasive devices directly enhance therapeutic efficacy. The rising prevalence of chronic diseases like diabetes, cancer, and cardiovascular diseases increases the demand for effective treatment options. Favorable economic conditions in developed and emerging markets create higher healthcare expenditure and facilitate investment in advanced medical technologies. Supportive regulatory frameworks that streamline approval processes accelerate the adoption of new and innovative drug-device combinations.
Challenges in the Device Drug Combination Products Industry Sector
The industry faces significant challenges, including stringent regulatory requirements leading to high development costs and time-to-market delays. Complex manufacturing processes and supply chain vulnerabilities can impact production efficiency and product availability. Intense competition among established players and the entry of new innovative companies create pressure on pricing and profit margins. These challenges affect market growth but also drive continuous innovation and improvement within the industry.
Emerging Opportunities in Device Drug Combination Products Industry
Emerging opportunities include growth in developing economies with expanding healthcare sectors. The development and adoption of personalized medicine utilizing advanced diagnostics and targeted drug delivery systems is creating significant opportunities. The integration of digital health technologies in the form of connected medical devices and remote monitoring platforms can further enhance patient management and treatment outcomes.
Leading Players in the Device Drug Combination Products Industry Market
- Becton Dickinson and Company (Becton Dickinson)
- Allergen Inc
- Novartis AG (Novartis)
- Terumo Corporation (Terumo)
- GlaxoSmithKline plc (GlaxoSmithKline)
- Abbott Laboratories (Abbott)
- W L Gore & Associates Inc (W. L. Gore & Associates)
- Medtronic Plc (Medtronic)
- Mylan NV
- Stryker Corporation (Stryker)
- Cook Medical (Cook Medical)
- Boston Scientific Corp (Boston Scientific)
Key Developments in Device Drug Combination Products Industry Industry
- August 2022: Terumo Corporation launched G-Lasta Subcutaneous Injection 3.6 mg BodyPod, a drug-device combination product co-developed with Kyowa Kirin Co., Ltd. The product received approval from Japan's Ministry of Health, Labour, and Welfare (MHLW), expanding Terumo's presence in the Japanese market.
- June 2022: Novartis acquired Kedalion Therapeutics and its AcuStream technology. This acquisition enhances Novartis' ophthalmics portfolio and positions them to address unmet needs in front-of-eye conditions.
Strategic Outlook for Device Drug Combination Products Industry Market
The Device Drug Combination Products market presents a promising outlook, driven by persistent technological innovations, favorable regulatory environments, and rising healthcare expenditure. Continued growth is anticipated in emerging markets and specialized application areas. The integration of digital health and personalized medicine will further drive market expansion. Strategic partnerships, acquisitions, and R&D investments are key to success in this dynamic and competitive market.
Device Drug Combination Products Industry Segmentation
-
1. Products
- 1.1. Drug Eluting Stents
- 1.2. Transdermal Patches
- 1.3. Infusion Pumps
- 1.4. Drug Eluting Balloon
- 1.5. Inhalers
- 1.6. Others
-
2. Application
- 2.1. Cardiovascular
- 2.2. Diabetes
- 2.3. Cancer Treatment
- 2.4. Respiratory Diseases
- 2.5. Others
-
3. End-User
- 3.1. Hospitals
- 3.2. Ambulatory Surgical Centers
- 3.3. Others
Device Drug Combination Products Industry Segmentation By Geography
-
1. North America
- 1.1. United States
- 1.2. Canada
- 1.3. Mexico
-
2. Europe
- 2.1. Germany
- 2.2. United Kingdom
- 2.3. France
- 2.4. Italy
- 2.5. Spain
- 2.6. Rest of Europe
-
3. Asia Pacific
- 3.1. China
- 3.2. Japan
- 3.3. India
- 3.4. Australia
- 3.5. South Korea
- 3.6. Rest of Asia Pacific
-
4. Middle East and Africa
- 4.1. GCC
- 4.2. South Africa
- 4.3. Rest of Middle East and Africa
-
5. South America
- 5.1. Brazil
- 5.2. Argentina
- 5.3. Rest of South America
Device Drug Combination Products Industry REPORT HIGHLIGHTS
| Aspects | Details |
|---|---|
| Study Period | 2019-2033 |
| Base Year | 2024 |
| Estimated Year | 2025 |
| Forecast Period | 2025-2033 |
| Historical Period | 2019-2024 |
| Growth Rate | CAGR of 5.80% from 2019-2033 |
| Segmentation |
|
Table of Contents
- 1. Introduction
- 1.1. Research Scope
- 1.2. Market Segmentation
- 1.3. Research Methodology
- 1.4. Definitions and Assumptions
- 2. Executive Summary
- 2.1. Introduction
- 3. Market Dynamics
- 3.1. Introduction
- 3.2. Market Drivers
- 3.2.1. Growing Incidence of Chronic Diseases coupled with Need For Novel Drug Delivery Systems; Increase in Geriatric Population
- 3.3. Market Restrains
- 3.3.1. Stringent Government Policies; Product Recalls and Associated Complications
- 3.4. Market Trends
- 3.4.1. Drug Eluting Stents are Expected to Grow at Notable Rates Over the Forecast Period.
- 4. Market Factor Analysis
- 4.1. Porters Five Forces
- 4.2. Supply/Value Chain
- 4.3. PESTEL analysis
- 4.4. Market Entropy
- 4.5. Patent/Trademark Analysis
- 5. Global Device Drug Combination Products Industry Analysis, Insights and Forecast, 2019-2031
- 5.1. Market Analysis, Insights and Forecast - by Products
- 5.1.1. Drug Eluting Stents
- 5.1.2. Transdermal Patches
- 5.1.3. Infusion Pumps
- 5.1.4. Drug Eluting Balloon
- 5.1.5. Inhalers
- 5.1.6. Others
- 5.2. Market Analysis, Insights and Forecast - by Application
- 5.2.1. Cardiovascular
- 5.2.2. Diabetes
- 5.2.3. Cancer Treatment
- 5.2.4. Respiratory Diseases
- 5.2.5. Others
- 5.3. Market Analysis, Insights and Forecast - by End-User
- 5.3.1. Hospitals
- 5.3.2. Ambulatory Surgical Centers
- 5.3.3. Others
- 5.4. Market Analysis, Insights and Forecast - by Region
- 5.4.1. North America
- 5.4.2. Europe
- 5.4.3. Asia Pacific
- 5.4.4. Middle East and Africa
- 5.4.5. South America
- 5.1. Market Analysis, Insights and Forecast - by Products
- 6. North America Device Drug Combination Products Industry Analysis, Insights and Forecast, 2019-2031
- 6.1. Market Analysis, Insights and Forecast - by Products
- 6.1.1. Drug Eluting Stents
- 6.1.2. Transdermal Patches
- 6.1.3. Infusion Pumps
- 6.1.4. Drug Eluting Balloon
- 6.1.5. Inhalers
- 6.1.6. Others
- 6.2. Market Analysis, Insights and Forecast - by Application
- 6.2.1. Cardiovascular
- 6.2.2. Diabetes
- 6.2.3. Cancer Treatment
- 6.2.4. Respiratory Diseases
- 6.2.5. Others
- 6.3. Market Analysis, Insights and Forecast - by End-User
- 6.3.1. Hospitals
- 6.3.2. Ambulatory Surgical Centers
- 6.3.3. Others
- 6.1. Market Analysis, Insights and Forecast - by Products
- 7. Europe Device Drug Combination Products Industry Analysis, Insights and Forecast, 2019-2031
- 7.1. Market Analysis, Insights and Forecast - by Products
- 7.1.1. Drug Eluting Stents
- 7.1.2. Transdermal Patches
- 7.1.3. Infusion Pumps
- 7.1.4. Drug Eluting Balloon
- 7.1.5. Inhalers
- 7.1.6. Others
- 7.2. Market Analysis, Insights and Forecast - by Application
- 7.2.1. Cardiovascular
- 7.2.2. Diabetes
- 7.2.3. Cancer Treatment
- 7.2.4. Respiratory Diseases
- 7.2.5. Others
- 7.3. Market Analysis, Insights and Forecast - by End-User
- 7.3.1. Hospitals
- 7.3.2. Ambulatory Surgical Centers
- 7.3.3. Others
- 7.1. Market Analysis, Insights and Forecast - by Products
- 8. Asia Pacific Device Drug Combination Products Industry Analysis, Insights and Forecast, 2019-2031
- 8.1. Market Analysis, Insights and Forecast - by Products
- 8.1.1. Drug Eluting Stents
- 8.1.2. Transdermal Patches
- 8.1.3. Infusion Pumps
- 8.1.4. Drug Eluting Balloon
- 8.1.5. Inhalers
- 8.1.6. Others
- 8.2. Market Analysis, Insights and Forecast - by Application
- 8.2.1. Cardiovascular
- 8.2.2. Diabetes
- 8.2.3. Cancer Treatment
- 8.2.4. Respiratory Diseases
- 8.2.5. Others
- 8.3. Market Analysis, Insights and Forecast - by End-User
- 8.3.1. Hospitals
- 8.3.2. Ambulatory Surgical Centers
- 8.3.3. Others
- 8.1. Market Analysis, Insights and Forecast - by Products
- 9. Middle East and Africa Device Drug Combination Products Industry Analysis, Insights and Forecast, 2019-2031
- 9.1. Market Analysis, Insights and Forecast - by Products
- 9.1.1. Drug Eluting Stents
- 9.1.2. Transdermal Patches
- 9.1.3. Infusion Pumps
- 9.1.4. Drug Eluting Balloon
- 9.1.5. Inhalers
- 9.1.6. Others
- 9.2. Market Analysis, Insights and Forecast - by Application
- 9.2.1. Cardiovascular
- 9.2.2. Diabetes
- 9.2.3. Cancer Treatment
- 9.2.4. Respiratory Diseases
- 9.2.5. Others
- 9.3. Market Analysis, Insights and Forecast - by End-User
- 9.3.1. Hospitals
- 9.3.2. Ambulatory Surgical Centers
- 9.3.3. Others
- 9.1. Market Analysis, Insights and Forecast - by Products
- 10. South America Device Drug Combination Products Industry Analysis, Insights and Forecast, 2019-2031
- 10.1. Market Analysis, Insights and Forecast - by Products
- 10.1.1. Drug Eluting Stents
- 10.1.2. Transdermal Patches
- 10.1.3. Infusion Pumps
- 10.1.4. Drug Eluting Balloon
- 10.1.5. Inhalers
- 10.1.6. Others
- 10.2. Market Analysis, Insights and Forecast - by Application
- 10.2.1. Cardiovascular
- 10.2.2. Diabetes
- 10.2.3. Cancer Treatment
- 10.2.4. Respiratory Diseases
- 10.2.5. Others
- 10.3. Market Analysis, Insights and Forecast - by End-User
- 10.3.1. Hospitals
- 10.3.2. Ambulatory Surgical Centers
- 10.3.3. Others
- 10.1. Market Analysis, Insights and Forecast - by Products
- 11. North America Device Drug Combination Products Industry Analysis, Insights and Forecast, 2019-2031
- 11.1. Market Analysis, Insights and Forecast - By Country/Sub-region
- 11.1.1. undefined
- 12. Europe Device Drug Combination Products Industry Analysis, Insights and Forecast, 2019-2031
- 12.1. Market Analysis, Insights and Forecast - By Country/Sub-region
- 12.1.1. undefined
- 13. Asia Pacific Device Drug Combination Products Industry Analysis, Insights and Forecast, 2019-2031
- 13.1. Market Analysis, Insights and Forecast - By Country/Sub-region
- 13.1.1. undefined
- 14. Middle East and Africa Device Drug Combination Products Industry Analysis, Insights and Forecast, 2019-2031
- 14.1. Market Analysis, Insights and Forecast - By Country/Sub-region
- 14.1.1. undefined
- 15. South America Device Drug Combination Products Industry Analysis, Insights and Forecast, 2019-2031
- 15.1. Market Analysis, Insights and Forecast - By Country/Sub-region
- 15.1.1. undefined
- 16. Competitive Analysis
- 16.1. Global Market Share Analysis 2024
- 16.2. Company Profiles
- 16.2.1 Becton Dickinson and Company
- 16.2.1.1. Overview
- 16.2.1.2. Products
- 16.2.1.3. SWOT Analysis
- 16.2.1.4. Recent Developments
- 16.2.1.5. Financials (Based on Availability)
- 16.2.2 Allergen Inc
- 16.2.2.1. Overview
- 16.2.2.2. Products
- 16.2.2.3. SWOT Analysis
- 16.2.2.4. Recent Developments
- 16.2.2.5. Financials (Based on Availability)
- 16.2.3 Novartis AG
- 16.2.3.1. Overview
- 16.2.3.2. Products
- 16.2.3.3. SWOT Analysis
- 16.2.3.4. Recent Developments
- 16.2.3.5. Financials (Based on Availability)
- 16.2.4 Terumo Corporation
- 16.2.4.1. Overview
- 16.2.4.2. Products
- 16.2.4.3. SWOT Analysis
- 16.2.4.4. Recent Developments
- 16.2.4.5. Financials (Based on Availability)
- 16.2.5 GlaxoSmithKline plc
- 16.2.5.1. Overview
- 16.2.5.2. Products
- 16.2.5.3. SWOT Analysis
- 16.2.5.4. Recent Developments
- 16.2.5.5. Financials (Based on Availability)
- 16.2.6 Abbott Laboratories
- 16.2.6.1. Overview
- 16.2.6.2. Products
- 16.2.6.3. SWOT Analysis
- 16.2.6.4. Recent Developments
- 16.2.6.5. Financials (Based on Availability)
- 16.2.7 W L Gore & Associates Inc
- 16.2.7.1. Overview
- 16.2.7.2. Products
- 16.2.7.3. SWOT Analysis
- 16.2.7.4. Recent Developments
- 16.2.7.5. Financials (Based on Availability)
- 16.2.8 Medtronic Plc
- 16.2.8.1. Overview
- 16.2.8.2. Products
- 16.2.8.3. SWOT Analysis
- 16.2.8.4. Recent Developments
- 16.2.8.5. Financials (Based on Availability)
- 16.2.9 Mylan NV
- 16.2.9.1. Overview
- 16.2.9.2. Products
- 16.2.9.3. SWOT Analysis
- 16.2.9.4. Recent Developments
- 16.2.9.5. Financials (Based on Availability)
- 16.2.10 Stryker Corporation
- 16.2.10.1. Overview
- 16.2.10.2. Products
- 16.2.10.3. SWOT Analysis
- 16.2.10.4. Recent Developments
- 16.2.10.5. Financials (Based on Availability)
- 16.2.11 Cook Medical
- 16.2.11.1. Overview
- 16.2.11.2. Products
- 16.2.11.3. SWOT Analysis
- 16.2.11.4. Recent Developments
- 16.2.11.5. Financials (Based on Availability)
- 16.2.12 Boston Scientific Corp
- 16.2.12.1. Overview
- 16.2.12.2. Products
- 16.2.12.3. SWOT Analysis
- 16.2.12.4. Recent Developments
- 16.2.12.5. Financials (Based on Availability)
- 16.2.1 Becton Dickinson and Company
List of Figures
- Figure 1: Global Device Drug Combination Products Industry Revenue Breakdown (Million, %) by Region 2024 & 2032
- Figure 2: Global Device Drug Combination Products Industry Volume Breakdown (K Unit, %) by Region 2024 & 2032
- Figure 3: North America Device Drug Combination Products Industry Revenue (Million), by Country 2024 & 2032
- Figure 4: North America Device Drug Combination Products Industry Volume (K Unit), by Country 2024 & 2032
- Figure 5: North America Device Drug Combination Products Industry Revenue Share (%), by Country 2024 & 2032
- Figure 6: North America Device Drug Combination Products Industry Volume Share (%), by Country 2024 & 2032
- Figure 7: Europe Device Drug Combination Products Industry Revenue (Million), by Country 2024 & 2032
- Figure 8: Europe Device Drug Combination Products Industry Volume (K Unit), by Country 2024 & 2032
- Figure 9: Europe Device Drug Combination Products Industry Revenue Share (%), by Country 2024 & 2032
- Figure 10: Europe Device Drug Combination Products Industry Volume Share (%), by Country 2024 & 2032
- Figure 11: Asia Pacific Device Drug Combination Products Industry Revenue (Million), by Country 2024 & 2032
- Figure 12: Asia Pacific Device Drug Combination Products Industry Volume (K Unit), by Country 2024 & 2032
- Figure 13: Asia Pacific Device Drug Combination Products Industry Revenue Share (%), by Country 2024 & 2032
- Figure 14: Asia Pacific Device Drug Combination Products Industry Volume Share (%), by Country 2024 & 2032
- Figure 15: Middle East and Africa Device Drug Combination Products Industry Revenue (Million), by Country 2024 & 2032
- Figure 16: Middle East and Africa Device Drug Combination Products Industry Volume (K Unit), by Country 2024 & 2032
- Figure 17: Middle East and Africa Device Drug Combination Products Industry Revenue Share (%), by Country 2024 & 2032
- Figure 18: Middle East and Africa Device Drug Combination Products Industry Volume Share (%), by Country 2024 & 2032
- Figure 19: South America Device Drug Combination Products Industry Revenue (Million), by Country 2024 & 2032
- Figure 20: South America Device Drug Combination Products Industry Volume (K Unit), by Country 2024 & 2032
- Figure 21: South America Device Drug Combination Products Industry Revenue Share (%), by Country 2024 & 2032
- Figure 22: South America Device Drug Combination Products Industry Volume Share (%), by Country 2024 & 2032
- Figure 23: North America Device Drug Combination Products Industry Revenue (Million), by Products 2024 & 2032
- Figure 24: North America Device Drug Combination Products Industry Volume (K Unit), by Products 2024 & 2032
- Figure 25: North America Device Drug Combination Products Industry Revenue Share (%), by Products 2024 & 2032
- Figure 26: North America Device Drug Combination Products Industry Volume Share (%), by Products 2024 & 2032
- Figure 27: North America Device Drug Combination Products Industry Revenue (Million), by Application 2024 & 2032
- Figure 28: North America Device Drug Combination Products Industry Volume (K Unit), by Application 2024 & 2032
- Figure 29: North America Device Drug Combination Products Industry Revenue Share (%), by Application 2024 & 2032
- Figure 30: North America Device Drug Combination Products Industry Volume Share (%), by Application 2024 & 2032
- Figure 31: North America Device Drug Combination Products Industry Revenue (Million), by End-User 2024 & 2032
- Figure 32: North America Device Drug Combination Products Industry Volume (K Unit), by End-User 2024 & 2032
- Figure 33: North America Device Drug Combination Products Industry Revenue Share (%), by End-User 2024 & 2032
- Figure 34: North America Device Drug Combination Products Industry Volume Share (%), by End-User 2024 & 2032
- Figure 35: North America Device Drug Combination Products Industry Revenue (Million), by Country 2024 & 2032
- Figure 36: North America Device Drug Combination Products Industry Volume (K Unit), by Country 2024 & 2032
- Figure 37: North America Device Drug Combination Products Industry Revenue Share (%), by Country 2024 & 2032
- Figure 38: North America Device Drug Combination Products Industry Volume Share (%), by Country 2024 & 2032
- Figure 39: Europe Device Drug Combination Products Industry Revenue (Million), by Products 2024 & 2032
- Figure 40: Europe Device Drug Combination Products Industry Volume (K Unit), by Products 2024 & 2032
- Figure 41: Europe Device Drug Combination Products Industry Revenue Share (%), by Products 2024 & 2032
- Figure 42: Europe Device Drug Combination Products Industry Volume Share (%), by Products 2024 & 2032
- Figure 43: Europe Device Drug Combination Products Industry Revenue (Million), by Application 2024 & 2032
- Figure 44: Europe Device Drug Combination Products Industry Volume (K Unit), by Application 2024 & 2032
- Figure 45: Europe Device Drug Combination Products Industry Revenue Share (%), by Application 2024 & 2032
- Figure 46: Europe Device Drug Combination Products Industry Volume Share (%), by Application 2024 & 2032
- Figure 47: Europe Device Drug Combination Products Industry Revenue (Million), by End-User 2024 & 2032
- Figure 48: Europe Device Drug Combination Products Industry Volume (K Unit), by End-User 2024 & 2032
- Figure 49: Europe Device Drug Combination Products Industry Revenue Share (%), by End-User 2024 & 2032
- Figure 50: Europe Device Drug Combination Products Industry Volume Share (%), by End-User 2024 & 2032
- Figure 51: Europe Device Drug Combination Products Industry Revenue (Million), by Country 2024 & 2032
- Figure 52: Europe Device Drug Combination Products Industry Volume (K Unit), by Country 2024 & 2032
- Figure 53: Europe Device Drug Combination Products Industry Revenue Share (%), by Country 2024 & 2032
- Figure 54: Europe Device Drug Combination Products Industry Volume Share (%), by Country 2024 & 2032
- Figure 55: Asia Pacific Device Drug Combination Products Industry Revenue (Million), by Products 2024 & 2032
- Figure 56: Asia Pacific Device Drug Combination Products Industry Volume (K Unit), by Products 2024 & 2032
- Figure 57: Asia Pacific Device Drug Combination Products Industry Revenue Share (%), by Products 2024 & 2032
- Figure 58: Asia Pacific Device Drug Combination Products Industry Volume Share (%), by Products 2024 & 2032
- Figure 59: Asia Pacific Device Drug Combination Products Industry Revenue (Million), by Application 2024 & 2032
- Figure 60: Asia Pacific Device Drug Combination Products Industry Volume (K Unit), by Application 2024 & 2032
- Figure 61: Asia Pacific Device Drug Combination Products Industry Revenue Share (%), by Application 2024 & 2032
- Figure 62: Asia Pacific Device Drug Combination Products Industry Volume Share (%), by Application 2024 & 2032
- Figure 63: Asia Pacific Device Drug Combination Products Industry Revenue (Million), by End-User 2024 & 2032
- Figure 64: Asia Pacific Device Drug Combination Products Industry Volume (K Unit), by End-User 2024 & 2032
- Figure 65: Asia Pacific Device Drug Combination Products Industry Revenue Share (%), by End-User 2024 & 2032
- Figure 66: Asia Pacific Device Drug Combination Products Industry Volume Share (%), by End-User 2024 & 2032
- Figure 67: Asia Pacific Device Drug Combination Products Industry Revenue (Million), by Country 2024 & 2032
- Figure 68: Asia Pacific Device Drug Combination Products Industry Volume (K Unit), by Country 2024 & 2032
- Figure 69: Asia Pacific Device Drug Combination Products Industry Revenue Share (%), by Country 2024 & 2032
- Figure 70: Asia Pacific Device Drug Combination Products Industry Volume Share (%), by Country 2024 & 2032
- Figure 71: Middle East and Africa Device Drug Combination Products Industry Revenue (Million), by Products 2024 & 2032
- Figure 72: Middle East and Africa Device Drug Combination Products Industry Volume (K Unit), by Products 2024 & 2032
- Figure 73: Middle East and Africa Device Drug Combination Products Industry Revenue Share (%), by Products 2024 & 2032
- Figure 74: Middle East and Africa Device Drug Combination Products Industry Volume Share (%), by Products 2024 & 2032
- Figure 75: Middle East and Africa Device Drug Combination Products Industry Revenue (Million), by Application 2024 & 2032
- Figure 76: Middle East and Africa Device Drug Combination Products Industry Volume (K Unit), by Application 2024 & 2032
- Figure 77: Middle East and Africa Device Drug Combination Products Industry Revenue Share (%), by Application 2024 & 2032
- Figure 78: Middle East and Africa Device Drug Combination Products Industry Volume Share (%), by Application 2024 & 2032
- Figure 79: Middle East and Africa Device Drug Combination Products Industry Revenue (Million), by End-User 2024 & 2032
- Figure 80: Middle East and Africa Device Drug Combination Products Industry Volume (K Unit), by End-User 2024 & 2032
- Figure 81: Middle East and Africa Device Drug Combination Products Industry Revenue Share (%), by End-User 2024 & 2032
- Figure 82: Middle East and Africa Device Drug Combination Products Industry Volume Share (%), by End-User 2024 & 2032
- Figure 83: Middle East and Africa Device Drug Combination Products Industry Revenue (Million), by Country 2024 & 2032
- Figure 84: Middle East and Africa Device Drug Combination Products Industry Volume (K Unit), by Country 2024 & 2032
- Figure 85: Middle East and Africa Device Drug Combination Products Industry Revenue Share (%), by Country 2024 & 2032
- Figure 86: Middle East and Africa Device Drug Combination Products Industry Volume Share (%), by Country 2024 & 2032
- Figure 87: South America Device Drug Combination Products Industry Revenue (Million), by Products 2024 & 2032
- Figure 88: South America Device Drug Combination Products Industry Volume (K Unit), by Products 2024 & 2032
- Figure 89: South America Device Drug Combination Products Industry Revenue Share (%), by Products 2024 & 2032
- Figure 90: South America Device Drug Combination Products Industry Volume Share (%), by Products 2024 & 2032
- Figure 91: South America Device Drug Combination Products Industry Revenue (Million), by Application 2024 & 2032
- Figure 92: South America Device Drug Combination Products Industry Volume (K Unit), by Application 2024 & 2032
- Figure 93: South America Device Drug Combination Products Industry Revenue Share (%), by Application 2024 & 2032
- Figure 94: South America Device Drug Combination Products Industry Volume Share (%), by Application 2024 & 2032
- Figure 95: South America Device Drug Combination Products Industry Revenue (Million), by End-User 2024 & 2032
- Figure 96: South America Device Drug Combination Products Industry Volume (K Unit), by End-User 2024 & 2032
- Figure 97: South America Device Drug Combination Products Industry Revenue Share (%), by End-User 2024 & 2032
- Figure 98: South America Device Drug Combination Products Industry Volume Share (%), by End-User 2024 & 2032
- Figure 99: South America Device Drug Combination Products Industry Revenue (Million), by Country 2024 & 2032
- Figure 100: South America Device Drug Combination Products Industry Volume (K Unit), by Country 2024 & 2032
- Figure 101: South America Device Drug Combination Products Industry Revenue Share (%), by Country 2024 & 2032
- Figure 102: South America Device Drug Combination Products Industry Volume Share (%), by Country 2024 & 2032
List of Tables
- Table 1: Global Device Drug Combination Products Industry Revenue Million Forecast, by Region 2019 & 2032
- Table 2: Global Device Drug Combination Products Industry Volume K Unit Forecast, by Region 2019 & 2032
- Table 3: Global Device Drug Combination Products Industry Revenue Million Forecast, by Products 2019 & 2032
- Table 4: Global Device Drug Combination Products Industry Volume K Unit Forecast, by Products 2019 & 2032
- Table 5: Global Device Drug Combination Products Industry Revenue Million Forecast, by Application 2019 & 2032
- Table 6: Global Device Drug Combination Products Industry Volume K Unit Forecast, by Application 2019 & 2032
- Table 7: Global Device Drug Combination Products Industry Revenue Million Forecast, by End-User 2019 & 2032
- Table 8: Global Device Drug Combination Products Industry Volume K Unit Forecast, by End-User 2019 & 2032
- Table 9: Global Device Drug Combination Products Industry Revenue Million Forecast, by Region 2019 & 2032
- Table 10: Global Device Drug Combination Products Industry Volume K Unit Forecast, by Region 2019 & 2032
- Table 11: Global Device Drug Combination Products Industry Revenue Million Forecast, by Country 2019 & 2032
- Table 12: Global Device Drug Combination Products Industry Volume K Unit Forecast, by Country 2019 & 2032
- Table 13: Global Device Drug Combination Products Industry Revenue Million Forecast, by Country 2019 & 2032
- Table 14: Global Device Drug Combination Products Industry Volume K Unit Forecast, by Country 2019 & 2032
- Table 15: Global Device Drug Combination Products Industry Revenue Million Forecast, by Country 2019 & 2032
- Table 16: Global Device Drug Combination Products Industry Volume K Unit Forecast, by Country 2019 & 2032
- Table 17: Global Device Drug Combination Products Industry Revenue Million Forecast, by Country 2019 & 2032
- Table 18: Global Device Drug Combination Products Industry Volume K Unit Forecast, by Country 2019 & 2032
- Table 19: Global Device Drug Combination Products Industry Revenue Million Forecast, by Country 2019 & 2032
- Table 20: Global Device Drug Combination Products Industry Volume K Unit Forecast, by Country 2019 & 2032
- Table 21: Global Device Drug Combination Products Industry Revenue Million Forecast, by Products 2019 & 2032
- Table 22: Global Device Drug Combination Products Industry Volume K Unit Forecast, by Products 2019 & 2032
- Table 23: Global Device Drug Combination Products Industry Revenue Million Forecast, by Application 2019 & 2032
- Table 24: Global Device Drug Combination Products Industry Volume K Unit Forecast, by Application 2019 & 2032
- Table 25: Global Device Drug Combination Products Industry Revenue Million Forecast, by End-User 2019 & 2032
- Table 26: Global Device Drug Combination Products Industry Volume K Unit Forecast, by End-User 2019 & 2032
- Table 27: Global Device Drug Combination Products Industry Revenue Million Forecast, by Country 2019 & 2032
- Table 28: Global Device Drug Combination Products Industry Volume K Unit Forecast, by Country 2019 & 2032
- Table 29: United States Device Drug Combination Products Industry Revenue (Million) Forecast, by Application 2019 & 2032
- Table 30: United States Device Drug Combination Products Industry Volume (K Unit) Forecast, by Application 2019 & 2032
- Table 31: Canada Device Drug Combination Products Industry Revenue (Million) Forecast, by Application 2019 & 2032
- Table 32: Canada Device Drug Combination Products Industry Volume (K Unit) Forecast, by Application 2019 & 2032
- Table 33: Mexico Device Drug Combination Products Industry Revenue (Million) Forecast, by Application 2019 & 2032
- Table 34: Mexico Device Drug Combination Products Industry Volume (K Unit) Forecast, by Application 2019 & 2032
- Table 35: Global Device Drug Combination Products Industry Revenue Million Forecast, by Products 2019 & 2032
- Table 36: Global Device Drug Combination Products Industry Volume K Unit Forecast, by Products 2019 & 2032
- Table 37: Global Device Drug Combination Products Industry Revenue Million Forecast, by Application 2019 & 2032
- Table 38: Global Device Drug Combination Products Industry Volume K Unit Forecast, by Application 2019 & 2032
- Table 39: Global Device Drug Combination Products Industry Revenue Million Forecast, by End-User 2019 & 2032
- Table 40: Global Device Drug Combination Products Industry Volume K Unit Forecast, by End-User 2019 & 2032
- Table 41: Global Device Drug Combination Products Industry Revenue Million Forecast, by Country 2019 & 2032
- Table 42: Global Device Drug Combination Products Industry Volume K Unit Forecast, by Country 2019 & 2032
- Table 43: Germany Device Drug Combination Products Industry Revenue (Million) Forecast, by Application 2019 & 2032
- Table 44: Germany Device Drug Combination Products Industry Volume (K Unit) Forecast, by Application 2019 & 2032
- Table 45: United Kingdom Device Drug Combination Products Industry Revenue (Million) Forecast, by Application 2019 & 2032
- Table 46: United Kingdom Device Drug Combination Products Industry Volume (K Unit) Forecast, by Application 2019 & 2032
- Table 47: France Device Drug Combination Products Industry Revenue (Million) Forecast, by Application 2019 & 2032
- Table 48: France Device Drug Combination Products Industry Volume (K Unit) Forecast, by Application 2019 & 2032
- Table 49: Italy Device Drug Combination Products Industry Revenue (Million) Forecast, by Application 2019 & 2032
- Table 50: Italy Device Drug Combination Products Industry Volume (K Unit) Forecast, by Application 2019 & 2032
- Table 51: Spain Device Drug Combination Products Industry Revenue (Million) Forecast, by Application 2019 & 2032
- Table 52: Spain Device Drug Combination Products Industry Volume (K Unit) Forecast, by Application 2019 & 2032
- Table 53: Rest of Europe Device Drug Combination Products Industry Revenue (Million) Forecast, by Application 2019 & 2032
- Table 54: Rest of Europe Device Drug Combination Products Industry Volume (K Unit) Forecast, by Application 2019 & 2032
- Table 55: Global Device Drug Combination Products Industry Revenue Million Forecast, by Products 2019 & 2032
- Table 56: Global Device Drug Combination Products Industry Volume K Unit Forecast, by Products 2019 & 2032
- Table 57: Global Device Drug Combination Products Industry Revenue Million Forecast, by Application 2019 & 2032
- Table 58: Global Device Drug Combination Products Industry Volume K Unit Forecast, by Application 2019 & 2032
- Table 59: Global Device Drug Combination Products Industry Revenue Million Forecast, by End-User 2019 & 2032
- Table 60: Global Device Drug Combination Products Industry Volume K Unit Forecast, by End-User 2019 & 2032
- Table 61: Global Device Drug Combination Products Industry Revenue Million Forecast, by Country 2019 & 2032
- Table 62: Global Device Drug Combination Products Industry Volume K Unit Forecast, by Country 2019 & 2032
- Table 63: China Device Drug Combination Products Industry Revenue (Million) Forecast, by Application 2019 & 2032
- Table 64: China Device Drug Combination Products Industry Volume (K Unit) Forecast, by Application 2019 & 2032
- Table 65: Japan Device Drug Combination Products Industry Revenue (Million) Forecast, by Application 2019 & 2032
- Table 66: Japan Device Drug Combination Products Industry Volume (K Unit) Forecast, by Application 2019 & 2032
- Table 67: India Device Drug Combination Products Industry Revenue (Million) Forecast, by Application 2019 & 2032
- Table 68: India Device Drug Combination Products Industry Volume (K Unit) Forecast, by Application 2019 & 2032
- Table 69: Australia Device Drug Combination Products Industry Revenue (Million) Forecast, by Application 2019 & 2032
- Table 70: Australia Device Drug Combination Products Industry Volume (K Unit) Forecast, by Application 2019 & 2032
- Table 71: South Korea Device Drug Combination Products Industry Revenue (Million) Forecast, by Application 2019 & 2032
- Table 72: South Korea Device Drug Combination Products Industry Volume (K Unit) Forecast, by Application 2019 & 2032
- Table 73: Rest of Asia Pacific Device Drug Combination Products Industry Revenue (Million) Forecast, by Application 2019 & 2032
- Table 74: Rest of Asia Pacific Device Drug Combination Products Industry Volume (K Unit) Forecast, by Application 2019 & 2032
- Table 75: Global Device Drug Combination Products Industry Revenue Million Forecast, by Products 2019 & 2032
- Table 76: Global Device Drug Combination Products Industry Volume K Unit Forecast, by Products 2019 & 2032
- Table 77: Global Device Drug Combination Products Industry Revenue Million Forecast, by Application 2019 & 2032
- Table 78: Global Device Drug Combination Products Industry Volume K Unit Forecast, by Application 2019 & 2032
- Table 79: Global Device Drug Combination Products Industry Revenue Million Forecast, by End-User 2019 & 2032
- Table 80: Global Device Drug Combination Products Industry Volume K Unit Forecast, by End-User 2019 & 2032
- Table 81: Global Device Drug Combination Products Industry Revenue Million Forecast, by Country 2019 & 2032
- Table 82: Global Device Drug Combination Products Industry Volume K Unit Forecast, by Country 2019 & 2032
- Table 83: GCC Device Drug Combination Products Industry Revenue (Million) Forecast, by Application 2019 & 2032
- Table 84: GCC Device Drug Combination Products Industry Volume (K Unit) Forecast, by Application 2019 & 2032
- Table 85: South Africa Device Drug Combination Products Industry Revenue (Million) Forecast, by Application 2019 & 2032
- Table 86: South Africa Device Drug Combination Products Industry Volume (K Unit) Forecast, by Application 2019 & 2032
- Table 87: Rest of Middle East and Africa Device Drug Combination Products Industry Revenue (Million) Forecast, by Application 2019 & 2032
- Table 88: Rest of Middle East and Africa Device Drug Combination Products Industry Volume (K Unit) Forecast, by Application 2019 & 2032
- Table 89: Global Device Drug Combination Products Industry Revenue Million Forecast, by Products 2019 & 2032
- Table 90: Global Device Drug Combination Products Industry Volume K Unit Forecast, by Products 2019 & 2032
- Table 91: Global Device Drug Combination Products Industry Revenue Million Forecast, by Application 2019 & 2032
- Table 92: Global Device Drug Combination Products Industry Volume K Unit Forecast, by Application 2019 & 2032
- Table 93: Global Device Drug Combination Products Industry Revenue Million Forecast, by End-User 2019 & 2032
- Table 94: Global Device Drug Combination Products Industry Volume K Unit Forecast, by End-User 2019 & 2032
- Table 95: Global Device Drug Combination Products Industry Revenue Million Forecast, by Country 2019 & 2032
- Table 96: Global Device Drug Combination Products Industry Volume K Unit Forecast, by Country 2019 & 2032
- Table 97: Brazil Device Drug Combination Products Industry Revenue (Million) Forecast, by Application 2019 & 2032
- Table 98: Brazil Device Drug Combination Products Industry Volume (K Unit) Forecast, by Application 2019 & 2032
- Table 99: Argentina Device Drug Combination Products Industry Revenue (Million) Forecast, by Application 2019 & 2032
- Table 100: Argentina Device Drug Combination Products Industry Volume (K Unit) Forecast, by Application 2019 & 2032
- Table 101: Rest of South America Device Drug Combination Products Industry Revenue (Million) Forecast, by Application 2019 & 2032
- Table 102: Rest of South America Device Drug Combination Products Industry Volume (K Unit) Forecast, by Application 2019 & 2032
Frequently Asked Questions
1. What is the projected Compound Annual Growth Rate (CAGR) of the Device Drug Combination Products Industry?
The projected CAGR is approximately 5.80%.
2. Which companies are prominent players in the Device Drug Combination Products Industry?
Key companies in the market include Becton Dickinson and Company, Allergen Inc, Novartis AG, Terumo Corporation, GlaxoSmithKline plc, Abbott Laboratories, W L Gore & Associates Inc, Medtronic Plc, Mylan NV, Stryker Corporation, Cook Medical, Boston Scientific Corp.
3. What are the main segments of the Device Drug Combination Products Industry?
The market segments include Products, Application, End-User.
4. Can you provide details about the market size?
The market size is estimated to be USD 132.99 Million as of 2022.
5. What are some drivers contributing to market growth?
Growing Incidence of Chronic Diseases coupled with Need For Novel Drug Delivery Systems; Increase in Geriatric Population.
6. What are the notable trends driving market growth?
Drug Eluting Stents are Expected to Grow at Notable Rates Over the Forecast Period..
7. Are there any restraints impacting market growth?
Stringent Government Policies; Product Recalls and Associated Complications.
8. Can you provide examples of recent developments in the market?
August 2022: Terumo Corporation launched G-Lasta Subcutaneous Injection 3.6 mg BodyPod', a drug-device combination product co-developed with Kyowa Kirin Co., Ltd. The product received approval from Japan's Ministry of Health, Labour, and Welfare (MHLW).
9. What pricing options are available for accessing the report?
Pricing options include single-user, multi-user, and enterprise licenses priced at USD 4750, USD 5250, and USD 8750 respectively.
10. Is the market size provided in terms of value or volume?
The market size is provided in terms of value, measured in Million and volume, measured in K Unit.
11. Are there any specific market keywords associated with the report?
Yes, the market keyword associated with the report is "Device Drug Combination Products Industry," which aids in identifying and referencing the specific market segment covered.
12. How do I determine which pricing option suits my needs best?
The pricing options vary based on user requirements and access needs. Individual users may opt for single-user licenses, while businesses requiring broader access may choose multi-user or enterprise licenses for cost-effective access to the report.
13. Are there any additional resources or data provided in the Device Drug Combination Products Industry report?
While the report offers comprehensive insights, it's advisable to review the specific contents or supplementary materials provided to ascertain if additional resources or data are available.
14. How can I stay updated on further developments or reports in the Device Drug Combination Products Industry?
To stay informed about further developments, trends, and reports in the Device Drug Combination Products Industry, consider subscribing to industry newsletters, following relevant companies and organizations, or regularly checking reputable industry news sources and publications.
Methodology
Step 1 - Identification of Relevant Samples Size from Population Database


Step 2 - Approaches for Defining Global Market Size (Value, Volume* & Price*)

Note*: In applicable scenarios
Step 3 - Data Sources
Primary Research
- Web Analytics
- Survey Reports
- Research Institute
- Latest Research Reports
- Opinion Leaders
Secondary Research
- Annual Reports
- White Paper
- Latest Press Release
- Industry Association
- Paid Database
- Investor Presentations

Step 4 - Data Triangulation
Involves using different sources of information in order to increase the validity of a study
These sources are likely to be stakeholders in a program - participants, other researchers, program staff, other community members, and so on.
Then we put all data in single framework & apply various statistical tools to find out the dynamic on the market.
During the analysis stage, feedback from the stakeholder groups would be compared to determine areas of agreement as well as areas of divergence


