
Key Insights
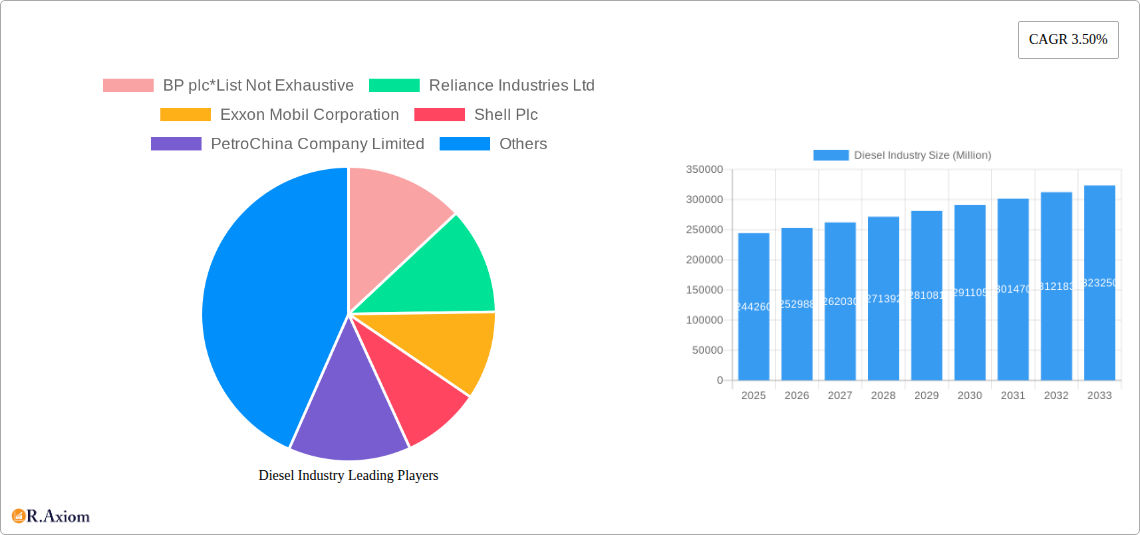
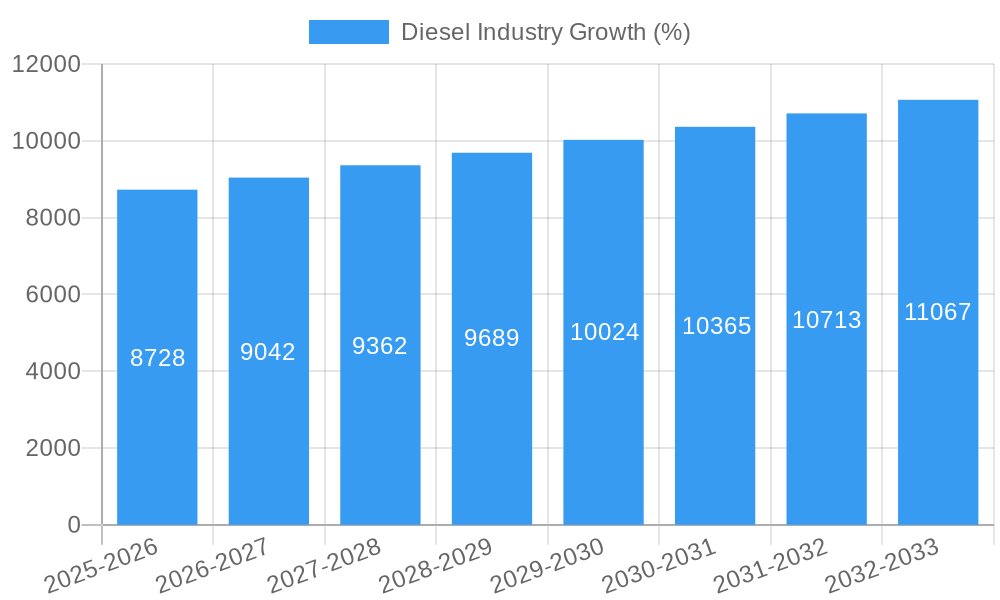
The global diesel fuel market, valued at $244.26 billion in 2025, is projected to experience steady growth, driven primarily by the robust demand from the transportation and industrial sectors. A compound annual growth rate (CAGR) of 3.50% from 2025 to 2033 indicates a continued, albeit moderate, expansion. The transportation segment, encompassing heavy-duty vehicles, shipping, and rail, remains the largest consumer, while industrial applications, including power generation and machinery operation, contribute significantly. Growth is further fueled by increasing global industrialization and infrastructure development, especially in emerging economies. However, the market faces headwinds from stringent environmental regulations aimed at reducing greenhouse gas emissions and promoting the adoption of alternative fuels. This includes stricter emission standards and carbon taxes, pushing towards cleaner energy sources like biofuels and hydrogen. The ongoing transition to electric vehicles and government incentives for their adoption pose a significant, albeit gradual, threat to diesel's market share, especially in the transportation sector. The competitive landscape is dominated by major oil and gas companies with extensive refining and distribution networks, engaging in continuous strategies to improve efficiency and diversify their product offerings. Geographical variations exist, with North America and Asia Pacific likely leading the market given their substantial industrial activity and transportation networks.
The forecast period (2025-2033) will witness a complex interplay of growth drivers and restraining factors. While the global economy's trajectory and industrial output will play a key role, the intensity of environmental regulations and the pace of the transition to cleaner fuels will critically influence diesel's future market trajectory. Diversification within the industry, including investments in lower-emission diesel technologies and exploration of fuel blends, will be crucial for major players to maintain market share and profitability. Regional disparities will likely persist, influenced by economic growth rates, regulatory frameworks, and the unique energy needs of different geographical zones. Consequently, a nuanced approach is necessary to anticipate the diesel fuel market's growth, considering the balance between persistent demand and evolving environmental concerns.
Diesel Industry Market Report: 2019-2033
This comprehensive report provides a detailed analysis of the global diesel industry, offering valuable insights for stakeholders, investors, and industry professionals. The study period spans from 2019 to 2033, with a base year of 2025 and a forecast period from 2025 to 2033. The report encompasses market size estimations (in Millions) across various segments and regions, identifying key trends, challenges, and growth opportunities. The report's value lies in its detailed analysis, actionable insights, and precise market forecasts, providing a 360-degree view of this dynamic industry.
Diesel Industry Market Concentration & Innovation
The global diesel industry exhibits a concentrated market structure, dominated by a handful of major integrated oil and gas companies. These giants control a significant portion of the upstream, midstream, and downstream value chain, impacting market dynamics significantly. The market share of the top 10 players accounts for approximately xx Million in 2024. Key players such as BP plc, Reliance Industries Ltd, Exxon Mobil Corporation, Shell Plc, PetroChina Company Limited, NK Rosneft' PAO, Chevron Corporation, Saudi Arabian Oil Co, Qatar Petroleum, and SK energy Co Ltd, influence pricing, production, and distribution significantly.
- Market Share: BP plc holds an estimated xx% market share, followed by ExxonMobil at xx%, and Shell at xx% in 2024.
- M&A Activity: The industry has witnessed significant M&A activity in recent years, with deal values exceeding xx Million in the period 2019-2024. This consolidation further reinforces market concentration. These mergers are driven by the need for economies of scale, access to new technologies and resources, and diversification strategies in the face of evolving market conditions.
- Innovation: Innovation in diesel technology is driven by stringent emission regulations, focusing on reducing harmful pollutants and improving fuel efficiency. The development of ultra-low sulfur diesel (ULSD) and the research into alternative fuels like biodiesel and renewable diesel are key examples. However, the pace of innovation is constrained by the high capital expenditure required for new technologies and the inherent inertia of established players.
- Regulatory Frameworks: Government regulations play a crucial role in shaping the industry, driving the adoption of cleaner fuels and impacting overall profitability. Stringent emission standards, coupled with carbon pricing mechanisms, necessitate significant investments in upgrading refining facilities and developing new technologies.
Diesel Industry Industry Trends & Insights
The global diesel market is characterized by several key trends, influencing its future trajectory. The market is projected to witness a CAGR of xx% during the forecast period (2025-2033). Growth is primarily driven by the increasing demand from the transportation sector, particularly in developing economies experiencing rapid industrialization and urbanization. However, the shift towards electric vehicles and government policies promoting sustainable transportation pose significant challenges. This creates a complex scenario where continued growth in certain sectors is offset by declining demand in others. The market penetration of ULSD fuels continues to increase, reflecting the growing emphasis on environmental sustainability. Competitive dynamics are intense, with major players investing heavily in refining capabilities and diversifying their product portfolio to meet the evolving market needs. Technological disruptions stemming from the development of alternative fuels and powertrains are expected to alter the competitive landscape substantially, particularly during the second half of the forecast period. Consumer preferences are also changing, with increasing awareness of environmental issues influencing fuel choices and transportation modes. The shift in consumer preferences further compels businesses to adapt and innovate in order to stay competitive.
Dominant Markets & Segments in Diesel Industry
The transportation sector represents the largest segment of the diesel market, accounting for approximately xx Million in 2024. This dominance is primarily attributed to the widespread use of diesel engines in heavy-duty vehicles, including trucks, buses, and construction equipment. However, the industrial segment also contributes significantly, with substantial diesel consumption in manufacturing, power generation, and agriculture. The 'Others' segment, which encompasses various niche applications, also shows potential for growth, although it is currently less significant compared to the transportation and industrial segments.
Key Drivers for Transportation Segment Dominance:
- Robust growth of the logistics and transportation industries.
- Increasing demand for heavy-duty vehicles in developing economies.
- Relatively lower cost compared to other fuels.
Key Drivers for Industrial Segment Growth:
- Continued expansion of manufacturing industries.
- Increasing use of diesel generators in remote areas.
- Reliance on diesel-powered machinery in agriculture.
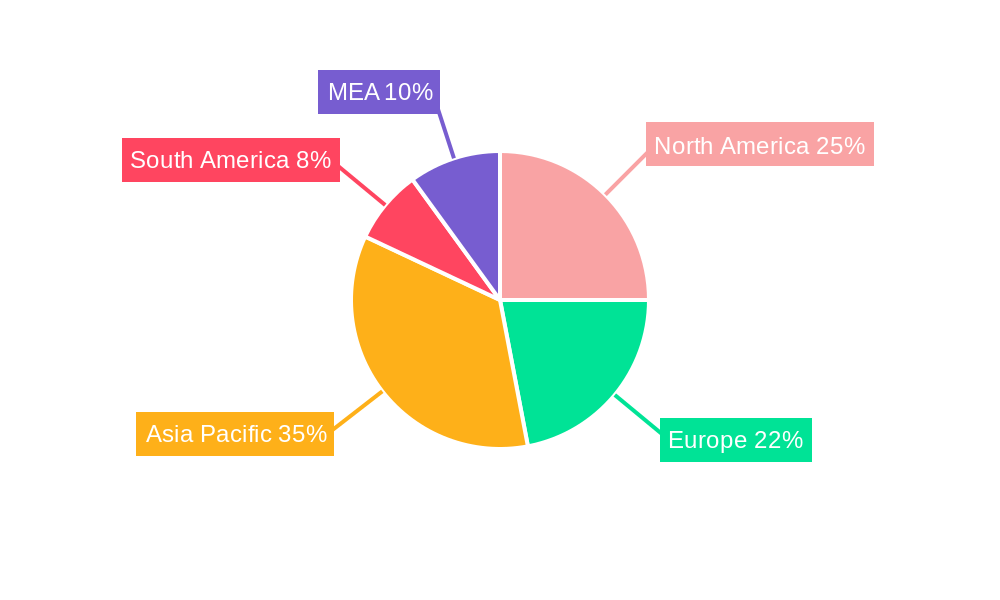
Geographically, Asia-Pacific holds the largest market share, followed by North America and Europe. This is primarily due to the high concentration of industrial activities and a large transportation sector in these regions. However, the regulatory environment in each region significantly influences the market's growth trajectory.
Diesel Industry Product Developments
Recent product developments in the diesel industry have focused on improving fuel efficiency, reducing emissions, and enhancing performance. This includes the introduction of advanced fuel additives, the development of cleaner-burning diesel formulations, and the incorporation of biofuels into diesel blends. These advancements aim to meet increasingly stringent emission standards and address environmental concerns. The market is also witnessing the emergence of new technologies, such as synthetic diesel fuels and hydrogen-diesel blends, promising even greater improvements in sustainability and performance. The competitive advantages of these innovations largely depend on their cost-effectiveness and ability to meet regulatory requirements while maintaining the performance characteristics expected by consumers.
Report Scope & Segmentation Analysis
The report segments the diesel industry based on end-user applications: Transportation, Industrial, and Others.
Transportation: This segment includes on-road and off-road vehicles. Growth is projected at xx% CAGR (2025-2033), driven by increasing freight and passenger transportation. However, the shift towards electric vehicles and stricter emission norms present challenges.
Industrial: This segment covers manufacturing, power generation, and agriculture. Growth is projected at xx% CAGR (2025-2033), driven by economic expansion and industrialization. However, the adoption of alternative energy sources poses a threat.
Others: This segment consists of niche applications with moderate growth potential. Projected growth is xx% CAGR (2025-2033).
Key Drivers of Diesel Industry Growth
The growth of the diesel industry is propelled by several factors. Economic expansion in developing nations fuels demand for transportation and industrial activities reliant on diesel. Technological advancements in diesel engine technology improve fuel efficiency and reduce emissions. However, government regulations aimed at reducing carbon emissions and promoting alternative energy sources create both challenges and opportunities for the industry. The continued reliance of the heavy-duty vehicle sector on diesel is also a significant factor.
Challenges in the Diesel Industry Sector
The diesel industry faces several challenges. Stringent emission regulations worldwide necessitate costly upgrades to refining processes and engine technologies. The growing preference for electric vehicles and alternative fuels poses a significant threat to diesel's market share. Moreover, fluctuating crude oil prices and geopolitical instability create supply chain uncertainties and price volatility, significantly impacting profitability. These factors combine to present a complex set of hurdles to navigate for continued success.
Emerging Opportunities in Diesel Industry
Despite the challenges, opportunities exist within the diesel industry. The development of sustainable biofuels and renewable diesel offers a pathway to decarbonize the sector. Expansion into new markets, particularly in developing economies, presents growth potential. Furthermore, technological innovation leading to the development of more efficient and cleaner diesel engines can create new markets and competitive advantages. The focus on optimizing current diesel technology to meet tightening emissions regulations presents further opportunities for growth.
Leading Players in the Diesel Industry Market
- BP plc
- Reliance Industries Ltd
- Exxon Mobil Corporation
- Shell Plc
- PetroChina Company Limited
- NK Rosneft' PAO
- Chevron Corporation
- Saudi Arabian Oil Co
- Qatar Petroleum
- SK energy Co Ltd
Key Developments in Diesel Industry Industry
May 2023: Petrobras' revised fuel pricing policy in Brazil resulted in a nearly 13% reduction in gasoline and diesel prices, significantly impacting consumer spending and market dynamics.
February 2023: The European Union's confirmation of a ban on new petrol and diesel car sales from 2035 will dramatically reshape the automotive and diesel fuel markets, prompting a major shift towards electric vehicles and alternative fuels.
Strategic Outlook for Diesel Industry Market
The future of the diesel industry will be defined by its ability to adapt to evolving regulatory landscapes and consumer preferences. While facing challenges from the transition to electric vehicles and stricter emission standards, the industry still holds substantial potential, particularly in sectors where diesel remains indispensable, such as heavy-duty transportation and certain industrial applications. The focus on sustainable fuels and technological innovation to reduce emissions will be key to unlocking future growth and ensuring the long-term viability of the diesel industry. The market is expected to consolidate further, with larger players likely to acquire smaller ones. The focus on operational efficiency, cost reduction and sustainability will be crucial factors impacting future success.
Diesel Industry Segmentation
-
1. End-User
- 1.1. Transporation
- 1.2. Industrial
- 1.3. Others
Diesel Industry Segmentation By Geography
-
1. North America
- 1.1. United States
- 1.2. Canada
- 1.3. Rest of North America
-
2. Europe
- 2.1. United Kingdom
- 2.2. Russia
- 2.3. Germany
- 2.4. Norway
- 2.5. Rest of Europe
-
3. Asia Pacific
- 3.1. China
- 3.2. India
- 3.3. Indonesia
- 3.4. Malaysia
- 3.5. Vietnam
-
4. Middle East and Africa
- 4.1. Saudi Arabia
- 4.2. United Arab Emirates
- 4.3. South Africa
- 4.4. Nigeria
- 4.5. Egypt
- 4.6. Rest of Middle East and Africa
-
5. South America
- 5.1. Argentina
- 5.2. Brazil
- 5.3. Venezuela
- 5.4. Rest of South America
Diesel Industry REPORT HIGHLIGHTS
| Aspects | Details |
|---|---|
| Study Period | 2019-2033 |
| Base Year | 2024 |
| Estimated Year | 2025 |
| Forecast Period | 2025-2033 |
| Historical Period | 2019-2024 |
| Growth Rate | CAGR of 3.50% from 2019-2033 |
| Segmentation |
|
Table of Contents
- 1. Introduction
- 1.1. Research Scope
- 1.2. Market Segmentation
- 1.3. Research Methodology
- 1.4. Definitions and Assumptions
- 2. Executive Summary
- 2.1. Introduction
- 3. Market Dynamics
- 3.1. Introduction
- 3.2. Market Drivers
- 3.2.1. Increasing Demand from Industrial Applications4.; Growing Infrastructure Across the World
- 3.3. Market Restrains
- 3.3.1. A Rise in Concerns Related to Carbon Emissions and A Shift Towards Electric Vehicles and Renewable Sources of Energy
- 3.4. Market Trends
- 3.4.1. Transportation Segment is to Expected to Dominate in the Market
- 4. Market Factor Analysis
- 4.1. Porters Five Forces
- 4.2. Supply/Value Chain
- 4.3. PESTEL analysis
- 4.4. Market Entropy
- 4.5. Patent/Trademark Analysis
- 5. Global Diesel Industry Analysis, Insights and Forecast, 2019-2031
- 5.1. Market Analysis, Insights and Forecast - by End-User
- 5.1.1. Transporation
- 5.1.2. Industrial
- 5.1.3. Others
- 5.2. Market Analysis, Insights and Forecast - by Region
- 5.2.1. North America
- 5.2.2. Europe
- 5.2.3. Asia Pacific
- 5.2.4. Middle East and Africa
- 5.2.5. South America
- 5.1. Market Analysis, Insights and Forecast - by End-User
- 6. North America Diesel Industry Analysis, Insights and Forecast, 2019-2031
- 6.1. Market Analysis, Insights and Forecast - by End-User
- 6.1.1. Transporation
- 6.1.2. Industrial
- 6.1.3. Others
- 6.1. Market Analysis, Insights and Forecast - by End-User
- 7. Europe Diesel Industry Analysis, Insights and Forecast, 2019-2031
- 7.1. Market Analysis, Insights and Forecast - by End-User
- 7.1.1. Transporation
- 7.1.2. Industrial
- 7.1.3. Others
- 7.1. Market Analysis, Insights and Forecast - by End-User
- 8. Asia Pacific Diesel Industry Analysis, Insights and Forecast, 2019-2031
- 8.1. Market Analysis, Insights and Forecast - by End-User
- 8.1.1. Transporation
- 8.1.2. Industrial
- 8.1.3. Others
- 8.1. Market Analysis, Insights and Forecast - by End-User
- 9. Middle East and Africa Diesel Industry Analysis, Insights and Forecast, 2019-2031
- 9.1. Market Analysis, Insights and Forecast - by End-User
- 9.1.1. Transporation
- 9.1.2. Industrial
- 9.1.3. Others
- 9.1. Market Analysis, Insights and Forecast - by End-User
- 10. South America Diesel Industry Analysis, Insights and Forecast, 2019-2031
- 10.1. Market Analysis, Insights and Forecast - by End-User
- 10.1.1. Transporation
- 10.1.2. Industrial
- 10.1.3. Others
- 10.1. Market Analysis, Insights and Forecast - by End-User
- 11. North America Diesel Industry Analysis, Insights and Forecast, 2019-2031
- 11.1. Market Analysis, Insights and Forecast - By Country/Sub-region
- 11.1.1 United States
- 11.1.2 Canada
- 11.1.3 Mexico
- 12. Europe Diesel Industry Analysis, Insights and Forecast, 2019-2031
- 12.1. Market Analysis, Insights and Forecast - By Country/Sub-region
- 12.1.1 Germany
- 12.1.2 United Kingdom
- 12.1.3 France
- 12.1.4 Spain
- 12.1.5 Italy
- 12.1.6 Spain
- 12.1.7 Belgium
- 12.1.8 Netherland
- 12.1.9 Nordics
- 12.1.10 Rest of Europe
- 13. Asia Pacific Diesel Industry Analysis, Insights and Forecast, 2019-2031
- 13.1. Market Analysis, Insights and Forecast - By Country/Sub-region
- 13.1.1 China
- 13.1.2 Japan
- 13.1.3 India
- 13.1.4 South Korea
- 13.1.5 Southeast Asia
- 13.1.6 Australia
- 13.1.7 Indonesia
- 13.1.8 Phillipes
- 13.1.9 Singapore
- 13.1.10 Thailandc
- 13.1.11 Rest of Asia Pacific
- 14. South America Diesel Industry Analysis, Insights and Forecast, 2019-2031
- 14.1. Market Analysis, Insights and Forecast - By Country/Sub-region
- 14.1.1 Brazil
- 14.1.2 Argentina
- 14.1.3 Peru
- 14.1.4 Chile
- 14.1.5 Colombia
- 14.1.6 Ecuador
- 14.1.7 Venezuela
- 14.1.8 Rest of South America
- 15. North America Diesel Industry Analysis, Insights and Forecast, 2019-2031
- 15.1. Market Analysis, Insights and Forecast - By Country/Sub-region
- 15.1.1 United States
- 15.1.2 Canada
- 15.1.3 Mexico
- 16. MEA Diesel Industry Analysis, Insights and Forecast, 2019-2031
- 16.1. Market Analysis, Insights and Forecast - By Country/Sub-region
- 16.1.1 United Arab Emirates
- 16.1.2 Saudi Arabia
- 16.1.3 South Africa
- 16.1.4 Rest of Middle East and Africa
- 17. Competitive Analysis
- 17.1. Global Market Share Analysis 2024
- 17.2. Company Profiles
- 17.2.1 BP plc*List Not Exhaustive
- 17.2.1.1. Overview
- 17.2.1.2. Products
- 17.2.1.3. SWOT Analysis
- 17.2.1.4. Recent Developments
- 17.2.1.5. Financials (Based on Availability)
- 17.2.2 Reliance Industries Ltd
- 17.2.2.1. Overview
- 17.2.2.2. Products
- 17.2.2.3. SWOT Analysis
- 17.2.2.4. Recent Developments
- 17.2.2.5. Financials (Based on Availability)
- 17.2.3 Exxon Mobil Corporation
- 17.2.3.1. Overview
- 17.2.3.2. Products
- 17.2.3.3. SWOT Analysis
- 17.2.3.4. Recent Developments
- 17.2.3.5. Financials (Based on Availability)
- 17.2.4 Shell Plc
- 17.2.4.1. Overview
- 17.2.4.2. Products
- 17.2.4.3. SWOT Analysis
- 17.2.4.4. Recent Developments
- 17.2.4.5. Financials (Based on Availability)
- 17.2.5 PetroChina Company Limited
- 17.2.5.1. Overview
- 17.2.5.2. Products
- 17.2.5.3. SWOT Analysis
- 17.2.5.4. Recent Developments
- 17.2.5.5. Financials (Based on Availability)
- 17.2.6 NK Rosneft' PAO
- 17.2.6.1. Overview
- 17.2.6.2. Products
- 17.2.6.3. SWOT Analysis
- 17.2.6.4. Recent Developments
- 17.2.6.5. Financials (Based on Availability)
- 17.2.7 Chevron Corporation
- 17.2.7.1. Overview
- 17.2.7.2. Products
- 17.2.7.3. SWOT Analysis
- 17.2.7.4. Recent Developments
- 17.2.7.5. Financials (Based on Availability)
- 17.2.8 Saudi Arabian Oil Co
- 17.2.8.1. Overview
- 17.2.8.2. Products
- 17.2.8.3. SWOT Analysis
- 17.2.8.4. Recent Developments
- 17.2.8.5. Financials (Based on Availability)
- 17.2.9 Qatar Petroleum
- 17.2.9.1. Overview
- 17.2.9.2. Products
- 17.2.9.3. SWOT Analysis
- 17.2.9.4. Recent Developments
- 17.2.9.5. Financials (Based on Availability)
- 17.2.10 SK energy Co Ltd
- 17.2.10.1. Overview
- 17.2.10.2. Products
- 17.2.10.3. SWOT Analysis
- 17.2.10.4. Recent Developments
- 17.2.10.5. Financials (Based on Availability)
- 17.2.1 BP plc*List Not Exhaustive
List of Figures
- Figure 1: Global Diesel Industry Revenue Breakdown (Million, %) by Region 2024 & 2032
- Figure 2: Global Diesel Industry Volume Breakdown (Litre, %) by Region 2024 & 2032
- Figure 3: North America Diesel Industry Revenue (Million), by Country 2024 & 2032
- Figure 4: North America Diesel Industry Volume (Litre), by Country 2024 & 2032
- Figure 5: North America Diesel Industry Revenue Share (%), by Country 2024 & 2032
- Figure 6: North America Diesel Industry Volume Share (%), by Country 2024 & 2032
- Figure 7: Europe Diesel Industry Revenue (Million), by Country 2024 & 2032
- Figure 8: Europe Diesel Industry Volume (Litre), by Country 2024 & 2032
- Figure 9: Europe Diesel Industry Revenue Share (%), by Country 2024 & 2032
- Figure 10: Europe Diesel Industry Volume Share (%), by Country 2024 & 2032
- Figure 11: Asia Pacific Diesel Industry Revenue (Million), by Country 2024 & 2032
- Figure 12: Asia Pacific Diesel Industry Volume (Litre), by Country 2024 & 2032
- Figure 13: Asia Pacific Diesel Industry Revenue Share (%), by Country 2024 & 2032
- Figure 14: Asia Pacific Diesel Industry Volume Share (%), by Country 2024 & 2032
- Figure 15: South America Diesel Industry Revenue (Million), by Country 2024 & 2032
- Figure 16: South America Diesel Industry Volume (Litre), by Country 2024 & 2032
- Figure 17: South America Diesel Industry Revenue Share (%), by Country 2024 & 2032
- Figure 18: South America Diesel Industry Volume Share (%), by Country 2024 & 2032
- Figure 19: North America Diesel Industry Revenue (Million), by Country 2024 & 2032
- Figure 20: North America Diesel Industry Volume (Litre), by Country 2024 & 2032
- Figure 21: North America Diesel Industry Revenue Share (%), by Country 2024 & 2032
- Figure 22: North America Diesel Industry Volume Share (%), by Country 2024 & 2032
- Figure 23: MEA Diesel Industry Revenue (Million), by Country 2024 & 2032
- Figure 24: MEA Diesel Industry Volume (Litre), by Country 2024 & 2032
- Figure 25: MEA Diesel Industry Revenue Share (%), by Country 2024 & 2032
- Figure 26: MEA Diesel Industry Volume Share (%), by Country 2024 & 2032
- Figure 27: North America Diesel Industry Revenue (Million), by End-User 2024 & 2032
- Figure 28: North America Diesel Industry Volume (Litre), by End-User 2024 & 2032
- Figure 29: North America Diesel Industry Revenue Share (%), by End-User 2024 & 2032
- Figure 30: North America Diesel Industry Volume Share (%), by End-User 2024 & 2032
- Figure 31: North America Diesel Industry Revenue (Million), by Country 2024 & 2032
- Figure 32: North America Diesel Industry Volume (Litre), by Country 2024 & 2032
- Figure 33: North America Diesel Industry Revenue Share (%), by Country 2024 & 2032
- Figure 34: North America Diesel Industry Volume Share (%), by Country 2024 & 2032
- Figure 35: Europe Diesel Industry Revenue (Million), by End-User 2024 & 2032
- Figure 36: Europe Diesel Industry Volume (Litre), by End-User 2024 & 2032
- Figure 37: Europe Diesel Industry Revenue Share (%), by End-User 2024 & 2032
- Figure 38: Europe Diesel Industry Volume Share (%), by End-User 2024 & 2032
- Figure 39: Europe Diesel Industry Revenue (Million), by Country 2024 & 2032
- Figure 40: Europe Diesel Industry Volume (Litre), by Country 2024 & 2032
- Figure 41: Europe Diesel Industry Revenue Share (%), by Country 2024 & 2032
- Figure 42: Europe Diesel Industry Volume Share (%), by Country 2024 & 2032
- Figure 43: Asia Pacific Diesel Industry Revenue (Million), by End-User 2024 & 2032
- Figure 44: Asia Pacific Diesel Industry Volume (Litre), by End-User 2024 & 2032
- Figure 45: Asia Pacific Diesel Industry Revenue Share (%), by End-User 2024 & 2032
- Figure 46: Asia Pacific Diesel Industry Volume Share (%), by End-User 2024 & 2032
- Figure 47: Asia Pacific Diesel Industry Revenue (Million), by Country 2024 & 2032
- Figure 48: Asia Pacific Diesel Industry Volume (Litre), by Country 2024 & 2032
- Figure 49: Asia Pacific Diesel Industry Revenue Share (%), by Country 2024 & 2032
- Figure 50: Asia Pacific Diesel Industry Volume Share (%), by Country 2024 & 2032
- Figure 51: Middle East and Africa Diesel Industry Revenue (Million), by End-User 2024 & 2032
- Figure 52: Middle East and Africa Diesel Industry Volume (Litre), by End-User 2024 & 2032
- Figure 53: Middle East and Africa Diesel Industry Revenue Share (%), by End-User 2024 & 2032
- Figure 54: Middle East and Africa Diesel Industry Volume Share (%), by End-User 2024 & 2032
- Figure 55: Middle East and Africa Diesel Industry Revenue (Million), by Country 2024 & 2032
- Figure 56: Middle East and Africa Diesel Industry Volume (Litre), by Country 2024 & 2032
- Figure 57: Middle East and Africa Diesel Industry Revenue Share (%), by Country 2024 & 2032
- Figure 58: Middle East and Africa Diesel Industry Volume Share (%), by Country 2024 & 2032
- Figure 59: South America Diesel Industry Revenue (Million), by End-User 2024 & 2032
- Figure 60: South America Diesel Industry Volume (Litre), by End-User 2024 & 2032
- Figure 61: South America Diesel Industry Revenue Share (%), by End-User 2024 & 2032
- Figure 62: South America Diesel Industry Volume Share (%), by End-User 2024 & 2032
- Figure 63: South America Diesel Industry Revenue (Million), by Country 2024 & 2032
- Figure 64: South America Diesel Industry Volume (Litre), by Country 2024 & 2032
- Figure 65: South America Diesel Industry Revenue Share (%), by Country 2024 & 2032
- Figure 66: South America Diesel Industry Volume Share (%), by Country 2024 & 2032
List of Tables
- Table 1: Global Diesel Industry Revenue Million Forecast, by Region 2019 & 2032
- Table 2: Global Diesel Industry Volume Litre Forecast, by Region 2019 & 2032
- Table 3: Global Diesel Industry Revenue Million Forecast, by End-User 2019 & 2032
- Table 4: Global Diesel Industry Volume Litre Forecast, by End-User 2019 & 2032
- Table 5: Global Diesel Industry Revenue Million Forecast, by Region 2019 & 2032
- Table 6: Global Diesel Industry Volume Litre Forecast, by Region 2019 & 2032
- Table 7: Global Diesel Industry Revenue Million Forecast, by Country 2019 & 2032
- Table 8: Global Diesel Industry Volume Litre Forecast, by Country 2019 & 2032
- Table 9: United States Diesel Industry Revenue (Million) Forecast, by Application 2019 & 2032
- Table 10: United States Diesel Industry Volume (Litre) Forecast, by Application 2019 & 2032
- Table 11: Canada Diesel Industry Revenue (Million) Forecast, by Application 2019 & 2032
- Table 12: Canada Diesel Industry Volume (Litre) Forecast, by Application 2019 & 2032
- Table 13: Mexico Diesel Industry Revenue (Million) Forecast, by Application 2019 & 2032
- Table 14: Mexico Diesel Industry Volume (Litre) Forecast, by Application 2019 & 2032
- Table 15: Global Diesel Industry Revenue Million Forecast, by Country 2019 & 2032
- Table 16: Global Diesel Industry Volume Litre Forecast, by Country 2019 & 2032
- Table 17: Germany Diesel Industry Revenue (Million) Forecast, by Application 2019 & 2032
- Table 18: Germany Diesel Industry Volume (Litre) Forecast, by Application 2019 & 2032
- Table 19: United Kingdom Diesel Industry Revenue (Million) Forecast, by Application 2019 & 2032
- Table 20: United Kingdom Diesel Industry Volume (Litre) Forecast, by Application 2019 & 2032
- Table 21: France Diesel Industry Revenue (Million) Forecast, by Application 2019 & 2032
- Table 22: France Diesel Industry Volume (Litre) Forecast, by Application 2019 & 2032
- Table 23: Spain Diesel Industry Revenue (Million) Forecast, by Application 2019 & 2032
- Table 24: Spain Diesel Industry Volume (Litre) Forecast, by Application 2019 & 2032
- Table 25: Italy Diesel Industry Revenue (Million) Forecast, by Application 2019 & 2032
- Table 26: Italy Diesel Industry Volume (Litre) Forecast, by Application 2019 & 2032
- Table 27: Spain Diesel Industry Revenue (Million) Forecast, by Application 2019 & 2032
- Table 28: Spain Diesel Industry Volume (Litre) Forecast, by Application 2019 & 2032
- Table 29: Belgium Diesel Industry Revenue (Million) Forecast, by Application 2019 & 2032
- Table 30: Belgium Diesel Industry Volume (Litre) Forecast, by Application 2019 & 2032
- Table 31: Netherland Diesel Industry Revenue (Million) Forecast, by Application 2019 & 2032
- Table 32: Netherland Diesel Industry Volume (Litre) Forecast, by Application 2019 & 2032
- Table 33: Nordics Diesel Industry Revenue (Million) Forecast, by Application 2019 & 2032
- Table 34: Nordics Diesel Industry Volume (Litre) Forecast, by Application 2019 & 2032
- Table 35: Rest of Europe Diesel Industry Revenue (Million) Forecast, by Application 2019 & 2032
- Table 36: Rest of Europe Diesel Industry Volume (Litre) Forecast, by Application 2019 & 2032
- Table 37: Global Diesel Industry Revenue Million Forecast, by Country 2019 & 2032
- Table 38: Global Diesel Industry Volume Litre Forecast, by Country 2019 & 2032
- Table 39: China Diesel Industry Revenue (Million) Forecast, by Application 2019 & 2032
- Table 40: China Diesel Industry Volume (Litre) Forecast, by Application 2019 & 2032
- Table 41: Japan Diesel Industry Revenue (Million) Forecast, by Application 2019 & 2032
- Table 42: Japan Diesel Industry Volume (Litre) Forecast, by Application 2019 & 2032
- Table 43: India Diesel Industry Revenue (Million) Forecast, by Application 2019 & 2032
- Table 44: India Diesel Industry Volume (Litre) Forecast, by Application 2019 & 2032
- Table 45: South Korea Diesel Industry Revenue (Million) Forecast, by Application 2019 & 2032
- Table 46: South Korea Diesel Industry Volume (Litre) Forecast, by Application 2019 & 2032
- Table 47: Southeast Asia Diesel Industry Revenue (Million) Forecast, by Application 2019 & 2032
- Table 48: Southeast Asia Diesel Industry Volume (Litre) Forecast, by Application 2019 & 2032
- Table 49: Australia Diesel Industry Revenue (Million) Forecast, by Application 2019 & 2032
- Table 50: Australia Diesel Industry Volume (Litre) Forecast, by Application 2019 & 2032
- Table 51: Indonesia Diesel Industry Revenue (Million) Forecast, by Application 2019 & 2032
- Table 52: Indonesia Diesel Industry Volume (Litre) Forecast, by Application 2019 & 2032
- Table 53: Phillipes Diesel Industry Revenue (Million) Forecast, by Application 2019 & 2032
- Table 54: Phillipes Diesel Industry Volume (Litre) Forecast, by Application 2019 & 2032
- Table 55: Singapore Diesel Industry Revenue (Million) Forecast, by Application 2019 & 2032
- Table 56: Singapore Diesel Industry Volume (Litre) Forecast, by Application 2019 & 2032
- Table 57: Thailandc Diesel Industry Revenue (Million) Forecast, by Application 2019 & 2032
- Table 58: Thailandc Diesel Industry Volume (Litre) Forecast, by Application 2019 & 2032
- Table 59: Rest of Asia Pacific Diesel Industry Revenue (Million) Forecast, by Application 2019 & 2032
- Table 60: Rest of Asia Pacific Diesel Industry Volume (Litre) Forecast, by Application 2019 & 2032
- Table 61: Global Diesel Industry Revenue Million Forecast, by Country 2019 & 2032
- Table 62: Global Diesel Industry Volume Litre Forecast, by Country 2019 & 2032
- Table 63: Brazil Diesel Industry Revenue (Million) Forecast, by Application 2019 & 2032
- Table 64: Brazil Diesel Industry Volume (Litre) Forecast, by Application 2019 & 2032
- Table 65: Argentina Diesel Industry Revenue (Million) Forecast, by Application 2019 & 2032
- Table 66: Argentina Diesel Industry Volume (Litre) Forecast, by Application 2019 & 2032
- Table 67: Peru Diesel Industry Revenue (Million) Forecast, by Application 2019 & 2032
- Table 68: Peru Diesel Industry Volume (Litre) Forecast, by Application 2019 & 2032
- Table 69: Chile Diesel Industry Revenue (Million) Forecast, by Application 2019 & 2032
- Table 70: Chile Diesel Industry Volume (Litre) Forecast, by Application 2019 & 2032
- Table 71: Colombia Diesel Industry Revenue (Million) Forecast, by Application 2019 & 2032
- Table 72: Colombia Diesel Industry Volume (Litre) Forecast, by Application 2019 & 2032
- Table 73: Ecuador Diesel Industry Revenue (Million) Forecast, by Application 2019 & 2032
- Table 74: Ecuador Diesel Industry Volume (Litre) Forecast, by Application 2019 & 2032
- Table 75: Venezuela Diesel Industry Revenue (Million) Forecast, by Application 2019 & 2032
- Table 76: Venezuela Diesel Industry Volume (Litre) Forecast, by Application 2019 & 2032
- Table 77: Rest of South America Diesel Industry Revenue (Million) Forecast, by Application 2019 & 2032
- Table 78: Rest of South America Diesel Industry Volume (Litre) Forecast, by Application 2019 & 2032
- Table 79: Global Diesel Industry Revenue Million Forecast, by Country 2019 & 2032
- Table 80: Global Diesel Industry Volume Litre Forecast, by Country 2019 & 2032
- Table 81: United States Diesel Industry Revenue (Million) Forecast, by Application 2019 & 2032
- Table 82: United States Diesel Industry Volume (Litre) Forecast, by Application 2019 & 2032
- Table 83: Canada Diesel Industry Revenue (Million) Forecast, by Application 2019 & 2032
- Table 84: Canada Diesel Industry Volume (Litre) Forecast, by Application 2019 & 2032
- Table 85: Mexico Diesel Industry Revenue (Million) Forecast, by Application 2019 & 2032
- Table 86: Mexico Diesel Industry Volume (Litre) Forecast, by Application 2019 & 2032
- Table 87: Global Diesel Industry Revenue Million Forecast, by Country 2019 & 2032
- Table 88: Global Diesel Industry Volume Litre Forecast, by Country 2019 & 2032
- Table 89: United Arab Emirates Diesel Industry Revenue (Million) Forecast, by Application 2019 & 2032
- Table 90: United Arab Emirates Diesel Industry Volume (Litre) Forecast, by Application 2019 & 2032
- Table 91: Saudi Arabia Diesel Industry Revenue (Million) Forecast, by Application 2019 & 2032
- Table 92: Saudi Arabia Diesel Industry Volume (Litre) Forecast, by Application 2019 & 2032
- Table 93: South Africa Diesel Industry Revenue (Million) Forecast, by Application 2019 & 2032
- Table 94: South Africa Diesel Industry Volume (Litre) Forecast, by Application 2019 & 2032
- Table 95: Rest of Middle East and Africa Diesel Industry Revenue (Million) Forecast, by Application 2019 & 2032
- Table 96: Rest of Middle East and Africa Diesel Industry Volume (Litre) Forecast, by Application 2019 & 2032
- Table 97: Global Diesel Industry Revenue Million Forecast, by End-User 2019 & 2032
- Table 98: Global Diesel Industry Volume Litre Forecast, by End-User 2019 & 2032
- Table 99: Global Diesel Industry Revenue Million Forecast, by Country 2019 & 2032
- Table 100: Global Diesel Industry Volume Litre Forecast, by Country 2019 & 2032
- Table 101: United States Diesel Industry Revenue (Million) Forecast, by Application 2019 & 2032
- Table 102: United States Diesel Industry Volume (Litre) Forecast, by Application 2019 & 2032
- Table 103: Canada Diesel Industry Revenue (Million) Forecast, by Application 2019 & 2032
- Table 104: Canada Diesel Industry Volume (Litre) Forecast, by Application 2019 & 2032
- Table 105: Rest of North America Diesel Industry Revenue (Million) Forecast, by Application 2019 & 2032
- Table 106: Rest of North America Diesel Industry Volume (Litre) Forecast, by Application 2019 & 2032
- Table 107: Global Diesel Industry Revenue Million Forecast, by End-User 2019 & 2032
- Table 108: Global Diesel Industry Volume Litre Forecast, by End-User 2019 & 2032
- Table 109: Global Diesel Industry Revenue Million Forecast, by Country 2019 & 2032
- Table 110: Global Diesel Industry Volume Litre Forecast, by Country 2019 & 2032
- Table 111: United Kingdom Diesel Industry Revenue (Million) Forecast, by Application 2019 & 2032
- Table 112: United Kingdom Diesel Industry Volume (Litre) Forecast, by Application 2019 & 2032
- Table 113: Russia Diesel Industry Revenue (Million) Forecast, by Application 2019 & 2032
- Table 114: Russia Diesel Industry Volume (Litre) Forecast, by Application 2019 & 2032
- Table 115: Germany Diesel Industry Revenue (Million) Forecast, by Application 2019 & 2032
- Table 116: Germany Diesel Industry Volume (Litre) Forecast, by Application 2019 & 2032
- Table 117: Norway Diesel Industry Revenue (Million) Forecast, by Application 2019 & 2032
- Table 118: Norway Diesel Industry Volume (Litre) Forecast, by Application 2019 & 2032
- Table 119: Rest of Europe Diesel Industry Revenue (Million) Forecast, by Application 2019 & 2032
- Table 120: Rest of Europe Diesel Industry Volume (Litre) Forecast, by Application 2019 & 2032
- Table 121: Global Diesel Industry Revenue Million Forecast, by End-User 2019 & 2032
- Table 122: Global Diesel Industry Volume Litre Forecast, by End-User 2019 & 2032
- Table 123: Global Diesel Industry Revenue Million Forecast, by Country 2019 & 2032
- Table 124: Global Diesel Industry Volume Litre Forecast, by Country 2019 & 2032
- Table 125: China Diesel Industry Revenue (Million) Forecast, by Application 2019 & 2032
- Table 126: China Diesel Industry Volume (Litre) Forecast, by Application 2019 & 2032
- Table 127: India Diesel Industry Revenue (Million) Forecast, by Application 2019 & 2032
- Table 128: India Diesel Industry Volume (Litre) Forecast, by Application 2019 & 2032
- Table 129: Indonesia Diesel Industry Revenue (Million) Forecast, by Application 2019 & 2032
- Table 130: Indonesia Diesel Industry Volume (Litre) Forecast, by Application 2019 & 2032
- Table 131: Malaysia Diesel Industry Revenue (Million) Forecast, by Application 2019 & 2032
- Table 132: Malaysia Diesel Industry Volume (Litre) Forecast, by Application 2019 & 2032
- Table 133: Vietnam Diesel Industry Revenue (Million) Forecast, by Application 2019 & 2032
- Table 134: Vietnam Diesel Industry Volume (Litre) Forecast, by Application 2019 & 2032
- Table 135: Global Diesel Industry Revenue Million Forecast, by End-User 2019 & 2032
- Table 136: Global Diesel Industry Volume Litre Forecast, by End-User 2019 & 2032
- Table 137: Global Diesel Industry Revenue Million Forecast, by Country 2019 & 2032
- Table 138: Global Diesel Industry Volume Litre Forecast, by Country 2019 & 2032
- Table 139: Saudi Arabia Diesel Industry Revenue (Million) Forecast, by Application 2019 & 2032
- Table 140: Saudi Arabia Diesel Industry Volume (Litre) Forecast, by Application 2019 & 2032
- Table 141: United Arab Emirates Diesel Industry Revenue (Million) Forecast, by Application 2019 & 2032
- Table 142: United Arab Emirates Diesel Industry Volume (Litre) Forecast, by Application 2019 & 2032
- Table 143: South Africa Diesel Industry Revenue (Million) Forecast, by Application 2019 & 2032
- Table 144: South Africa Diesel Industry Volume (Litre) Forecast, by Application 2019 & 2032
- Table 145: Nigeria Diesel Industry Revenue (Million) Forecast, by Application 2019 & 2032
- Table 146: Nigeria Diesel Industry Volume (Litre) Forecast, by Application 2019 & 2032
- Table 147: Egypt Diesel Industry Revenue (Million) Forecast, by Application 2019 & 2032
- Table 148: Egypt Diesel Industry Volume (Litre) Forecast, by Application 2019 & 2032
- Table 149: Rest of Middle East and Africa Diesel Industry Revenue (Million) Forecast, by Application 2019 & 2032
- Table 150: Rest of Middle East and Africa Diesel Industry Volume (Litre) Forecast, by Application 2019 & 2032
- Table 151: Global Diesel Industry Revenue Million Forecast, by End-User 2019 & 2032
- Table 152: Global Diesel Industry Volume Litre Forecast, by End-User 2019 & 2032
- Table 153: Global Diesel Industry Revenue Million Forecast, by Country 2019 & 2032
- Table 154: Global Diesel Industry Volume Litre Forecast, by Country 2019 & 2032
- Table 155: Argentina Diesel Industry Revenue (Million) Forecast, by Application 2019 & 2032
- Table 156: Argentina Diesel Industry Volume (Litre) Forecast, by Application 2019 & 2032
- Table 157: Brazil Diesel Industry Revenue (Million) Forecast, by Application 2019 & 2032
- Table 158: Brazil Diesel Industry Volume (Litre) Forecast, by Application 2019 & 2032
- Table 159: Venezuela Diesel Industry Revenue (Million) Forecast, by Application 2019 & 2032
- Table 160: Venezuela Diesel Industry Volume (Litre) Forecast, by Application 2019 & 2032
- Table 161: Rest of South America Diesel Industry Revenue (Million) Forecast, by Application 2019 & 2032
- Table 162: Rest of South America Diesel Industry Volume (Litre) Forecast, by Application 2019 & 2032
Frequently Asked Questions
1. What is the projected Compound Annual Growth Rate (CAGR) of the Diesel Industry?
The projected CAGR is approximately 3.50%.
2. Which companies are prominent players in the Diesel Industry?
Key companies in the market include BP plc*List Not Exhaustive, Reliance Industries Ltd, Exxon Mobil Corporation, Shell Plc, PetroChina Company Limited, NK Rosneft' PAO, Chevron Corporation, Saudi Arabian Oil Co, Qatar Petroleum, SK energy Co Ltd.
3. What are the main segments of the Diesel Industry?
The market segments include End-User.
4. Can you provide details about the market size?
The market size is estimated to be USD 244.26 Million as of 2022.
5. What are some drivers contributing to market growth?
Increasing Demand from Industrial Applications4.; Growing Infrastructure Across the World.
6. What are the notable trends driving market growth?
Transportation Segment is to Expected to Dominate in the Market.
7. Are there any restraints impacting market growth?
A Rise in Concerns Related to Carbon Emissions and A Shift Towards Electric Vehicles and Renewable Sources of Energy.
8. Can you provide examples of recent developments in the market?
May 2023: Petrobras, the state oil company of Brazil, gave the green light to a revised fuel pricing policy that will result in significant cost reductions for drivers. As per the newly approved strategy, gasoline, and diesel prices will experience a considerable decline, with a nearly 13% reduction.
9. What pricing options are available for accessing the report?
Pricing options include single-user, multi-user, and enterprise licenses priced at USD 4750, USD 5250, and USD 8750 respectively.
10. Is the market size provided in terms of value or volume?
The market size is provided in terms of value, measured in Million and volume, measured in Litre.
11. Are there any specific market keywords associated with the report?
Yes, the market keyword associated with the report is "Diesel Industry," which aids in identifying and referencing the specific market segment covered.
12. How do I determine which pricing option suits my needs best?
The pricing options vary based on user requirements and access needs. Individual users may opt for single-user licenses, while businesses requiring broader access may choose multi-user or enterprise licenses for cost-effective access to the report.
13. Are there any additional resources or data provided in the Diesel Industry report?
While the report offers comprehensive insights, it's advisable to review the specific contents or supplementary materials provided to ascertain if additional resources or data are available.
14. How can I stay updated on further developments or reports in the Diesel Industry?
To stay informed about further developments, trends, and reports in the Diesel Industry, consider subscribing to industry newsletters, following relevant companies and organizations, or regularly checking reputable industry news sources and publications.
Methodology
Step 1 - Identification of Relevant Samples Size from Population Database


Step 2 - Approaches for Defining Global Market Size (Value, Volume* & Price*)

Note*: In applicable scenarios
Step 3 - Data Sources
Primary Research
- Web Analytics
- Survey Reports
- Research Institute
- Latest Research Reports
- Opinion Leaders
Secondary Research
- Annual Reports
- White Paper
- Latest Press Release
- Industry Association
- Paid Database
- Investor Presentations

Step 4 - Data Triangulation
Involves using different sources of information in order to increase the validity of a study
These sources are likely to be stakeholders in a program - participants, other researchers, program staff, other community members, and so on.
Then we put all data in single framework & apply various statistical tools to find out the dynamic on the market.
During the analysis stage, feedback from the stakeholder groups would be compared to determine areas of agreement as well as areas of divergence


