
Key Insights
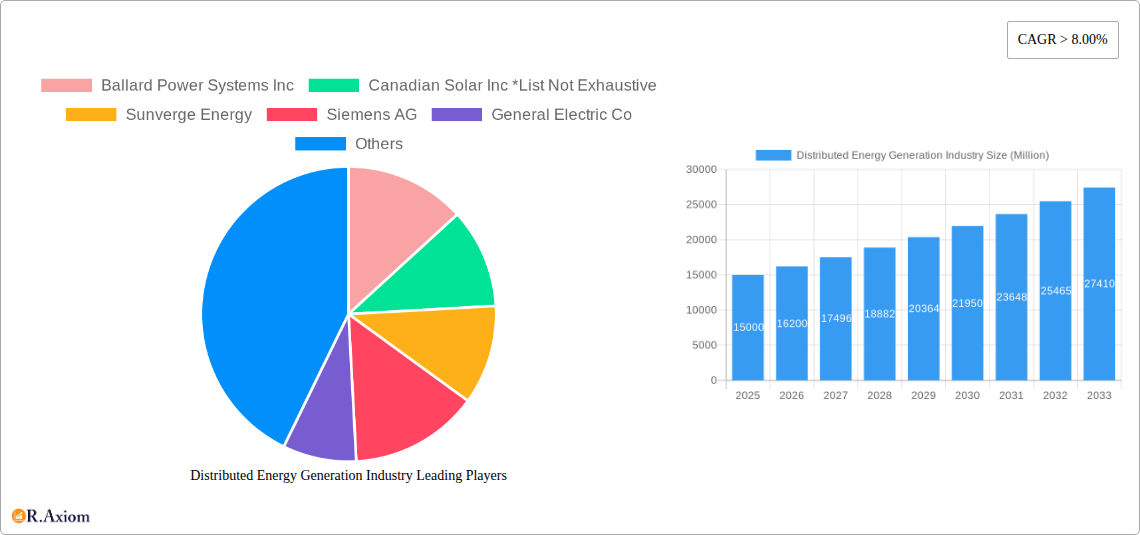
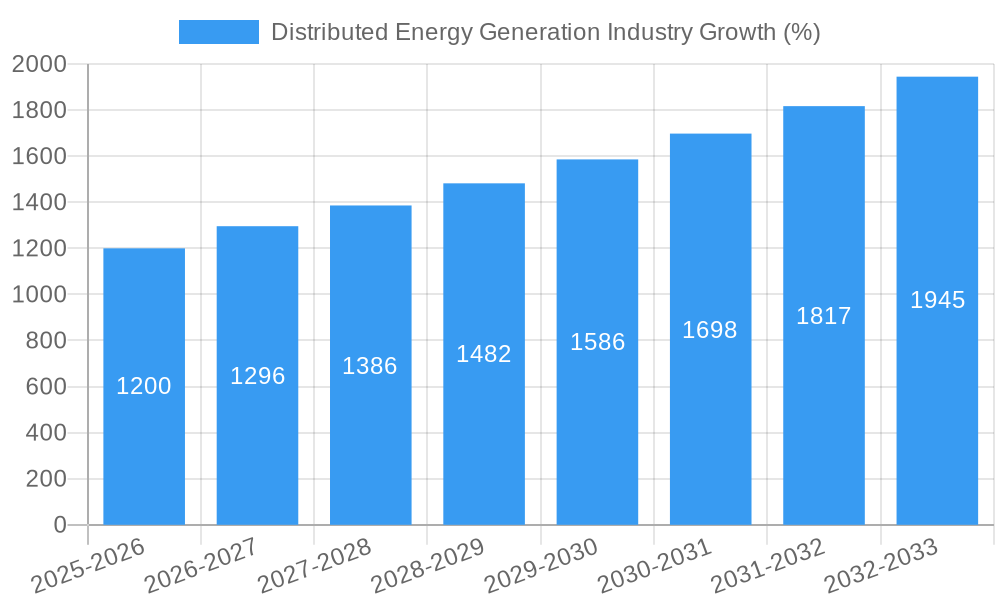
The Distributed Energy Generation (DEG) industry is experiencing robust growth, projected to maintain a Compound Annual Growth Rate (CAGR) exceeding 8% from 2025 to 2033. This expansion is driven by several key factors. Increasing concerns about climate change and the need for sustainable energy solutions are fueling demand for renewable energy technologies like solar PV and microgrids. Furthermore, the rising costs of traditional grid electricity, particularly in remote areas or those with unreliable infrastructure, are making DEG solutions increasingly economically attractive. Government incentives and policies promoting renewable energy adoption, coupled with advancements in battery storage technology enhancing grid stability and reliability, also contribute significantly to market growth. Technological innovation continues to improve efficiency and reduce the cost of DEG technologies, further boosting market penetration. While regulatory hurdles and high upfront capital costs can present challenges, the long-term economic and environmental benefits of DEG are compelling, leading to a positive outlook for the market.
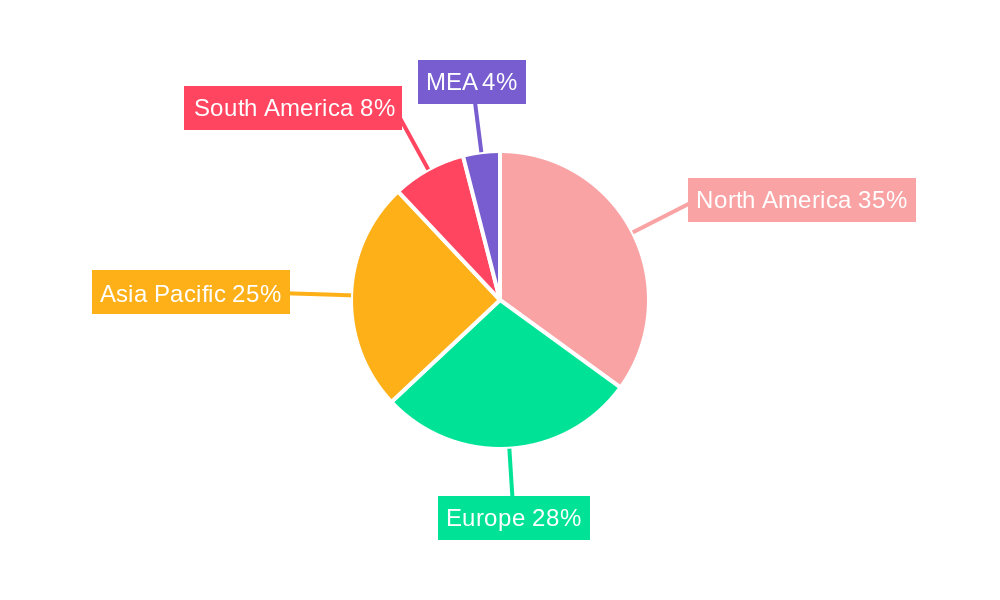
Significant regional variations exist within the DEG market. North America and Europe are currently leading in adoption, benefiting from established renewable energy policies and robust technological infrastructure. However, the Asia-Pacific region is poised for substantial growth, driven by rapid economic development, increasing energy demands, and government initiatives to diversify energy sources. The market is segmented by technology, with solar PV, diesel gensets, and natural gas gensets currently holding significant market share. However, the microgrid segment is expected to experience accelerated growth due to its potential for improved grid resilience and integration of renewable energy sources. Companies like Ballard Power Systems, Canadian Solar, and Siemens are key players, constantly innovating and competing to capture market share in this dynamic landscape. The forecast for the next decade is optimistic, projecting substantial expansion across diverse geographic locations and technological segments within the DEG industry.
Distributed Energy Generation Industry: A Comprehensive Market Report (2019-2033)
This comprehensive report provides an in-depth analysis of the Distributed Energy Generation (DEG) industry, offering valuable insights for stakeholders seeking to understand market dynamics, growth opportunities, and competitive landscapes. The study period covers 2019-2033, with 2025 as the base and estimated year. The report incorporates data from the historical period (2019-2024) and forecasts the market from 2025-2033. Market values are expressed in Millions.
Distributed Energy Generation Industry Market Concentration & Innovation
This section analyzes the level of market concentration within the DEG industry, identifying key players and assessing their market share. The analysis also explores innovation drivers, regulatory frameworks impacting market growth, the presence of substitute products, end-user trends, and merger & acquisition (M&A) activities. The report will quantify market share for major players and analyze the value of significant M&A deals during the study period. While precise figures are unavailable for all aspects at this stage, the report will include estimates where possible. For example, we estimate the total M&A deal value in the DEG industry between 2019 and 2024 to be approximately $XX Million. This section will also examine the impact of regulatory changes, such as evolving grid interconnection standards and renewable energy mandates, on market concentration and innovation. The influence of technological advancements, like advancements in battery storage and power electronics, on product differentiation and the competitive landscape will be analyzed. Finally, end-user trends, such as the increasing adoption of renewable energy solutions by residential and commercial consumers, will be assessed.
- Market Share Analysis: [Detailed market share breakdown of key players, including Ballard Power Systems Inc., Canadian Solar Inc., Sunverge Energy, Siemens AG, and others, will be provided.]
- M&A Activity: [Analysis of significant mergers and acquisitions, including deal values and their impact on market structure.]
- Innovation Drivers: [Discussion of factors driving innovation, such as government incentives, technological advancements, and customer demand.]
- Regulatory Framework: [Analysis of the regulatory landscape and its influence on market access and growth.]
- Product Substitutes: [Examination of existing and potential substitutes for DEG technologies.]
- End-User Trends: [Analysis of how changing consumer preferences are influencing the market.]
Distributed Energy Generation Industry Industry Trends & Insights
This section delves into the key trends shaping the DEG industry. We will explore market growth drivers (such as increasing energy costs and environmental concerns), technological disruptions (e.g., advancements in solar PV technology and battery storage), evolving consumer preferences (e.g., rising demand for renewable energy and energy independence), and the competitive dynamics among industry participants. This analysis will provide a comprehensive understanding of the CAGR and market penetration rates of various DEG technologies over the forecast period. The report projects a CAGR of XX% for the DEG market from 2025 to 2033, driven by factors such as increasing urbanization and the rising adoption of renewable energy sources. The market penetration rate of solar PV is projected to reach XX% by 2033.
Dominant Markets & Segments in Distributed Energy Generation Industry
This section identifies the leading regions, countries, and technology segments within the DEG industry. We will analyze market dominance through a detailed assessment of key drivers, including economic policies, infrastructure development, and regulatory frameworks.
- Solar PV: Key drivers include government incentives, decreasing technology costs, and increasing environmental awareness.
- Diesel Gensets: Key drivers include their reliability in remote areas and applications needing immediate power.
- Natural Gas Gensets: Key drivers include relative cost-effectiveness and readily available infrastructure in some regions.
- Microgrids: Key drivers include resilience to grid outages and ability to integrate renewable energy sources.
- Other Technologies: (e.g., fuel cells, wind turbines) – Key drivers vary by technology, and will be explored in detail.
[Detailed analysis of the dominant regions and countries for each segment, including specific examples and data, will be provided.]
Distributed Energy Generation Industry Product Developments
This section summarizes recent product innovations, highlighting technological trends and market fit. The focus will be on advancements enhancing efficiency, reliability, and cost-effectiveness, leading to broader market adoption of DEG technologies. Examples include new solar panel designs with higher efficiency ratings, improved battery storage solutions with longer lifespans, and smart grid integration features for microgrids.
Report Scope & Segmentation Analysis
This report segments the DEG market based on technology: Solar PV, Diesel Gensets, Natural Gas Gensets, Microgrids, and Other Technologies. Each segment will be analyzed to understand its growth projections, market size, and competitive landscape. The report will provide detailed market size estimations for each segment for both the base year (2025) and the forecast period (2025-2033).
- Solar PV: [Growth projections, market size estimations, and competitive analysis.]
- Diesel Gensets: [Growth projections, market size estimations, and competitive analysis.]
- Natural Gas Gensets: [Growth projections, market size estimations, and competitive analysis.]
- Microgrids: [Growth projections, market size estimations, and competitive analysis.]
- Other Technologies: [Growth projections, market size estimations, and competitive analysis.]
Key Drivers of Distributed Energy Generation Industry Growth
The growth of the DEG industry is propelled by several key factors. These include increasing demand for reliable and sustainable energy sources, government policies promoting renewable energy adoption (e.g., tax incentives and renewable portfolio standards), advancements in technology leading to cost reductions and improved efficiency, and growing concerns about climate change and energy security. The decreasing cost of solar PV and battery storage technologies is a major driver of growth in the solar PV segment.
Challenges in the Distributed Energy Generation Industry Sector
Several challenges hinder the growth of the DEG industry. These include regulatory hurdles in obtaining permits and grid connections, supply chain disruptions impacting the availability of key components, and intense competition among different DEG technologies. The intermittent nature of some renewable energy sources (e.g., solar and wind) poses challenges for grid stability and reliability. The high upfront capital costs associated with some DEG technologies can also limit adoption. [Quantifiable data will be provided wherever possible.]
Emerging Opportunities in Distributed Energy Generation Industry
The DEG industry presents several promising opportunities. The growing adoption of smart grid technologies facilitates better integration of DEG systems, while the development of energy storage solutions addresses the intermittency challenges of renewable energy sources. New markets are emerging in developing countries with limited access to centralized power grids, representing significant growth potential.
Leading Players in the Distributed Energy Generation Industry Market
- Ballard Power Systems Inc
- Canadian Solar Inc
- Sunverge Energy
- Siemens AG
- General Electric Co
- Schneider Electric SE
- Caterpillar Inc
- Fuelcell Energy Inc
- Cummins Inc
- Ansaldo Energia SpA
- Capstone Turbine Corporation
- Bloom Energy
Key Developments in Distributed Energy Generation Industry Industry
- December 2022: Phase 2 of the grid-connected rooftop solar scheme commenced in Bangalore, India, with a target of 10 MW capacity installation, boosting distributed solar generation.
- November 2022: Michigan's distributed generation program experienced a 37% increase, adding 3,709 customers and 14,446 installations, primarily solar, showcasing the growing adoption of distributed generation.
Strategic Outlook for Distributed Energy Generation Industry Market
The DEG industry is poised for significant growth driven by the increasing demand for renewable energy, advancements in technology, and supportive government policies. The integration of smart grid technologies and energy storage solutions will further enhance the efficiency and reliability of DEG systems. Emerging markets in developing economies present significant growth opportunities. The forecast period (2025-2033) is expected to witness considerable market expansion, driven by these factors.
Distributed Energy Generation Industry Segmentation
-
1. Technology
- 1.1. Solar PV
- 1.2. Diesel Gensets
- 1.3. Natural Gas Gensets
- 1.4. Microgrids
- 1.5. Other Technologies
Distributed Energy Generation Industry Segmentation By Geography
- 1. North America
- 2. Europe
- 3. Asia Pacific
- 4. South America
- 5. Middle East and Africa
Distributed Energy Generation Industry REPORT HIGHLIGHTS
| Aspects | Details |
|---|---|
| Study Period | 2019-2033 |
| Base Year | 2024 |
| Estimated Year | 2025 |
| Forecast Period | 2025-2033 |
| Historical Period | 2019-2024 |
| Growth Rate | CAGR of > 8.00% from 2019-2033 |
| Segmentation |
|
Table of Contents
- 1. Introduction
- 1.1. Research Scope
- 1.2. Market Segmentation
- 1.3. Research Methodology
- 1.4. Definitions and Assumptions
- 2. Executive Summary
- 2.1. Introduction
- 3. Market Dynamics
- 3.1. Introduction
- 3.2. Market Drivers
- 3.2.1. 4.; Global Energy Transition Toward Renewables4.; The Rollout of New Technologies in Many Developed Countries
- 3.3. Market Restrains
- 3.3.1. 4.; The Technology's Exorbitant Costs and Environmental Impacts
- 3.4. Market Trends
- 3.4.1. Solar PV to Dominate the Market
- 4. Market Factor Analysis
- 4.1. Porters Five Forces
- 4.2. Supply/Value Chain
- 4.3. PESTEL analysis
- 4.4. Market Entropy
- 4.5. Patent/Trademark Analysis
- 5. Global Distributed Energy Generation Industry Analysis, Insights and Forecast, 2019-2031
- 5.1. Market Analysis, Insights and Forecast - by Technology
- 5.1.1. Solar PV
- 5.1.2. Diesel Gensets
- 5.1.3. Natural Gas Gensets
- 5.1.4. Microgrids
- 5.1.5. Other Technologies
- 5.2. Market Analysis, Insights and Forecast - by Region
- 5.2.1. North America
- 5.2.2. Europe
- 5.2.3. Asia Pacific
- 5.2.4. South America
- 5.2.5. Middle East and Africa
- 5.1. Market Analysis, Insights and Forecast - by Technology
- 6. North America Distributed Energy Generation Industry Analysis, Insights and Forecast, 2019-2031
- 6.1. Market Analysis, Insights and Forecast - by Technology
- 6.1.1. Solar PV
- 6.1.2. Diesel Gensets
- 6.1.3. Natural Gas Gensets
- 6.1.4. Microgrids
- 6.1.5. Other Technologies
- 6.1. Market Analysis, Insights and Forecast - by Technology
- 7. Europe Distributed Energy Generation Industry Analysis, Insights and Forecast, 2019-2031
- 7.1. Market Analysis, Insights and Forecast - by Technology
- 7.1.1. Solar PV
- 7.1.2. Diesel Gensets
- 7.1.3. Natural Gas Gensets
- 7.1.4. Microgrids
- 7.1.5. Other Technologies
- 7.1. Market Analysis, Insights and Forecast - by Technology
- 8. Asia Pacific Distributed Energy Generation Industry Analysis, Insights and Forecast, 2019-2031
- 8.1. Market Analysis, Insights and Forecast - by Technology
- 8.1.1. Solar PV
- 8.1.2. Diesel Gensets
- 8.1.3. Natural Gas Gensets
- 8.1.4. Microgrids
- 8.1.5. Other Technologies
- 8.1. Market Analysis, Insights and Forecast - by Technology
- 9. South America Distributed Energy Generation Industry Analysis, Insights and Forecast, 2019-2031
- 9.1. Market Analysis, Insights and Forecast - by Technology
- 9.1.1. Solar PV
- 9.1.2. Diesel Gensets
- 9.1.3. Natural Gas Gensets
- 9.1.4. Microgrids
- 9.1.5. Other Technologies
- 9.1. Market Analysis, Insights and Forecast - by Technology
- 10. Middle East and Africa Distributed Energy Generation Industry Analysis, Insights and Forecast, 2019-2031
- 10.1. Market Analysis, Insights and Forecast - by Technology
- 10.1.1. Solar PV
- 10.1.2. Diesel Gensets
- 10.1.3. Natural Gas Gensets
- 10.1.4. Microgrids
- 10.1.5. Other Technologies
- 10.1. Market Analysis, Insights and Forecast - by Technology
- 11. North America Distributed Energy Generation Industry Analysis, Insights and Forecast, 2019-2031
- 11.1. Market Analysis, Insights and Forecast - By Country/Sub-region
- 11.1.1 United States
- 11.1.2 Canada
- 11.1.3 Mexico
- 12. Europe Distributed Energy Generation Industry Analysis, Insights and Forecast, 2019-2031
- 12.1. Market Analysis, Insights and Forecast - By Country/Sub-region
- 12.1.1 Germany
- 12.1.2 United Kingdom
- 12.1.3 France
- 12.1.4 Spain
- 12.1.5 Italy
- 12.1.6 Spain
- 12.1.7 Belgium
- 12.1.8 Netherland
- 12.1.9 Nordics
- 12.1.10 Rest of Europe
- 13. Asia Pacific Distributed Energy Generation Industry Analysis, Insights and Forecast, 2019-2031
- 13.1. Market Analysis, Insights and Forecast - By Country/Sub-region
- 13.1.1 China
- 13.1.2 Japan
- 13.1.3 India
- 13.1.4 South Korea
- 13.1.5 Southeast Asia
- 13.1.6 Australia
- 13.1.7 Indonesia
- 13.1.8 Phillipes
- 13.1.9 Singapore
- 13.1.10 Thailandc
- 13.1.11 Rest of Asia Pacific
- 14. South America Distributed Energy Generation Industry Analysis, Insights and Forecast, 2019-2031
- 14.1. Market Analysis, Insights and Forecast - By Country/Sub-region
- 14.1.1 Brazil
- 14.1.2 Argentina
- 14.1.3 Peru
- 14.1.4 Chile
- 14.1.5 Colombia
- 14.1.6 Ecuador
- 14.1.7 Venezuela
- 14.1.8 Rest of South America
- 15. North America Distributed Energy Generation Industry Analysis, Insights and Forecast, 2019-2031
- 15.1. Market Analysis, Insights and Forecast - By Country/Sub-region
- 15.1.1 United States
- 15.1.2 Canada
- 15.1.3 Mexico
- 16. MEA Distributed Energy Generation Industry Analysis, Insights and Forecast, 2019-2031
- 16.1. Market Analysis, Insights and Forecast - By Country/Sub-region
- 16.1.1 United Arab Emirates
- 16.1.2 Saudi Arabia
- 16.1.3 South Africa
- 16.1.4 Rest of Middle East and Africa
- 17. Competitive Analysis
- 17.1. Global Market Share Analysis 2024
- 17.2. Company Profiles
- 17.2.1 Ballard Power Systems Inc
- 17.2.1.1. Overview
- 17.2.1.2. Products
- 17.2.1.3. SWOT Analysis
- 17.2.1.4. Recent Developments
- 17.2.1.5. Financials (Based on Availability)
- 17.2.2 Canadian Solar Inc *List Not Exhaustive
- 17.2.2.1. Overview
- 17.2.2.2. Products
- 17.2.2.3. SWOT Analysis
- 17.2.2.4. Recent Developments
- 17.2.2.5. Financials (Based on Availability)
- 17.2.3 Sunverge Energy
- 17.2.3.1. Overview
- 17.2.3.2. Products
- 17.2.3.3. SWOT Analysis
- 17.2.3.4. Recent Developments
- 17.2.3.5. Financials (Based on Availability)
- 17.2.4 Siemens AG
- 17.2.4.1. Overview
- 17.2.4.2. Products
- 17.2.4.3. SWOT Analysis
- 17.2.4.4. Recent Developments
- 17.2.4.5. Financials (Based on Availability)
- 17.2.5 General Electric Co
- 17.2.5.1. Overview
- 17.2.5.2. Products
- 17.2.5.3. SWOT Analysis
- 17.2.5.4. Recent Developments
- 17.2.5.5. Financials (Based on Availability)
- 17.2.6 Schneider Electric SE
- 17.2.6.1. Overview
- 17.2.6.2. Products
- 17.2.6.3. SWOT Analysis
- 17.2.6.4. Recent Developments
- 17.2.6.5. Financials (Based on Availability)
- 17.2.7 Caterpillar Inc
- 17.2.7.1. Overview
- 17.2.7.2. Products
- 17.2.7.3. SWOT Analysis
- 17.2.7.4. Recent Developments
- 17.2.7.5. Financials (Based on Availability)
- 17.2.8 Fuelcell Energy Inc
- 17.2.8.1. Overview
- 17.2.8.2. Products
- 17.2.8.3. SWOT Analysis
- 17.2.8.4. Recent Developments
- 17.2.8.5. Financials (Based on Availability)
- 17.2.9 Cummins Inc
- 17.2.9.1. Overview
- 17.2.9.2. Products
- 17.2.9.3. SWOT Analysis
- 17.2.9.4. Recent Developments
- 17.2.9.5. Financials (Based on Availability)
- 17.2.10 Ansaldo Energia SpA
- 17.2.10.1. Overview
- 17.2.10.2. Products
- 17.2.10.3. SWOT Analysis
- 17.2.10.4. Recent Developments
- 17.2.10.5. Financials (Based on Availability)
- 17.2.11 Capstone Turbine Corporation
- 17.2.11.1. Overview
- 17.2.11.2. Products
- 17.2.11.3. SWOT Analysis
- 17.2.11.4. Recent Developments
- 17.2.11.5. Financials (Based on Availability)
- 17.2.12 Bloom Energy
- 17.2.12.1. Overview
- 17.2.12.2. Products
- 17.2.12.3. SWOT Analysis
- 17.2.12.4. Recent Developments
- 17.2.12.5. Financials (Based on Availability)
- 17.2.1 Ballard Power Systems Inc
List of Figures
- Figure 1: Global Distributed Energy Generation Industry Revenue Breakdown (Million, %) by Region 2024 & 2032
- Figure 2: North America Distributed Energy Generation Industry Revenue (Million), by Country 2024 & 2032
- Figure 3: North America Distributed Energy Generation Industry Revenue Share (%), by Country 2024 & 2032
- Figure 4: Europe Distributed Energy Generation Industry Revenue (Million), by Country 2024 & 2032
- Figure 5: Europe Distributed Energy Generation Industry Revenue Share (%), by Country 2024 & 2032
- Figure 6: Asia Pacific Distributed Energy Generation Industry Revenue (Million), by Country 2024 & 2032
- Figure 7: Asia Pacific Distributed Energy Generation Industry Revenue Share (%), by Country 2024 & 2032
- Figure 8: South America Distributed Energy Generation Industry Revenue (Million), by Country 2024 & 2032
- Figure 9: South America Distributed Energy Generation Industry Revenue Share (%), by Country 2024 & 2032
- Figure 10: North America Distributed Energy Generation Industry Revenue (Million), by Country 2024 & 2032
- Figure 11: North America Distributed Energy Generation Industry Revenue Share (%), by Country 2024 & 2032
- Figure 12: MEA Distributed Energy Generation Industry Revenue (Million), by Country 2024 & 2032
- Figure 13: MEA Distributed Energy Generation Industry Revenue Share (%), by Country 2024 & 2032
- Figure 14: North America Distributed Energy Generation Industry Revenue (Million), by Technology 2024 & 2032
- Figure 15: North America Distributed Energy Generation Industry Revenue Share (%), by Technology 2024 & 2032
- Figure 16: North America Distributed Energy Generation Industry Revenue (Million), by Country 2024 & 2032
- Figure 17: North America Distributed Energy Generation Industry Revenue Share (%), by Country 2024 & 2032
- Figure 18: Europe Distributed Energy Generation Industry Revenue (Million), by Technology 2024 & 2032
- Figure 19: Europe Distributed Energy Generation Industry Revenue Share (%), by Technology 2024 & 2032
- Figure 20: Europe Distributed Energy Generation Industry Revenue (Million), by Country 2024 & 2032
- Figure 21: Europe Distributed Energy Generation Industry Revenue Share (%), by Country 2024 & 2032
- Figure 22: Asia Pacific Distributed Energy Generation Industry Revenue (Million), by Technology 2024 & 2032
- Figure 23: Asia Pacific Distributed Energy Generation Industry Revenue Share (%), by Technology 2024 & 2032
- Figure 24: Asia Pacific Distributed Energy Generation Industry Revenue (Million), by Country 2024 & 2032
- Figure 25: Asia Pacific Distributed Energy Generation Industry Revenue Share (%), by Country 2024 & 2032
- Figure 26: South America Distributed Energy Generation Industry Revenue (Million), by Technology 2024 & 2032
- Figure 27: South America Distributed Energy Generation Industry Revenue Share (%), by Technology 2024 & 2032
- Figure 28: South America Distributed Energy Generation Industry Revenue (Million), by Country 2024 & 2032
- Figure 29: South America Distributed Energy Generation Industry Revenue Share (%), by Country 2024 & 2032
- Figure 30: Middle East and Africa Distributed Energy Generation Industry Revenue (Million), by Technology 2024 & 2032
- Figure 31: Middle East and Africa Distributed Energy Generation Industry Revenue Share (%), by Technology 2024 & 2032
- Figure 32: Middle East and Africa Distributed Energy Generation Industry Revenue (Million), by Country 2024 & 2032
- Figure 33: Middle East and Africa Distributed Energy Generation Industry Revenue Share (%), by Country 2024 & 2032
List of Tables
- Table 1: Global Distributed Energy Generation Industry Revenue Million Forecast, by Region 2019 & 2032
- Table 2: Global Distributed Energy Generation Industry Revenue Million Forecast, by Technology 2019 & 2032
- Table 3: Global Distributed Energy Generation Industry Revenue Million Forecast, by Region 2019 & 2032
- Table 4: Global Distributed Energy Generation Industry Revenue Million Forecast, by Country 2019 & 2032
- Table 5: United States Distributed Energy Generation Industry Revenue (Million) Forecast, by Application 2019 & 2032
- Table 6: Canada Distributed Energy Generation Industry Revenue (Million) Forecast, by Application 2019 & 2032
- Table 7: Mexico Distributed Energy Generation Industry Revenue (Million) Forecast, by Application 2019 & 2032
- Table 8: Global Distributed Energy Generation Industry Revenue Million Forecast, by Country 2019 & 2032
- Table 9: Germany Distributed Energy Generation Industry Revenue (Million) Forecast, by Application 2019 & 2032
- Table 10: United Kingdom Distributed Energy Generation Industry Revenue (Million) Forecast, by Application 2019 & 2032
- Table 11: France Distributed Energy Generation Industry Revenue (Million) Forecast, by Application 2019 & 2032
- Table 12: Spain Distributed Energy Generation Industry Revenue (Million) Forecast, by Application 2019 & 2032
- Table 13: Italy Distributed Energy Generation Industry Revenue (Million) Forecast, by Application 2019 & 2032
- Table 14: Spain Distributed Energy Generation Industry Revenue (Million) Forecast, by Application 2019 & 2032
- Table 15: Belgium Distributed Energy Generation Industry Revenue (Million) Forecast, by Application 2019 & 2032
- Table 16: Netherland Distributed Energy Generation Industry Revenue (Million) Forecast, by Application 2019 & 2032
- Table 17: Nordics Distributed Energy Generation Industry Revenue (Million) Forecast, by Application 2019 & 2032
- Table 18: Rest of Europe Distributed Energy Generation Industry Revenue (Million) Forecast, by Application 2019 & 2032
- Table 19: Global Distributed Energy Generation Industry Revenue Million Forecast, by Country 2019 & 2032
- Table 20: China Distributed Energy Generation Industry Revenue (Million) Forecast, by Application 2019 & 2032
- Table 21: Japan Distributed Energy Generation Industry Revenue (Million) Forecast, by Application 2019 & 2032
- Table 22: India Distributed Energy Generation Industry Revenue (Million) Forecast, by Application 2019 & 2032
- Table 23: South Korea Distributed Energy Generation Industry Revenue (Million) Forecast, by Application 2019 & 2032
- Table 24: Southeast Asia Distributed Energy Generation Industry Revenue (Million) Forecast, by Application 2019 & 2032
- Table 25: Australia Distributed Energy Generation Industry Revenue (Million) Forecast, by Application 2019 & 2032
- Table 26: Indonesia Distributed Energy Generation Industry Revenue (Million) Forecast, by Application 2019 & 2032
- Table 27: Phillipes Distributed Energy Generation Industry Revenue (Million) Forecast, by Application 2019 & 2032
- Table 28: Singapore Distributed Energy Generation Industry Revenue (Million) Forecast, by Application 2019 & 2032
- Table 29: Thailandc Distributed Energy Generation Industry Revenue (Million) Forecast, by Application 2019 & 2032
- Table 30: Rest of Asia Pacific Distributed Energy Generation Industry Revenue (Million) Forecast, by Application 2019 & 2032
- Table 31: Global Distributed Energy Generation Industry Revenue Million Forecast, by Country 2019 & 2032
- Table 32: Brazil Distributed Energy Generation Industry Revenue (Million) Forecast, by Application 2019 & 2032
- Table 33: Argentina Distributed Energy Generation Industry Revenue (Million) Forecast, by Application 2019 & 2032
- Table 34: Peru Distributed Energy Generation Industry Revenue (Million) Forecast, by Application 2019 & 2032
- Table 35: Chile Distributed Energy Generation Industry Revenue (Million) Forecast, by Application 2019 & 2032
- Table 36: Colombia Distributed Energy Generation Industry Revenue (Million) Forecast, by Application 2019 & 2032
- Table 37: Ecuador Distributed Energy Generation Industry Revenue (Million) Forecast, by Application 2019 & 2032
- Table 38: Venezuela Distributed Energy Generation Industry Revenue (Million) Forecast, by Application 2019 & 2032
- Table 39: Rest of South America Distributed Energy Generation Industry Revenue (Million) Forecast, by Application 2019 & 2032
- Table 40: Global Distributed Energy Generation Industry Revenue Million Forecast, by Country 2019 & 2032
- Table 41: United States Distributed Energy Generation Industry Revenue (Million) Forecast, by Application 2019 & 2032
- Table 42: Canada Distributed Energy Generation Industry Revenue (Million) Forecast, by Application 2019 & 2032
- Table 43: Mexico Distributed Energy Generation Industry Revenue (Million) Forecast, by Application 2019 & 2032
- Table 44: Global Distributed Energy Generation Industry Revenue Million Forecast, by Country 2019 & 2032
- Table 45: United Arab Emirates Distributed Energy Generation Industry Revenue (Million) Forecast, by Application 2019 & 2032
- Table 46: Saudi Arabia Distributed Energy Generation Industry Revenue (Million) Forecast, by Application 2019 & 2032
- Table 47: South Africa Distributed Energy Generation Industry Revenue (Million) Forecast, by Application 2019 & 2032
- Table 48: Rest of Middle East and Africa Distributed Energy Generation Industry Revenue (Million) Forecast, by Application 2019 & 2032
- Table 49: Global Distributed Energy Generation Industry Revenue Million Forecast, by Technology 2019 & 2032
- Table 50: Global Distributed Energy Generation Industry Revenue Million Forecast, by Country 2019 & 2032
- Table 51: Global Distributed Energy Generation Industry Revenue Million Forecast, by Technology 2019 & 2032
- Table 52: Global Distributed Energy Generation Industry Revenue Million Forecast, by Country 2019 & 2032
- Table 53: Global Distributed Energy Generation Industry Revenue Million Forecast, by Technology 2019 & 2032
- Table 54: Global Distributed Energy Generation Industry Revenue Million Forecast, by Country 2019 & 2032
- Table 55: Global Distributed Energy Generation Industry Revenue Million Forecast, by Technology 2019 & 2032
- Table 56: Global Distributed Energy Generation Industry Revenue Million Forecast, by Country 2019 & 2032
- Table 57: Global Distributed Energy Generation Industry Revenue Million Forecast, by Technology 2019 & 2032
- Table 58: Global Distributed Energy Generation Industry Revenue Million Forecast, by Country 2019 & 2032
Frequently Asked Questions
1. What is the projected Compound Annual Growth Rate (CAGR) of the Distributed Energy Generation Industry?
The projected CAGR is approximately > 8.00%.
2. Which companies are prominent players in the Distributed Energy Generation Industry?
Key companies in the market include Ballard Power Systems Inc, Canadian Solar Inc *List Not Exhaustive, Sunverge Energy, Siemens AG, General Electric Co, Schneider Electric SE, Caterpillar Inc, Fuelcell Energy Inc, Cummins Inc, Ansaldo Energia SpA, Capstone Turbine Corporation, Bloom Energy.
3. What are the main segments of the Distributed Energy Generation Industry?
The market segments include Technology.
4. Can you provide details about the market size?
The market size is estimated to be USD XX Million as of 2022.
5. What are some drivers contributing to market growth?
4.; Global Energy Transition Toward Renewables4.; The Rollout of New Technologies in Many Developed Countries.
6. What are the notable trends driving market growth?
Solar PV to Dominate the Market.
7. Are there any restraints impacting market growth?
4.; The Technology's Exorbitant Costs and Environmental Impacts.
8. Can you provide examples of recent developments in the market?
December 2022: Phase 2 of the grid-connected rooftop solar scheme was commenced by Bangalore Electricity Supply Company Limited (BESCOM), which was expected to focus on the installation of solar panels. BESCOM was given a mandate to install 10 MW of capacity by the Union Ministry of New and Renewable Energy (MNRE) to promote distributed energy generation.
9. What pricing options are available for accessing the report?
Pricing options include single-user, multi-user, and enterprise licenses priced at USD 4750, USD 5250, and USD 8750 respectively.
10. Is the market size provided in terms of value or volume?
The market size is provided in terms of value, measured in Million.
11. Are there any specific market keywords associated with the report?
Yes, the market keyword associated with the report is "Distributed Energy Generation Industry," which aids in identifying and referencing the specific market segment covered.
12. How do I determine which pricing option suits my needs best?
The pricing options vary based on user requirements and access needs. Individual users may opt for single-user licenses, while businesses requiring broader access may choose multi-user or enterprise licenses for cost-effective access to the report.
13. Are there any additional resources or data provided in the Distributed Energy Generation Industry report?
While the report offers comprehensive insights, it's advisable to review the specific contents or supplementary materials provided to ascertain if additional resources or data are available.
14. How can I stay updated on further developments or reports in the Distributed Energy Generation Industry?
To stay informed about further developments, trends, and reports in the Distributed Energy Generation Industry, consider subscribing to industry newsletters, following relevant companies and organizations, or regularly checking reputable industry news sources and publications.
Methodology
Step 1 - Identification of Relevant Samples Size from Population Database


Step 2 - Approaches for Defining Global Market Size (Value, Volume* & Price*)

Note*: In applicable scenarios
Step 3 - Data Sources
Primary Research
- Web Analytics
- Survey Reports
- Research Institute
- Latest Research Reports
- Opinion Leaders
Secondary Research
- Annual Reports
- White Paper
- Latest Press Release
- Industry Association
- Paid Database
- Investor Presentations

Step 4 - Data Triangulation
Involves using different sources of information in order to increase the validity of a study
These sources are likely to be stakeholders in a program - participants, other researchers, program staff, other community members, and so on.
Then we put all data in single framework & apply various statistical tools to find out the dynamic on the market.
During the analysis stage, feedback from the stakeholder groups would be compared to determine areas of agreement as well as areas of divergence


