
Key Insights
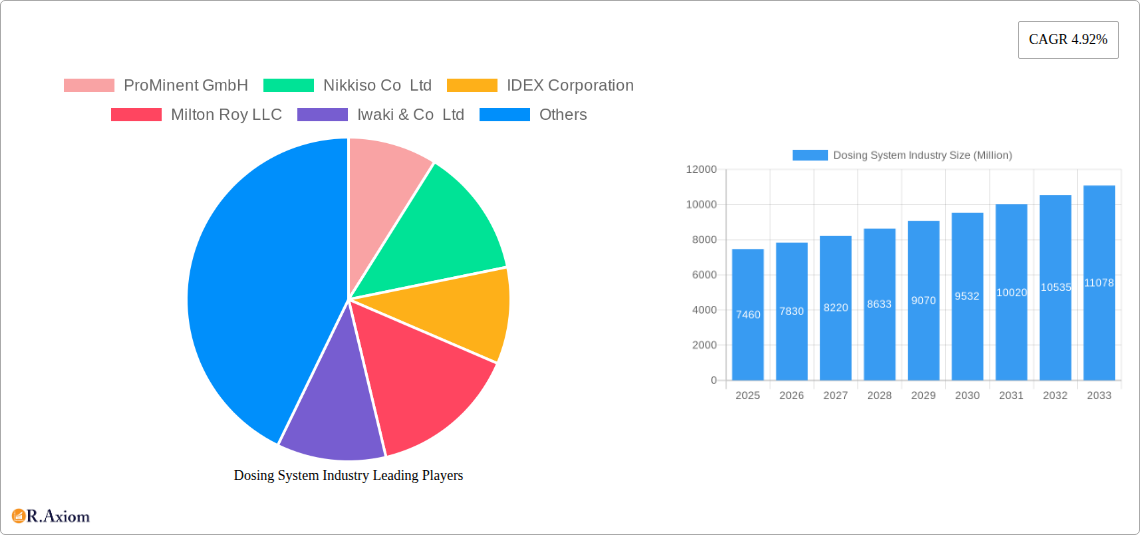
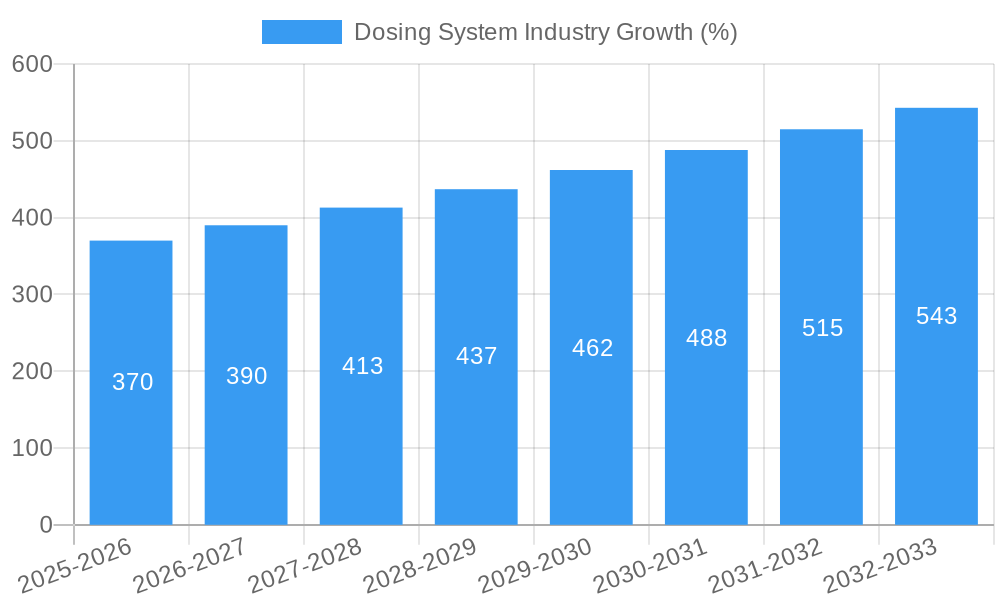
The global dosing system market, valued at $7.46 billion in 2025, is projected to experience robust growth, driven by increasing demand across diverse sectors. A compound annual growth rate (CAGR) of 4.92% from 2025 to 2033 indicates a significant expansion, reaching an estimated market value exceeding $11 billion by 2033. This growth is fueled by several key factors. The burgeoning oil and gas industry, with its continuous need for precise chemical injection and fluid handling, is a major contributor. Furthermore, stringent environmental regulations in water and sewage treatment are driving the adoption of sophisticated dosing systems to ensure compliance. The chemical industry's reliance on precise chemical dispensing for various processes also fuels market expansion. Technological advancements, such as the incorporation of smart sensors and automation, are enhancing the efficiency and accuracy of dosing systems, leading to increased adoption across different applications. The market is segmented by pump type (diaphragm, piston, and others) and application (oil and gas, water and sewage treatment, chemicals, and others), with diaphragm pumps currently holding a significant market share due to their versatility and ease of maintenance. Regionally, North America and Europe are expected to maintain substantial market shares, driven by robust industrial activity and stringent environmental regulations, although the Asia-Pacific region is poised for significant growth due to rapid industrialization and infrastructure development. Competition within the market is intense, with established players like ProMinent, Nikkiso, IDEX, and Grundfos continually innovating and expanding their product portfolios.
The competitive landscape is characterized by both established multinational corporations and specialized niche players. These companies are focusing on strategies such as strategic partnerships, mergers and acquisitions, and product development to maintain their market positions and capitalize on growth opportunities. Future market growth will be shaped by factors like increasing automation and digitalization, the development of more sustainable and energy-efficient dosing systems, and the growing demand for customized solutions to meet specific industry needs. Government initiatives promoting sustainable practices and stringent environmental regulations will continue to play a crucial role in shaping market demand, particularly in regions with burgeoning industrial sectors. The continued emphasis on precise chemical handling and the rising adoption of advanced technologies within various industries suggest sustained growth for the dosing system market throughout the forecast period.
This comprehensive report provides a detailed analysis of the global dosing system industry, offering in-depth insights into market trends, competitive dynamics, and future growth prospects. The study period covers 2019-2033, with 2025 as the base and estimated year. The report segments the market by type (Diaphragm Pump, Piston Pump, Other Types) and application (Oil and Gas, Water and Sewage Treatment, Chemicals, Other Applications), offering granular data for informed decision-making. The report’s value surpasses xx Million, providing invaluable information for industry stakeholders, investors, and market entrants.
Dosing System Industry Market Concentration & Innovation
The global dosing system market exhibits a moderately concentrated landscape, with several key players holding significant market share. While precise market share figures for each company are proprietary data requiring deeper research, companies like ProMinent GmbH, Nikkiso Co Ltd, IDEX Corporation, Milton Roy LLC, Iwaki & Co Ltd, Grundfos Holding AS, Dover Corporation, SPX Flow Inc, Verder Ltd, and Watson-Marlow Fluid Technology Group are among the dominant players. The market is characterized by ongoing innovation driven by the need for enhanced efficiency, precision, and automation in various applications. Regulatory frameworks, particularly those concerning environmental protection and safety standards, significantly influence market dynamics. Product substitutes, while limited, include gravity-fed systems and alternative metering technologies, though these often lack the precision and control offered by advanced dosing systems. End-user trends indicate a growing preference for smart, connected dosing systems offering remote monitoring and control capabilities. M&A activity within the industry has been moderate in recent years, with deal values typically ranging from xx Million to xx Million, reflecting consolidation efforts among existing players. Further research into this is needed to determine precise figures.
- Market Concentration: Moderately concentrated with several key players.
- Innovation Drivers: Enhanced efficiency, precision, automation, and environmental regulations.
- Regulatory Frameworks: Significant influence on market dynamics, impacting safety and environmental standards.
- M&A Activity: Moderate activity, with deal values varying.
Dosing System Industry Industry Trends & Insights
The global dosing system market is experiencing robust growth, driven by increasing industrialization, stringent environmental regulations, and the rising adoption of advanced technologies across diverse sectors. The compound annual growth rate (CAGR) during the forecast period (2025-2033) is projected to be xx%, indicating significant market expansion. Technological disruptions are reshaping the industry landscape, with the integration of smart sensors, advanced control systems, and data analytics enhancing system performance, efficiency, and predictive maintenance. Consumer preferences are shifting towards solutions that offer enhanced reliability, user-friendliness, and reduced operational costs. The competitive dynamics are characterized by intense rivalry among established players and emerging innovative companies, leading to continuous product development and strategic partnerships. Market penetration for smart dosing systems is growing at a rate of xx% annually, highlighting the increasing demand for sophisticated solutions. The oil and gas industry continues to be a major driver, with demand for high-precision chemical injection systems remaining strong.
Dominant Markets & Segments in Dosing System Industry
The water and sewage treatment segment holds a dominant position in the global dosing system market, driven by the increasing need for effective water purification and wastewater treatment. This segment accounts for approximately xx% of the total market value (xx Million). The Chemicals segment is also a key contributor, due to the critical role of precise chemical dosing in various manufacturing processes. Geographically, North America and Europe currently hold significant market shares, driven by robust industrial infrastructure, stringent environmental regulations, and strong technological advancements. However, Asia-Pacific is emerging as a rapidly growing region, driven by rapid industrialization and infrastructure development.
- Key Drivers for Water and Sewage Treatment: Stringent environmental regulations, increasing urbanization, and growing demand for clean water.
- Key Drivers for Chemicals Segment: Precise chemical dosing requirements in various manufacturing processes, including pharmaceuticals and food processing.
- Key Drivers for North America and Europe: Robust industrial infrastructure, advanced technologies, and stringent environmental regulations.
- Key Drivers for Asia-Pacific: Rapid industrialization, infrastructure development, and increasing government investments.
Dosing System Industry Product Developments
Recent product innovations in the dosing system market focus on enhanced precision, remote monitoring, and improved energy efficiency. Manufacturers are increasingly integrating advanced features such as predictive maintenance capabilities and intelligent control systems to optimize system performance and reduce operational costs. These advancements enhance the overall value proposition for end-users by improving efficiency, reducing downtime, and lowering the total cost of ownership. Market fit is strengthened by the adoption of modular designs and flexible configurations, enabling customers to tailor systems to specific applications and requirements.
Report Scope & Segmentation Analysis
This report provides a comprehensive analysis of the dosing system market, segmented by type and application.
By Type:
- Diaphragm Pumps: This segment holds a significant market share, driven by their versatility and suitability for handling a wide range of fluids. Market size is projected to reach xx Million by 2033.
- Piston Pumps: This segment is characterized by high precision and is commonly used in applications requiring accurate dosing. Market size is projected to reach xx Million by 2033.
- Other Types: This segment includes various other types of dosing pumps, each with its specific applications and market characteristics. Market size is projected to reach xx Million by 2033.
By Application:
- Oil and Gas: This segment is characterized by high-pressure and high-temperature applications, requiring specialized dosing systems.
- Water and Sewage Treatment: This segment is the largest, driven by the need for precise chemical dosing in water treatment processes.
- Chemicals: This segment benefits from precise chemical dispensing in various chemical processes.
- Other Applications: This encompasses various industries utilizing dosing systems, including food and beverage processing and pharmaceuticals.
Key Drivers of Dosing System Industry Growth
Several factors contribute to the growth of the dosing system industry. These include the increasing demand for precise chemical and fluid handling in various industrial processes, stricter environmental regulations mandating efficient resource management, and technological advancements leading to more efficient and reliable dosing systems. Growing automation across different sectors also drives adoption. Government initiatives promoting water conservation and wastewater treatment further boost market growth.
Challenges in the Dosing System Industry Sector
The dosing system industry faces several challenges, including the fluctuating prices of raw materials, stringent safety and environmental regulations requiring compliance investments, and intense competition among established players and new entrants. Supply chain disruptions can also impact production and delivery timelines. The high initial investment cost for advanced systems can also act as a barrier to entry for some customers.
Emerging Opportunities in Dosing System Industry
Emerging opportunities lie in the adoption of smart technologies, such as AI-powered predictive maintenance and remote monitoring capabilities. The expansion into new applications, such as the growing personalized medicine sector requiring precise fluid handling, presents significant potential. The increasing focus on sustainability and the adoption of eco-friendly materials offer opportunities for manufacturers to develop sustainable solutions.
Leading Players in the Dosing System Industry Market
- ProMinent GmbH
- Nikkiso Co Ltd
- IDEX Corporation
- Milton Roy LLC
- Iwaki & Co Ltd
- Grundfos Holding AS
- Dover Corporation
- SPX Flow Inc
- Verder Ltd
- Watson-Marlow Fluid Technology Group
Key Developments in Dosing System Industry Industry
- April 2022: SEKO launched upgraded WareDose warewash dosing pump systems with integrated Wi-Fi hubs for enhanced remote monitoring and control. This significantly improved user experience and system management.
- September 2022: Verder Liquids released the Verderflex Ds500 metering and dosing pump, designed to improve chemical dosing in municipal and industrial applications, presenting a new competitive option in the market.
Strategic Outlook for Dosing System Industry Market
The future of the dosing system market appears bright, driven by technological advancements, increasing demand from various industries, and stricter environmental regulations. The focus on developing smart, connected, and energy-efficient dosing systems will continue to drive market growth. Expansion into emerging markets and the development of niche applications will create further opportunities for market participants. Companies that embrace innovation and adapt to changing market dynamics will be well-positioned to capitalize on the growth potential of this sector.
Dosing System Industry Segmentation
-
1. Type
- 1.1. Diaphragm Pump
- 1.2. Piston Pump
- 1.3. Other Types
-
2. Application
- 2.1. Oil and Gas
- 2.2. Water and Sewage Treatment
- 2.3. Chemicals
- 2.4. Other Applications
Dosing System Industry Segmentation By Geography
-
1. North America
- 1.1. United States
- 1.2. Canada
- 1.3. Rest of North America
-
2. Europe
- 2.1. Germany
- 2.2. United Kingdom
- 2.3. France
- 2.4. Spain
- 2.5. Italy
- 2.6. Rest of Europe
-
3. Asia Pacific
- 3.1. China
- 3.2. India
- 3.3. Japan
- 3.4. South Korea
- 3.5. Rest of Asia Pacific
-
4. South America
- 4.1. Brazil
- 4.2. Argentina
- 4.3. Rest of South America
-
5. Middle East and Africa
- 5.1. Saudi Arabia
- 5.2. United Arab Emirates
- 5.3. South Africa
- 5.4. Rest of Middle East and Africa

Dosing System Industry REPORT HIGHLIGHTS
| Aspects | Details |
|---|---|
| Study Period | 2019-2033 |
| Base Year | 2024 |
| Estimated Year | 2025 |
| Forecast Period | 2025-2033 |
| Historical Period | 2019-2024 |
| Growth Rate | CAGR of 4.92% from 2019-2033 |
| Segmentation |
|
Table of Contents
- 1. Introduction
- 1.1. Research Scope
- 1.2. Market Segmentation
- 1.3. Research Methodology
- 1.4. Definitions and Assumptions
- 2. Executive Summary
- 2.1. Introduction
- 3. Market Dynamics
- 3.1. Introduction
- 3.2. Market Drivers
- 3.2.1. 4.; Increasing Investments in Water Treatment by Developing Countries4.; Growing Demand for the Various End-Use Sectors
- 3.3. Market Restrains
- 3.3.1. 4.; Availability of Cheap and Alternative Pumps
- 3.4. Market Trends
- 3.4.1. Water and Sewage Treatment Sector to Dominate the Market
- 4. Market Factor Analysis
- 4.1. Porters Five Forces
- 4.2. Supply/Value Chain
- 4.3. PESTEL analysis
- 4.4. Market Entropy
- 4.5. Patent/Trademark Analysis
- 5. Global Dosing System Industry Analysis, Insights and Forecast, 2019-2031
- 5.1. Market Analysis, Insights and Forecast - by Type
- 5.1.1. Diaphragm Pump
- 5.1.2. Piston Pump
- 5.1.3. Other Types
- 5.2. Market Analysis, Insights and Forecast - by Application
- 5.2.1. Oil and Gas
- 5.2.2. Water and Sewage Treatment
- 5.2.3. Chemicals
- 5.2.4. Other Applications
- 5.3. Market Analysis, Insights and Forecast - by Region
- 5.3.1. North America
- 5.3.2. Europe
- 5.3.3. Asia Pacific
- 5.3.4. South America
- 5.3.5. Middle East and Africa
- 5.1. Market Analysis, Insights and Forecast - by Type
- 6. North America Dosing System Industry Analysis, Insights and Forecast, 2019-2031
- 6.1. Market Analysis, Insights and Forecast - by Type
- 6.1.1. Diaphragm Pump
- 6.1.2. Piston Pump
- 6.1.3. Other Types
- 6.2. Market Analysis, Insights and Forecast - by Application
- 6.2.1. Oil and Gas
- 6.2.2. Water and Sewage Treatment
- 6.2.3. Chemicals
- 6.2.4. Other Applications
- 6.1. Market Analysis, Insights and Forecast - by Type
- 7. Europe Dosing System Industry Analysis, Insights and Forecast, 2019-2031
- 7.1. Market Analysis, Insights and Forecast - by Type
- 7.1.1. Diaphragm Pump
- 7.1.2. Piston Pump
- 7.1.3. Other Types
- 7.2. Market Analysis, Insights and Forecast - by Application
- 7.2.1. Oil and Gas
- 7.2.2. Water and Sewage Treatment
- 7.2.3. Chemicals
- 7.2.4. Other Applications
- 7.1. Market Analysis, Insights and Forecast - by Type
- 8. Asia Pacific Dosing System Industry Analysis, Insights and Forecast, 2019-2031
- 8.1. Market Analysis, Insights and Forecast - by Type
- 8.1.1. Diaphragm Pump
- 8.1.2. Piston Pump
- 8.1.3. Other Types
- 8.2. Market Analysis, Insights and Forecast - by Application
- 8.2.1. Oil and Gas
- 8.2.2. Water and Sewage Treatment
- 8.2.3. Chemicals
- 8.2.4. Other Applications
- 8.1. Market Analysis, Insights and Forecast - by Type
- 9. South America Dosing System Industry Analysis, Insights and Forecast, 2019-2031
- 9.1. Market Analysis, Insights and Forecast - by Type
- 9.1.1. Diaphragm Pump
- 9.1.2. Piston Pump
- 9.1.3. Other Types
- 9.2. Market Analysis, Insights and Forecast - by Application
- 9.2.1. Oil and Gas
- 9.2.2. Water and Sewage Treatment
- 9.2.3. Chemicals
- 9.2.4. Other Applications
- 9.1. Market Analysis, Insights and Forecast - by Type
- 10. Middle East and Africa Dosing System Industry Analysis, Insights and Forecast, 2019-2031
- 10.1. Market Analysis, Insights and Forecast - by Type
- 10.1.1. Diaphragm Pump
- 10.1.2. Piston Pump
- 10.1.3. Other Types
- 10.2. Market Analysis, Insights and Forecast - by Application
- 10.2.1. Oil and Gas
- 10.2.2. Water and Sewage Treatment
- 10.2.3. Chemicals
- 10.2.4. Other Applications
- 10.1. Market Analysis, Insights and Forecast - by Type
- 11. North America Dosing System Industry Analysis, Insights and Forecast, 2019-2031
- 11.1. Market Analysis, Insights and Forecast - By Country/Sub-region
- 11.1.1 United States
- 11.1.2 Canada
- 11.1.3 Rest of North America
- 12. Europe Dosing System Industry Analysis, Insights and Forecast, 2019-2031
- 12.1. Market Analysis, Insights and Forecast - By Country/Sub-region
- 12.1.1 Germany
- 12.1.2 United Kingdom
- 12.1.3 France
- 12.1.4 Spain
- 12.1.5 Italy
- 12.1.6 Rest of Europe
- 13. Asia Pacific Dosing System Industry Analysis, Insights and Forecast, 2019-2031
- 13.1. Market Analysis, Insights and Forecast - By Country/Sub-region
- 13.1.1 China
- 13.1.2 India
- 13.1.3 Japan
- 13.1.4 South Korea
- 13.1.5 Rest of Asia Pacific
- 14. South America Dosing System Industry Analysis, Insights and Forecast, 2019-2031
- 14.1. Market Analysis, Insights and Forecast - By Country/Sub-region
- 14.1.1 Brazil
- 14.1.2 Argentina
- 14.1.3 Rest of South America
- 15. Middle East and Africa Dosing System Industry Analysis, Insights and Forecast, 2019-2031
- 15.1. Market Analysis, Insights and Forecast - By Country/Sub-region
- 15.1.1 Saudi Arabia
- 15.1.2 United Arab Emirates
- 15.1.3 South Africa
- 15.1.4 Rest of Middle East and Africa
- 16. Competitive Analysis
- 16.1. Global Market Share Analysis 2024
- 16.2. Company Profiles
- 16.2.1 ProMinent GmbH
- 16.2.1.1. Overview
- 16.2.1.2. Products
- 16.2.1.3. SWOT Analysis
- 16.2.1.4. Recent Developments
- 16.2.1.5. Financials (Based on Availability)
- 16.2.2 Nikkiso Co Ltd
- 16.2.2.1. Overview
- 16.2.2.2. Products
- 16.2.2.3. SWOT Analysis
- 16.2.2.4. Recent Developments
- 16.2.2.5. Financials (Based on Availability)
- 16.2.3 IDEX Corporation
- 16.2.3.1. Overview
- 16.2.3.2. Products
- 16.2.3.3. SWOT Analysis
- 16.2.3.4. Recent Developments
- 16.2.3.5. Financials (Based on Availability)
- 16.2.4 Milton Roy LLC
- 16.2.4.1. Overview
- 16.2.4.2. Products
- 16.2.4.3. SWOT Analysis
- 16.2.4.4. Recent Developments
- 16.2.4.5. Financials (Based on Availability)
- 16.2.5 Iwaki & Co Ltd
- 16.2.5.1. Overview
- 16.2.5.2. Products
- 16.2.5.3. SWOT Analysis
- 16.2.5.4. Recent Developments
- 16.2.5.5. Financials (Based on Availability)
- 16.2.6 Grundfos Holding AS
- 16.2.6.1. Overview
- 16.2.6.2. Products
- 16.2.6.3. SWOT Analysis
- 16.2.6.4. Recent Developments
- 16.2.6.5. Financials (Based on Availability)
- 16.2.7 Dover Corporation
- 16.2.7.1. Overview
- 16.2.7.2. Products
- 16.2.7.3. SWOT Analysis
- 16.2.7.4. Recent Developments
- 16.2.7.5. Financials (Based on Availability)
- 16.2.8 SPX Flow Inc
- 16.2.8.1. Overview
- 16.2.8.2. Products
- 16.2.8.3. SWOT Analysis
- 16.2.8.4. Recent Developments
- 16.2.8.5. Financials (Based on Availability)
- 16.2.9 Verder Ltd*List Not Exhaustive
- 16.2.9.1. Overview
- 16.2.9.2. Products
- 16.2.9.3. SWOT Analysis
- 16.2.9.4. Recent Developments
- 16.2.9.5. Financials (Based on Availability)
- 16.2.10 Watson-Marlow Fluid Technology Group
- 16.2.10.1. Overview
- 16.2.10.2. Products
- 16.2.10.3. SWOT Analysis
- 16.2.10.4. Recent Developments
- 16.2.10.5. Financials (Based on Availability)
- 16.2.1 ProMinent GmbH
List of Figures
- Figure 1: Global Dosing System Industry Revenue Breakdown (Million, %) by Region 2024 & 2032
- Figure 2: Global Dosing System Industry Volume Breakdown (K Tons, %) by Region 2024 & 2032
- Figure 3: North America Dosing System Industry Revenue (Million), by Country 2024 & 2032
- Figure 4: North America Dosing System Industry Volume (K Tons), by Country 2024 & 2032
- Figure 5: North America Dosing System Industry Revenue Share (%), by Country 2024 & 2032
- Figure 6: North America Dosing System Industry Volume Share (%), by Country 2024 & 2032
- Figure 7: Europe Dosing System Industry Revenue (Million), by Country 2024 & 2032
- Figure 8: Europe Dosing System Industry Volume (K Tons), by Country 2024 & 2032
- Figure 9: Europe Dosing System Industry Revenue Share (%), by Country 2024 & 2032
- Figure 10: Europe Dosing System Industry Volume Share (%), by Country 2024 & 2032
- Figure 11: Asia Pacific Dosing System Industry Revenue (Million), by Country 2024 & 2032
- Figure 12: Asia Pacific Dosing System Industry Volume (K Tons), by Country 2024 & 2032
- Figure 13: Asia Pacific Dosing System Industry Revenue Share (%), by Country 2024 & 2032
- Figure 14: Asia Pacific Dosing System Industry Volume Share (%), by Country 2024 & 2032
- Figure 15: South America Dosing System Industry Revenue (Million), by Country 2024 & 2032
- Figure 16: South America Dosing System Industry Volume (K Tons), by Country 2024 & 2032
- Figure 17: South America Dosing System Industry Revenue Share (%), by Country 2024 & 2032
- Figure 18: South America Dosing System Industry Volume Share (%), by Country 2024 & 2032
- Figure 19: Middle East and Africa Dosing System Industry Revenue (Million), by Country 2024 & 2032
- Figure 20: Middle East and Africa Dosing System Industry Volume (K Tons), by Country 2024 & 2032
- Figure 21: Middle East and Africa Dosing System Industry Revenue Share (%), by Country 2024 & 2032
- Figure 22: Middle East and Africa Dosing System Industry Volume Share (%), by Country 2024 & 2032
- Figure 23: North America Dosing System Industry Revenue (Million), by Type 2024 & 2032
- Figure 24: North America Dosing System Industry Volume (K Tons), by Type 2024 & 2032
- Figure 25: North America Dosing System Industry Revenue Share (%), by Type 2024 & 2032
- Figure 26: North America Dosing System Industry Volume Share (%), by Type 2024 & 2032
- Figure 27: North America Dosing System Industry Revenue (Million), by Application 2024 & 2032
- Figure 28: North America Dosing System Industry Volume (K Tons), by Application 2024 & 2032
- Figure 29: North America Dosing System Industry Revenue Share (%), by Application 2024 & 2032
- Figure 30: North America Dosing System Industry Volume Share (%), by Application 2024 & 2032
- Figure 31: North America Dosing System Industry Revenue (Million), by Country 2024 & 2032
- Figure 32: North America Dosing System Industry Volume (K Tons), by Country 2024 & 2032
- Figure 33: North America Dosing System Industry Revenue Share (%), by Country 2024 & 2032
- Figure 34: North America Dosing System Industry Volume Share (%), by Country 2024 & 2032
- Figure 35: Europe Dosing System Industry Revenue (Million), by Type 2024 & 2032
- Figure 36: Europe Dosing System Industry Volume (K Tons), by Type 2024 & 2032
- Figure 37: Europe Dosing System Industry Revenue Share (%), by Type 2024 & 2032
- Figure 38: Europe Dosing System Industry Volume Share (%), by Type 2024 & 2032
- Figure 39: Europe Dosing System Industry Revenue (Million), by Application 2024 & 2032
- Figure 40: Europe Dosing System Industry Volume (K Tons), by Application 2024 & 2032
- Figure 41: Europe Dosing System Industry Revenue Share (%), by Application 2024 & 2032
- Figure 42: Europe Dosing System Industry Volume Share (%), by Application 2024 & 2032
- Figure 43: Europe Dosing System Industry Revenue (Million), by Country 2024 & 2032
- Figure 44: Europe Dosing System Industry Volume (K Tons), by Country 2024 & 2032
- Figure 45: Europe Dosing System Industry Revenue Share (%), by Country 2024 & 2032
- Figure 46: Europe Dosing System Industry Volume Share (%), by Country 2024 & 2032
- Figure 47: Asia Pacific Dosing System Industry Revenue (Million), by Type 2024 & 2032
- Figure 48: Asia Pacific Dosing System Industry Volume (K Tons), by Type 2024 & 2032
- Figure 49: Asia Pacific Dosing System Industry Revenue Share (%), by Type 2024 & 2032
- Figure 50: Asia Pacific Dosing System Industry Volume Share (%), by Type 2024 & 2032
- Figure 51: Asia Pacific Dosing System Industry Revenue (Million), by Application 2024 & 2032
- Figure 52: Asia Pacific Dosing System Industry Volume (K Tons), by Application 2024 & 2032
- Figure 53: Asia Pacific Dosing System Industry Revenue Share (%), by Application 2024 & 2032
- Figure 54: Asia Pacific Dosing System Industry Volume Share (%), by Application 2024 & 2032
- Figure 55: Asia Pacific Dosing System Industry Revenue (Million), by Country 2024 & 2032
- Figure 56: Asia Pacific Dosing System Industry Volume (K Tons), by Country 2024 & 2032
- Figure 57: Asia Pacific Dosing System Industry Revenue Share (%), by Country 2024 & 2032
- Figure 58: Asia Pacific Dosing System Industry Volume Share (%), by Country 2024 & 2032
- Figure 59: South America Dosing System Industry Revenue (Million), by Type 2024 & 2032
- Figure 60: South America Dosing System Industry Volume (K Tons), by Type 2024 & 2032
- Figure 61: South America Dosing System Industry Revenue Share (%), by Type 2024 & 2032
- Figure 62: South America Dosing System Industry Volume Share (%), by Type 2024 & 2032
- Figure 63: South America Dosing System Industry Revenue (Million), by Application 2024 & 2032
- Figure 64: South America Dosing System Industry Volume (K Tons), by Application 2024 & 2032
- Figure 65: South America Dosing System Industry Revenue Share (%), by Application 2024 & 2032
- Figure 66: South America Dosing System Industry Volume Share (%), by Application 2024 & 2032
- Figure 67: South America Dosing System Industry Revenue (Million), by Country 2024 & 2032
- Figure 68: South America Dosing System Industry Volume (K Tons), by Country 2024 & 2032
- Figure 69: South America Dosing System Industry Revenue Share (%), by Country 2024 & 2032
- Figure 70: South America Dosing System Industry Volume Share (%), by Country 2024 & 2032
- Figure 71: Middle East and Africa Dosing System Industry Revenue (Million), by Type 2024 & 2032
- Figure 72: Middle East and Africa Dosing System Industry Volume (K Tons), by Type 2024 & 2032
- Figure 73: Middle East and Africa Dosing System Industry Revenue Share (%), by Type 2024 & 2032
- Figure 74: Middle East and Africa Dosing System Industry Volume Share (%), by Type 2024 & 2032
- Figure 75: Middle East and Africa Dosing System Industry Revenue (Million), by Application 2024 & 2032
- Figure 76: Middle East and Africa Dosing System Industry Volume (K Tons), by Application 2024 & 2032
- Figure 77: Middle East and Africa Dosing System Industry Revenue Share (%), by Application 2024 & 2032
- Figure 78: Middle East and Africa Dosing System Industry Volume Share (%), by Application 2024 & 2032
- Figure 79: Middle East and Africa Dosing System Industry Revenue (Million), by Country 2024 & 2032
- Figure 80: Middle East and Africa Dosing System Industry Volume (K Tons), by Country 2024 & 2032
- Figure 81: Middle East and Africa Dosing System Industry Revenue Share (%), by Country 2024 & 2032
- Figure 82: Middle East and Africa Dosing System Industry Volume Share (%), by Country 2024 & 2032
List of Tables
- Table 1: Global Dosing System Industry Revenue Million Forecast, by Region 2019 & 2032
- Table 2: Global Dosing System Industry Volume K Tons Forecast, by Region 2019 & 2032
- Table 3: Global Dosing System Industry Revenue Million Forecast, by Type 2019 & 2032
- Table 4: Global Dosing System Industry Volume K Tons Forecast, by Type 2019 & 2032
- Table 5: Global Dosing System Industry Revenue Million Forecast, by Application 2019 & 2032
- Table 6: Global Dosing System Industry Volume K Tons Forecast, by Application 2019 & 2032
- Table 7: Global Dosing System Industry Revenue Million Forecast, by Region 2019 & 2032
- Table 8: Global Dosing System Industry Volume K Tons Forecast, by Region 2019 & 2032
- Table 9: Global Dosing System Industry Revenue Million Forecast, by Country 2019 & 2032
- Table 10: Global Dosing System Industry Volume K Tons Forecast, by Country 2019 & 2032
- Table 11: United States Dosing System Industry Revenue (Million) Forecast, by Application 2019 & 2032
- Table 12: United States Dosing System Industry Volume (K Tons) Forecast, by Application 2019 & 2032
- Table 13: Canada Dosing System Industry Revenue (Million) Forecast, by Application 2019 & 2032
- Table 14: Canada Dosing System Industry Volume (K Tons) Forecast, by Application 2019 & 2032
- Table 15: Rest of North America Dosing System Industry Revenue (Million) Forecast, by Application 2019 & 2032
- Table 16: Rest of North America Dosing System Industry Volume (K Tons) Forecast, by Application 2019 & 2032
- Table 17: Global Dosing System Industry Revenue Million Forecast, by Country 2019 & 2032
- Table 18: Global Dosing System Industry Volume K Tons Forecast, by Country 2019 & 2032
- Table 19: Germany Dosing System Industry Revenue (Million) Forecast, by Application 2019 & 2032
- Table 20: Germany Dosing System Industry Volume (K Tons) Forecast, by Application 2019 & 2032
- Table 21: United Kingdom Dosing System Industry Revenue (Million) Forecast, by Application 2019 & 2032
- Table 22: United Kingdom Dosing System Industry Volume (K Tons) Forecast, by Application 2019 & 2032
- Table 23: France Dosing System Industry Revenue (Million) Forecast, by Application 2019 & 2032
- Table 24: France Dosing System Industry Volume (K Tons) Forecast, by Application 2019 & 2032
- Table 25: Spain Dosing System Industry Revenue (Million) Forecast, by Application 2019 & 2032
- Table 26: Spain Dosing System Industry Volume (K Tons) Forecast, by Application 2019 & 2032
- Table 27: Italy Dosing System Industry Revenue (Million) Forecast, by Application 2019 & 2032
- Table 28: Italy Dosing System Industry Volume (K Tons) Forecast, by Application 2019 & 2032
- Table 29: Rest of Europe Dosing System Industry Revenue (Million) Forecast, by Application 2019 & 2032
- Table 30: Rest of Europe Dosing System Industry Volume (K Tons) Forecast, by Application 2019 & 2032
- Table 31: Global Dosing System Industry Revenue Million Forecast, by Country 2019 & 2032
- Table 32: Global Dosing System Industry Volume K Tons Forecast, by Country 2019 & 2032
- Table 33: China Dosing System Industry Revenue (Million) Forecast, by Application 2019 & 2032
- Table 34: China Dosing System Industry Volume (K Tons) Forecast, by Application 2019 & 2032
- Table 35: India Dosing System Industry Revenue (Million) Forecast, by Application 2019 & 2032
- Table 36: India Dosing System Industry Volume (K Tons) Forecast, by Application 2019 & 2032
- Table 37: Japan Dosing System Industry Revenue (Million) Forecast, by Application 2019 & 2032
- Table 38: Japan Dosing System Industry Volume (K Tons) Forecast, by Application 2019 & 2032
- Table 39: South Korea Dosing System Industry Revenue (Million) Forecast, by Application 2019 & 2032
- Table 40: South Korea Dosing System Industry Volume (K Tons) Forecast, by Application 2019 & 2032
- Table 41: Rest of Asia Pacific Dosing System Industry Revenue (Million) Forecast, by Application 2019 & 2032
- Table 42: Rest of Asia Pacific Dosing System Industry Volume (K Tons) Forecast, by Application 2019 & 2032
- Table 43: Global Dosing System Industry Revenue Million Forecast, by Country 2019 & 2032
- Table 44: Global Dosing System Industry Volume K Tons Forecast, by Country 2019 & 2032
- Table 45: Brazil Dosing System Industry Revenue (Million) Forecast, by Application 2019 & 2032
- Table 46: Brazil Dosing System Industry Volume (K Tons) Forecast, by Application 2019 & 2032
- Table 47: Argentina Dosing System Industry Revenue (Million) Forecast, by Application 2019 & 2032
- Table 48: Argentina Dosing System Industry Volume (K Tons) Forecast, by Application 2019 & 2032
- Table 49: Rest of South America Dosing System Industry Revenue (Million) Forecast, by Application 2019 & 2032
- Table 50: Rest of South America Dosing System Industry Volume (K Tons) Forecast, by Application 2019 & 2032
- Table 51: Global Dosing System Industry Revenue Million Forecast, by Country 2019 & 2032
- Table 52: Global Dosing System Industry Volume K Tons Forecast, by Country 2019 & 2032
- Table 53: Saudi Arabia Dosing System Industry Revenue (Million) Forecast, by Application 2019 & 2032
- Table 54: Saudi Arabia Dosing System Industry Volume (K Tons) Forecast, by Application 2019 & 2032
- Table 55: United Arab Emirates Dosing System Industry Revenue (Million) Forecast, by Application 2019 & 2032
- Table 56: United Arab Emirates Dosing System Industry Volume (K Tons) Forecast, by Application 2019 & 2032
- Table 57: South Africa Dosing System Industry Revenue (Million) Forecast, by Application 2019 & 2032
- Table 58: South Africa Dosing System Industry Volume (K Tons) Forecast, by Application 2019 & 2032
- Table 59: Rest of Middle East and Africa Dosing System Industry Revenue (Million) Forecast, by Application 2019 & 2032
- Table 60: Rest of Middle East and Africa Dosing System Industry Volume (K Tons) Forecast, by Application 2019 & 2032
- Table 61: Global Dosing System Industry Revenue Million Forecast, by Type 2019 & 2032
- Table 62: Global Dosing System Industry Volume K Tons Forecast, by Type 2019 & 2032
- Table 63: Global Dosing System Industry Revenue Million Forecast, by Application 2019 & 2032
- Table 64: Global Dosing System Industry Volume K Tons Forecast, by Application 2019 & 2032
- Table 65: Global Dosing System Industry Revenue Million Forecast, by Country 2019 & 2032
- Table 66: Global Dosing System Industry Volume K Tons Forecast, by Country 2019 & 2032
- Table 67: United States Dosing System Industry Revenue (Million) Forecast, by Application 2019 & 2032
- Table 68: United States Dosing System Industry Volume (K Tons) Forecast, by Application 2019 & 2032
- Table 69: Canada Dosing System Industry Revenue (Million) Forecast, by Application 2019 & 2032
- Table 70: Canada Dosing System Industry Volume (K Tons) Forecast, by Application 2019 & 2032
- Table 71: Rest of North America Dosing System Industry Revenue (Million) Forecast, by Application 2019 & 2032
- Table 72: Rest of North America Dosing System Industry Volume (K Tons) Forecast, by Application 2019 & 2032
- Table 73: Global Dosing System Industry Revenue Million Forecast, by Type 2019 & 2032
- Table 74: Global Dosing System Industry Volume K Tons Forecast, by Type 2019 & 2032
- Table 75: Global Dosing System Industry Revenue Million Forecast, by Application 2019 & 2032
- Table 76: Global Dosing System Industry Volume K Tons Forecast, by Application 2019 & 2032
- Table 77: Global Dosing System Industry Revenue Million Forecast, by Country 2019 & 2032
- Table 78: Global Dosing System Industry Volume K Tons Forecast, by Country 2019 & 2032
- Table 79: Germany Dosing System Industry Revenue (Million) Forecast, by Application 2019 & 2032
- Table 80: Germany Dosing System Industry Volume (K Tons) Forecast, by Application 2019 & 2032
- Table 81: United Kingdom Dosing System Industry Revenue (Million) Forecast, by Application 2019 & 2032
- Table 82: United Kingdom Dosing System Industry Volume (K Tons) Forecast, by Application 2019 & 2032
- Table 83: France Dosing System Industry Revenue (Million) Forecast, by Application 2019 & 2032
- Table 84: France Dosing System Industry Volume (K Tons) Forecast, by Application 2019 & 2032
- Table 85: Spain Dosing System Industry Revenue (Million) Forecast, by Application 2019 & 2032
- Table 86: Spain Dosing System Industry Volume (K Tons) Forecast, by Application 2019 & 2032
- Table 87: Italy Dosing System Industry Revenue (Million) Forecast, by Application 2019 & 2032
- Table 88: Italy Dosing System Industry Volume (K Tons) Forecast, by Application 2019 & 2032
- Table 89: Rest of Europe Dosing System Industry Revenue (Million) Forecast, by Application 2019 & 2032
- Table 90: Rest of Europe Dosing System Industry Volume (K Tons) Forecast, by Application 2019 & 2032
- Table 91: Global Dosing System Industry Revenue Million Forecast, by Type 2019 & 2032
- Table 92: Global Dosing System Industry Volume K Tons Forecast, by Type 2019 & 2032
- Table 93: Global Dosing System Industry Revenue Million Forecast, by Application 2019 & 2032
- Table 94: Global Dosing System Industry Volume K Tons Forecast, by Application 2019 & 2032
- Table 95: Global Dosing System Industry Revenue Million Forecast, by Country 2019 & 2032
- Table 96: Global Dosing System Industry Volume K Tons Forecast, by Country 2019 & 2032
- Table 97: China Dosing System Industry Revenue (Million) Forecast, by Application 2019 & 2032
- Table 98: China Dosing System Industry Volume (K Tons) Forecast, by Application 2019 & 2032
- Table 99: India Dosing System Industry Revenue (Million) Forecast, by Application 2019 & 2032
- Table 100: India Dosing System Industry Volume (K Tons) Forecast, by Application 2019 & 2032
- Table 101: Japan Dosing System Industry Revenue (Million) Forecast, by Application 2019 & 2032
- Table 102: Japan Dosing System Industry Volume (K Tons) Forecast, by Application 2019 & 2032
- Table 103: South Korea Dosing System Industry Revenue (Million) Forecast, by Application 2019 & 2032
- Table 104: South Korea Dosing System Industry Volume (K Tons) Forecast, by Application 2019 & 2032
- Table 105: Rest of Asia Pacific Dosing System Industry Revenue (Million) Forecast, by Application 2019 & 2032
- Table 106: Rest of Asia Pacific Dosing System Industry Volume (K Tons) Forecast, by Application 2019 & 2032
- Table 107: Global Dosing System Industry Revenue Million Forecast, by Type 2019 & 2032
- Table 108: Global Dosing System Industry Volume K Tons Forecast, by Type 2019 & 2032
- Table 109: Global Dosing System Industry Revenue Million Forecast, by Application 2019 & 2032
- Table 110: Global Dosing System Industry Volume K Tons Forecast, by Application 2019 & 2032
- Table 111: Global Dosing System Industry Revenue Million Forecast, by Country 2019 & 2032
- Table 112: Global Dosing System Industry Volume K Tons Forecast, by Country 2019 & 2032
- Table 113: Brazil Dosing System Industry Revenue (Million) Forecast, by Application 2019 & 2032
- Table 114: Brazil Dosing System Industry Volume (K Tons) Forecast, by Application 2019 & 2032
- Table 115: Argentina Dosing System Industry Revenue (Million) Forecast, by Application 2019 & 2032
- Table 116: Argentina Dosing System Industry Volume (K Tons) Forecast, by Application 2019 & 2032
- Table 117: Rest of South America Dosing System Industry Revenue (Million) Forecast, by Application 2019 & 2032
- Table 118: Rest of South America Dosing System Industry Volume (K Tons) Forecast, by Application 2019 & 2032
- Table 119: Global Dosing System Industry Revenue Million Forecast, by Type 2019 & 2032
- Table 120: Global Dosing System Industry Volume K Tons Forecast, by Type 2019 & 2032
- Table 121: Global Dosing System Industry Revenue Million Forecast, by Application 2019 & 2032
- Table 122: Global Dosing System Industry Volume K Tons Forecast, by Application 2019 & 2032
- Table 123: Global Dosing System Industry Revenue Million Forecast, by Country 2019 & 2032
- Table 124: Global Dosing System Industry Volume K Tons Forecast, by Country 2019 & 2032
- Table 125: Saudi Arabia Dosing System Industry Revenue (Million) Forecast, by Application 2019 & 2032
- Table 126: Saudi Arabia Dosing System Industry Volume (K Tons) Forecast, by Application 2019 & 2032
- Table 127: United Arab Emirates Dosing System Industry Revenue (Million) Forecast, by Application 2019 & 2032
- Table 128: United Arab Emirates Dosing System Industry Volume (K Tons) Forecast, by Application 2019 & 2032
- Table 129: South Africa Dosing System Industry Revenue (Million) Forecast, by Application 2019 & 2032
- Table 130: South Africa Dosing System Industry Volume (K Tons) Forecast, by Application 2019 & 2032
- Table 131: Rest of Middle East and Africa Dosing System Industry Revenue (Million) Forecast, by Application 2019 & 2032
- Table 132: Rest of Middle East and Africa Dosing System Industry Volume (K Tons) Forecast, by Application 2019 & 2032
Frequently Asked Questions
1. What is the projected Compound Annual Growth Rate (CAGR) of the Dosing System Industry?
The projected CAGR is approximately 4.92%.
2. Which companies are prominent players in the Dosing System Industry?
Key companies in the market include ProMinent GmbH, Nikkiso Co Ltd, IDEX Corporation, Milton Roy LLC, Iwaki & Co Ltd, Grundfos Holding AS, Dover Corporation, SPX Flow Inc, Verder Ltd*List Not Exhaustive, Watson-Marlow Fluid Technology Group.
3. What are the main segments of the Dosing System Industry?
The market segments include Type, Application.
4. Can you provide details about the market size?
The market size is estimated to be USD 7460 Million as of 2022.
5. What are some drivers contributing to market growth?
4.; Increasing Investments in Water Treatment by Developing Countries4.; Growing Demand for the Various End-Use Sectors.
6. What are the notable trends driving market growth?
Water and Sewage Treatment Sector to Dominate the Market.
7. Are there any restraints impacting market growth?
4.; Availability of Cheap and Alternative Pumps.
8. Can you provide examples of recent developments in the market?
Apr 2022: SEKO, manufacturer of chemical dosing pumps and metering, announced the upgradation of its WareDose warewash dosing pump systems to include an integrated Wi-Fi hub, enabling operators to connect to their systems 24/7 via smartphone.
9. What pricing options are available for accessing the report?
Pricing options include single-user, multi-user, and enterprise licenses priced at USD 4750, USD 5250, and USD 8750 respectively.
10. Is the market size provided in terms of value or volume?
The market size is provided in terms of value, measured in Million and volume, measured in K Tons.
11. Are there any specific market keywords associated with the report?
Yes, the market keyword associated with the report is "Dosing System Industry," which aids in identifying and referencing the specific market segment covered.
12. How do I determine which pricing option suits my needs best?
The pricing options vary based on user requirements and access needs. Individual users may opt for single-user licenses, while businesses requiring broader access may choose multi-user or enterprise licenses for cost-effective access to the report.
13. Are there any additional resources or data provided in the Dosing System Industry report?
While the report offers comprehensive insights, it's advisable to review the specific contents or supplementary materials provided to ascertain if additional resources or data are available.
14. How can I stay updated on further developments or reports in the Dosing System Industry?
To stay informed about further developments, trends, and reports in the Dosing System Industry, consider subscribing to industry newsletters, following relevant companies and organizations, or regularly checking reputable industry news sources and publications.
Methodology
Step 1 - Identification of Relevant Samples Size from Population Database


Step 2 - Approaches for Defining Global Market Size (Value, Volume* & Price*)

Note*: In applicable scenarios
Step 3 - Data Sources
Primary Research
- Web Analytics
- Survey Reports
- Research Institute
- Latest Research Reports
- Opinion Leaders
Secondary Research
- Annual Reports
- White Paper
- Latest Press Release
- Industry Association
- Paid Database
- Investor Presentations

Step 4 - Data Triangulation
Involves using different sources of information in order to increase the validity of a study
These sources are likely to be stakeholders in a program - participants, other researchers, program staff, other community members, and so on.
Then we put all data in single framework & apply various statistical tools to find out the dynamic on the market.
During the analysis stage, feedback from the stakeholder groups would be compared to determine areas of agreement as well as areas of divergence


