
Key Insights
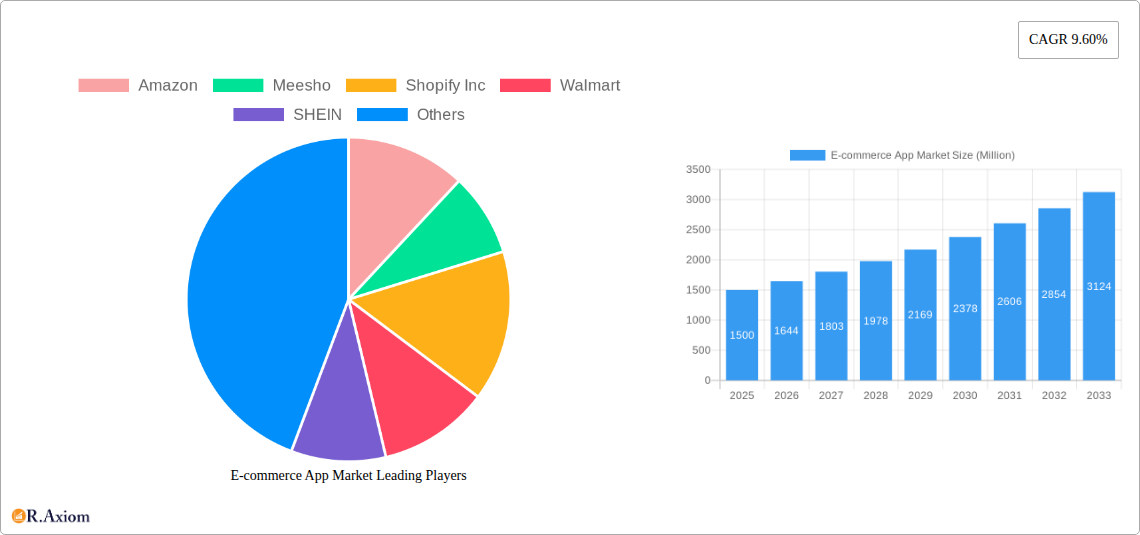
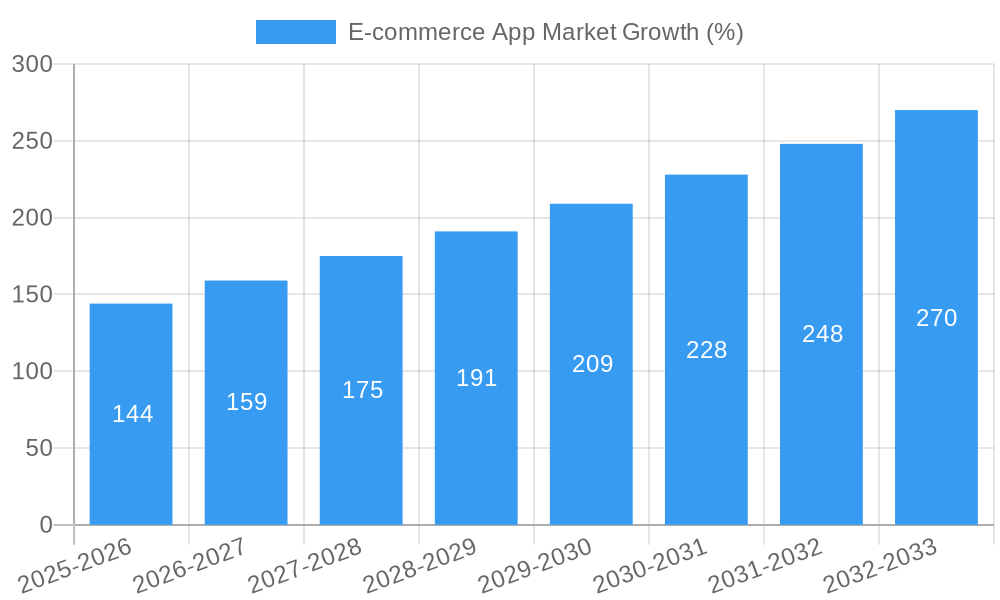
The global e-commerce app market is experiencing robust growth, driven by the increasing adoption of smartphones, rising internet penetration, and a shift towards convenient online shopping. The market's Compound Annual Growth Rate (CAGR) of 9.60% from 2019 to 2024 suggests a significant expansion, and this momentum is expected to continue throughout the forecast period (2025-2033). Key drivers include the seamless user experience offered by mobile apps, the proliferation of mobile payment solutions, and the expanding reach of e-commerce platforms into previously underserved markets. The market is segmented by type (in-app purchases, advertisement, and other types) and platform (Android and iPhone), with in-app purchases and Android platforms currently dominating. Leading players like Amazon, Meesho, Shopify, Walmart, SHEIN, AJIO, Tata Cliq, eBay, Alibaba, and Etsy are vying for market share through innovative features, aggressive marketing, and strategic partnerships. Competition is fierce, leading to continuous innovation in areas such as personalized recommendations, augmented reality shopping experiences, and improved logistics and delivery services. While the market faces potential restraints like concerns around data privacy and security, the overall trend points towards sustained growth fueled by increasing digital literacy and evolving consumer preferences.
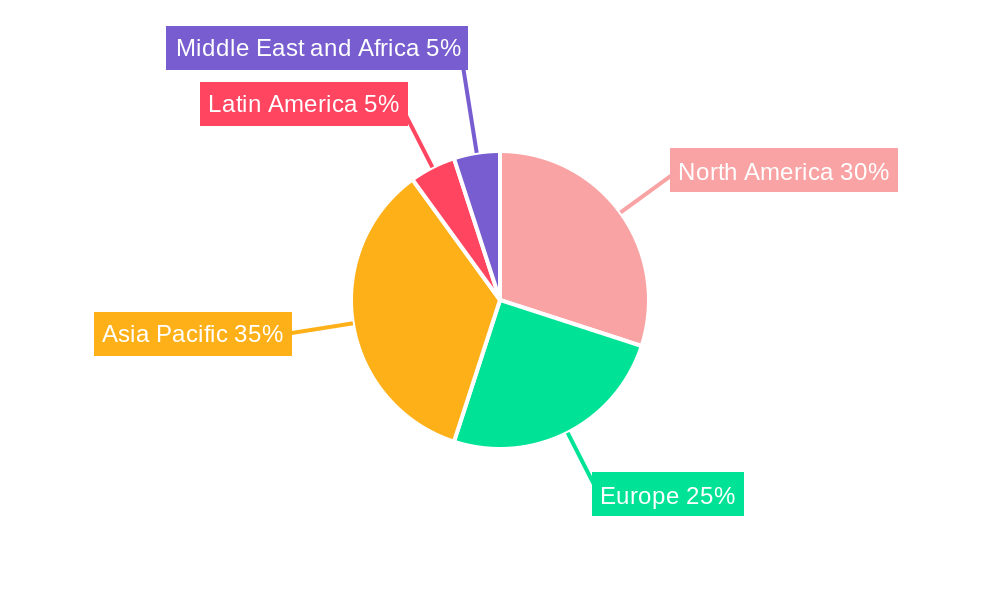
The regional distribution of the e-commerce app market reflects varying levels of economic development and digital infrastructure. Asia Pacific is projected to lead in market size, benefiting from a large and rapidly growing middle class with increasing smartphone penetration. North America and Europe will continue to hold substantial market share, driven by mature e-commerce ecosystems and high consumer spending. However, emerging markets in Latin America, the Middle East, and Africa present significant growth opportunities, particularly as internet access expands and digital payment systems become more prevalent. Future market dynamics will be shaped by technological advancements like the metaverse and the integration of artificial intelligence in shopping experiences. Furthermore, the evolving regulatory landscape surrounding data privacy and competition will significantly influence the strategic decisions of market participants. Sustained growth is anticipated, though the exact trajectory will depend on global economic conditions and the ability of companies to adapt to evolving consumer needs and technological disruptions.
E-commerce App Market: A Comprehensive Report (2019-2033)
This detailed report provides a comprehensive analysis of the global e-commerce app market, covering market size, segmentation, key players, growth drivers, challenges, and future outlook. The study period spans from 2019 to 2033, with 2025 as the base and estimated year. The forecast period is 2025-2033, and the historical period is 2019-2024. This report is crucial for investors, businesses, and stakeholders seeking actionable insights into this rapidly evolving market. The market is valued at xx Million in 2025 and is projected to reach xx Million by 2033.
E-commerce App Market Market Concentration & Innovation
The e-commerce app market exhibits a high degree of concentration, with a few dominant players capturing a significant market share. Amazon, Amazon, Walmart, Walmart, and Alibaba Alibaba currently hold a substantial portion of the global market. However, regional players like Meesho, SHEIN, AJIO, and Tata Cliq are significantly impacting specific geographic markets. Market share data for 2024 reveals Amazon at xx%, Walmart at xx%, Alibaba at xx%, and the remaining players sharing the remaining xx%.
Several factors drive innovation:
- Technological advancements: The integration of AI, AR/VR, and blockchain technologies is enhancing user experience and creating new business models.
- Consumer preferences: Growing demand for personalized experiences, seamless omnichannel integration, and secure payment gateways fuels innovation.
- Regulatory frameworks: Regulations related to data privacy and cybersecurity impact app development and security measures.
- Product substitutes: The rise of social commerce platforms and direct-to-consumer brands introduces competitive pressure, pushing for constant innovation.
Mergers and acquisitions (M&A) activity within the sector is substantial. In 2024, the total value of M&A deals in the e-commerce app market was estimated at xx Million, with a significant number of acquisitions focused on smaller, niche players by larger corporations.
E-commerce App Market Industry Trends & Insights
The global e-commerce app market exhibits robust growth, driven by several key factors. The market's compound annual growth rate (CAGR) from 2025 to 2033 is projected to be xx%. This growth is fueled by increasing smartphone penetration, expanding internet access in emerging markets, and a shift towards mobile-first shopping experiences. Market penetration is currently at approximately xx% globally, with significant potential for expansion in underserved regions.
Technological disruptions are constantly reshaping the landscape. The adoption of technologies such as artificial intelligence (AI) for personalized recommendations, augmented reality (AR) for virtual try-ons, and blockchain for enhanced security and transparency is creating new avenues for growth. Consumer preferences are evolving, with a growing demand for convenient, personalized, and seamless shopping experiences. Competitive dynamics are intensifying, with existing players constantly innovating and new entrants challenging the status quo. This dynamic environment requires companies to adapt quickly and strategically to maintain their market position.
Dominant Markets & Segments in E-commerce App Market
The North American and Asian markets dominate the e-commerce app landscape, driven by high smartphone penetration and robust digital infrastructure. Within these regions, countries like the USA, China, and India display exceptional growth.
By Type:
- In-app Purchases: This segment dominates, driven by the ease of purchasing directly within the app. Key drivers include user convenience and targeted marketing.
- Advertisement: This segment is experiencing significant growth fueled by the increasing popularity of mobile advertising and targeted campaign techniques.
- Other Types: This segment includes subscription models, affiliate marketing, and other revenue streams that continue to grow steadily.
By Platform:
- Android: The large user base of Android devices provides significant market share for Android-based e-commerce apps. Key drivers include affordability and device accessibility in emerging markets.
- iPhone: The iPhone segment is characterized by higher average revenue per user (ARPU) due to its affluent user base, driving substantial revenue for iOS e-commerce apps.
E-commerce App Market Product Developments
Recent product innovations focus on improving user experience, personalization, and security. The integration of AI-powered recommendation engines, AR/VR features for virtual try-ons, and improved payment gateways are key trends. Companies are also focusing on enhancing mobile app security features to address increasing concerns about data privacy and fraud. These innovations improve market fit by directly addressing user needs and enhancing the overall shopping experience, increasing customer loyalty and market share.
Report Scope & Segmentation Analysis
This report comprehensively analyzes the e-commerce app market across various segments:
By Type: In-app Purchases, Advertisement, Other Types. Each segment shows significant growth potential, with In-app Purchases holding the largest market share in 2025. Advertisement is predicted to experience the fastest growth due to increasing digital advertising spending.
By Platform: Android and iPhone. Both platforms are significant, with Android experiencing greater user growth, and iPhone maintaining higher ARPU.
Growth projections for each segment are detailed within the full report, alongside comprehensive market size estimations and an analysis of the competitive landscape within each segment.
Key Drivers of E-commerce App Market Growth
Several factors drive e-commerce app market growth:
- Technological advancements: AI, AR/VR, and blockchain technologies enhance user experience and create new revenue streams.
- Rising smartphone penetration: Increased smartphone ownership, especially in emerging economies, expands the potential user base.
- Evolving consumer preferences: Consumers increasingly prefer the convenience and personalization of mobile shopping.
- Government support: Policies promoting digital commerce and digital infrastructure development facilitate market expansion.
Challenges in the E-commerce App Market Sector
The e-commerce app market faces significant challenges:
- Intense competition: The market is highly competitive, with established players and new entrants vying for market share.
- Data security and privacy concerns: Data breaches and privacy violations can severely damage user trust and brand reputation.
- Regulatory hurdles: Varying regulations across different regions create complexities for businesses operating globally.
- Supply chain disruptions: Global events can lead to unpredictable delays and increase costs. For example, the impact of the COVID-19 pandemic resulted in an xx% increase in shipping costs globally, impacting profitability.
Emerging Opportunities in E-commerce App Market
The e-commerce app market presents several lucrative opportunities:
- Expansion into emerging markets: Untapped markets in developing countries offer significant growth potential.
- Adoption of innovative technologies: AI, AR/VR, and blockchain present opportunities to enhance user experience and create new business models.
- Growth of social commerce: Integration with social media platforms allows for targeted marketing and increased sales.
- Personalization and customization: Tailoring products and services to individual consumer preferences drives customer engagement.
Leading Players in the E-commerce App Market Market
- Amazon
- Meesho
- Shopify Inc
- Walmart
- SHEIN
- AJIO
- Tata Cliq
- eBay
- Alibaba com
- Etsy Inc
Key Developments in E-commerce App Market Industry
- October 2022: Flipkart launched Flipverse, a metaverse shopping experience, showcasing the adoption of web3 technologies.
- June 2022: eBay introduced eBay Live, a real-time interactive shopping platform, highlighting the increasing importance of live commerce.
Strategic Outlook for E-commerce App Market Market
The e-commerce app market is poised for sustained growth, driven by technological innovations, increasing smartphone penetration, and evolving consumer preferences. Companies that leverage these trends, prioritize data security, and adapt to changing regulations will be best positioned for success. The market's potential is immense, particularly in emerging markets and with the continued integration of cutting-edge technologies. A proactive approach to innovation and strategic partnerships will be crucial for companies seeking to capitalize on future growth opportunities.
E-commerce App Market Segmentation
-
1. Type
- 1.1. In-app Purchases
- 1.2. Advertisement
- 1.3. Other Types
-
2. Platform
- 2.1. Android
- 2.2. iPhone
E-commerce App Market Segmentation By Geography
- 1. North America
- 2. Europe
- 3. Asia Pacific
- 4. Latin America
- 5. Middle East and Africa
E-commerce App Market REPORT HIGHLIGHTS
| Aspects | Details |
|---|---|
| Study Period | 2019-2033 |
| Base Year | 2024 |
| Estimated Year | 2025 |
| Forecast Period | 2025-2033 |
| Historical Period | 2019-2024 |
| Growth Rate | CAGR of 9.60% from 2019-2033 |
| Segmentation |
|
Table of Contents
- 1. Introduction
- 1.1. Research Scope
- 1.2. Market Segmentation
- 1.3. Research Methodology
- 1.4. Definitions and Assumptions
- 2. Executive Summary
- 2.1. Introduction
- 3. Market Dynamics
- 3.1. Introduction
- 3.2. Market Drivers
- 3.2.1. Utilizing Emerging Technologies Drives Market Growth; Huge Penetration of Smartphones in the Market
- 3.3. Market Restrains
- 3.3.1. Consumers Security Related Concerns
- 3.4. Market Trends
- 3.4.1. Use of Emerging Technologies Aids Market Growth
- 4. Market Factor Analysis
- 4.1. Porters Five Forces
- 4.2. Supply/Value Chain
- 4.3. PESTEL analysis
- 4.4. Market Entropy
- 4.5. Patent/Trademark Analysis
- 5. Global E-commerce App Market Analysis, Insights and Forecast, 2019-2031
- 5.1. Market Analysis, Insights and Forecast - by Type
- 5.1.1. In-app Purchases
- 5.1.2. Advertisement
- 5.1.3. Other Types
- 5.2. Market Analysis, Insights and Forecast - by Platform
- 5.2.1. Android
- 5.2.2. iPhone
- 5.3. Market Analysis, Insights and Forecast - by Region
- 5.3.1. North America
- 5.3.2. Europe
- 5.3.3. Asia Pacific
- 5.3.4. Latin America
- 5.3.5. Middle East and Africa
- 5.1. Market Analysis, Insights and Forecast - by Type
- 6. North America E-commerce App Market Analysis, Insights and Forecast, 2019-2031
- 6.1. Market Analysis, Insights and Forecast - by Type
- 6.1.1. In-app Purchases
- 6.1.2. Advertisement
- 6.1.3. Other Types
- 6.2. Market Analysis, Insights and Forecast - by Platform
- 6.2.1. Android
- 6.2.2. iPhone
- 6.1. Market Analysis, Insights and Forecast - by Type
- 7. Europe E-commerce App Market Analysis, Insights and Forecast, 2019-2031
- 7.1. Market Analysis, Insights and Forecast - by Type
- 7.1.1. In-app Purchases
- 7.1.2. Advertisement
- 7.1.3. Other Types
- 7.2. Market Analysis, Insights and Forecast - by Platform
- 7.2.1. Android
- 7.2.2. iPhone
- 7.1. Market Analysis, Insights and Forecast - by Type
- 8. Asia Pacific E-commerce App Market Analysis, Insights and Forecast, 2019-2031
- 8.1. Market Analysis, Insights and Forecast - by Type
- 8.1.1. In-app Purchases
- 8.1.2. Advertisement
- 8.1.3. Other Types
- 8.2. Market Analysis, Insights and Forecast - by Platform
- 8.2.1. Android
- 8.2.2. iPhone
- 8.1. Market Analysis, Insights and Forecast - by Type
- 9. Latin America E-commerce App Market Analysis, Insights and Forecast, 2019-2031
- 9.1. Market Analysis, Insights and Forecast - by Type
- 9.1.1. In-app Purchases
- 9.1.2. Advertisement
- 9.1.3. Other Types
- 9.2. Market Analysis, Insights and Forecast - by Platform
- 9.2.1. Android
- 9.2.2. iPhone
- 9.1. Market Analysis, Insights and Forecast - by Type
- 10. Middle East and Africa E-commerce App Market Analysis, Insights and Forecast, 2019-2031
- 10.1. Market Analysis, Insights and Forecast - by Type
- 10.1.1. In-app Purchases
- 10.1.2. Advertisement
- 10.1.3. Other Types
- 10.2. Market Analysis, Insights and Forecast - by Platform
- 10.2.1. Android
- 10.2.2. iPhone
- 10.1. Market Analysis, Insights and Forecast - by Type
- 11. North America E-commerce App Market Analysis, Insights and Forecast, 2019-2031
- 11.1. Market Analysis, Insights and Forecast - By Country/Sub-region
- 11.1.1.
- 12. Europe E-commerce App Market Analysis, Insights and Forecast, 2019-2031
- 12.1. Market Analysis, Insights and Forecast - By Country/Sub-region
- 12.1.1.
- 13. Asia Pacific E-commerce App Market Analysis, Insights and Forecast, 2019-2031
- 13.1. Market Analysis, Insights and Forecast - By Country/Sub-region
- 13.1.1.
- 14. Latin America E-commerce App Market Analysis, Insights and Forecast, 2019-2031
- 14.1. Market Analysis, Insights and Forecast - By Country/Sub-region
- 14.1.1.
- 15. Middle East and Africa E-commerce App Market Analysis, Insights and Forecast, 2019-2031
- 15.1. Market Analysis, Insights and Forecast - By Country/Sub-region
- 15.1.1.
- 16. Competitive Analysis
- 16.1. Global Market Share Analysis 2024
- 16.2. Company Profiles
- 16.2.1 Amazon
- 16.2.1.1. Overview
- 16.2.1.2. Products
- 16.2.1.3. SWOT Analysis
- 16.2.1.4. Recent Developments
- 16.2.1.5. Financials (Based on Availability)
- 16.2.2 Meesho
- 16.2.2.1. Overview
- 16.2.2.2. Products
- 16.2.2.3. SWOT Analysis
- 16.2.2.4. Recent Developments
- 16.2.2.5. Financials (Based on Availability)
- 16.2.3 Shopify Inc
- 16.2.3.1. Overview
- 16.2.3.2. Products
- 16.2.3.3. SWOT Analysis
- 16.2.3.4. Recent Developments
- 16.2.3.5. Financials (Based on Availability)
- 16.2.4 Walmart
- 16.2.4.1. Overview
- 16.2.4.2. Products
- 16.2.4.3. SWOT Analysis
- 16.2.4.4. Recent Developments
- 16.2.4.5. Financials (Based on Availability)
- 16.2.5 SHEIN
- 16.2.5.1. Overview
- 16.2.5.2. Products
- 16.2.5.3. SWOT Analysis
- 16.2.5.4. Recent Developments
- 16.2.5.5. Financials (Based on Availability)
- 16.2.6 AJIO
- 16.2.6.1. Overview
- 16.2.6.2. Products
- 16.2.6.3. SWOT Analysis
- 16.2.6.4. Recent Developments
- 16.2.6.5. Financials (Based on Availability)
- 16.2.7 Tata Cliq
- 16.2.7.1. Overview
- 16.2.7.2. Products
- 16.2.7.3. SWOT Analysis
- 16.2.7.4. Recent Developments
- 16.2.7.5. Financials (Based on Availability)
- 16.2.8 eBay
- 16.2.8.1. Overview
- 16.2.8.2. Products
- 16.2.8.3. SWOT Analysis
- 16.2.8.4. Recent Developments
- 16.2.8.5. Financials (Based on Availability)
- 16.2.9 Alibaba com
- 16.2.9.1. Overview
- 16.2.9.2. Products
- 16.2.9.3. SWOT Analysis
- 16.2.9.4. Recent Developments
- 16.2.9.5. Financials (Based on Availability)
- 16.2.10 Etsy Inc
- 16.2.10.1. Overview
- 16.2.10.2. Products
- 16.2.10.3. SWOT Analysis
- 16.2.10.4. Recent Developments
- 16.2.10.5. Financials (Based on Availability)
- 16.2.1 Amazon
List of Figures
- Figure 1: Global E-commerce App Market Revenue Breakdown (Million, %) by Region 2024 & 2032
- Figure 2: Global E-commerce App Market Volume Breakdown (K Unit, %) by Region 2024 & 2032
- Figure 3: North America E-commerce App Market Revenue (Million), by Country 2024 & 2032
- Figure 4: North America E-commerce App Market Volume (K Unit), by Country 2024 & 2032
- Figure 5: North America E-commerce App Market Revenue Share (%), by Country 2024 & 2032
- Figure 6: North America E-commerce App Market Volume Share (%), by Country 2024 & 2032
- Figure 7: Europe E-commerce App Market Revenue (Million), by Country 2024 & 2032
- Figure 8: Europe E-commerce App Market Volume (K Unit), by Country 2024 & 2032
- Figure 9: Europe E-commerce App Market Revenue Share (%), by Country 2024 & 2032
- Figure 10: Europe E-commerce App Market Volume Share (%), by Country 2024 & 2032
- Figure 11: Asia Pacific E-commerce App Market Revenue (Million), by Country 2024 & 2032
- Figure 12: Asia Pacific E-commerce App Market Volume (K Unit), by Country 2024 & 2032
- Figure 13: Asia Pacific E-commerce App Market Revenue Share (%), by Country 2024 & 2032
- Figure 14: Asia Pacific E-commerce App Market Volume Share (%), by Country 2024 & 2032
- Figure 15: Latin America E-commerce App Market Revenue (Million), by Country 2024 & 2032
- Figure 16: Latin America E-commerce App Market Volume (K Unit), by Country 2024 & 2032
- Figure 17: Latin America E-commerce App Market Revenue Share (%), by Country 2024 & 2032
- Figure 18: Latin America E-commerce App Market Volume Share (%), by Country 2024 & 2032
- Figure 19: Middle East and Africa E-commerce App Market Revenue (Million), by Country 2024 & 2032
- Figure 20: Middle East and Africa E-commerce App Market Volume (K Unit), by Country 2024 & 2032
- Figure 21: Middle East and Africa E-commerce App Market Revenue Share (%), by Country 2024 & 2032
- Figure 22: Middle East and Africa E-commerce App Market Volume Share (%), by Country 2024 & 2032
- Figure 23: North America E-commerce App Market Revenue (Million), by Type 2024 & 2032
- Figure 24: North America E-commerce App Market Volume (K Unit), by Type 2024 & 2032
- Figure 25: North America E-commerce App Market Revenue Share (%), by Type 2024 & 2032
- Figure 26: North America E-commerce App Market Volume Share (%), by Type 2024 & 2032
- Figure 27: North America E-commerce App Market Revenue (Million), by Platform 2024 & 2032
- Figure 28: North America E-commerce App Market Volume (K Unit), by Platform 2024 & 2032
- Figure 29: North America E-commerce App Market Revenue Share (%), by Platform 2024 & 2032
- Figure 30: North America E-commerce App Market Volume Share (%), by Platform 2024 & 2032
- Figure 31: North America E-commerce App Market Revenue (Million), by Country 2024 & 2032
- Figure 32: North America E-commerce App Market Volume (K Unit), by Country 2024 & 2032
- Figure 33: North America E-commerce App Market Revenue Share (%), by Country 2024 & 2032
- Figure 34: North America E-commerce App Market Volume Share (%), by Country 2024 & 2032
- Figure 35: Europe E-commerce App Market Revenue (Million), by Type 2024 & 2032
- Figure 36: Europe E-commerce App Market Volume (K Unit), by Type 2024 & 2032
- Figure 37: Europe E-commerce App Market Revenue Share (%), by Type 2024 & 2032
- Figure 38: Europe E-commerce App Market Volume Share (%), by Type 2024 & 2032
- Figure 39: Europe E-commerce App Market Revenue (Million), by Platform 2024 & 2032
- Figure 40: Europe E-commerce App Market Volume (K Unit), by Platform 2024 & 2032
- Figure 41: Europe E-commerce App Market Revenue Share (%), by Platform 2024 & 2032
- Figure 42: Europe E-commerce App Market Volume Share (%), by Platform 2024 & 2032
- Figure 43: Europe E-commerce App Market Revenue (Million), by Country 2024 & 2032
- Figure 44: Europe E-commerce App Market Volume (K Unit), by Country 2024 & 2032
- Figure 45: Europe E-commerce App Market Revenue Share (%), by Country 2024 & 2032
- Figure 46: Europe E-commerce App Market Volume Share (%), by Country 2024 & 2032
- Figure 47: Asia Pacific E-commerce App Market Revenue (Million), by Type 2024 & 2032
- Figure 48: Asia Pacific E-commerce App Market Volume (K Unit), by Type 2024 & 2032
- Figure 49: Asia Pacific E-commerce App Market Revenue Share (%), by Type 2024 & 2032
- Figure 50: Asia Pacific E-commerce App Market Volume Share (%), by Type 2024 & 2032
- Figure 51: Asia Pacific E-commerce App Market Revenue (Million), by Platform 2024 & 2032
- Figure 52: Asia Pacific E-commerce App Market Volume (K Unit), by Platform 2024 & 2032
- Figure 53: Asia Pacific E-commerce App Market Revenue Share (%), by Platform 2024 & 2032
- Figure 54: Asia Pacific E-commerce App Market Volume Share (%), by Platform 2024 & 2032
- Figure 55: Asia Pacific E-commerce App Market Revenue (Million), by Country 2024 & 2032
- Figure 56: Asia Pacific E-commerce App Market Volume (K Unit), by Country 2024 & 2032
- Figure 57: Asia Pacific E-commerce App Market Revenue Share (%), by Country 2024 & 2032
- Figure 58: Asia Pacific E-commerce App Market Volume Share (%), by Country 2024 & 2032
- Figure 59: Latin America E-commerce App Market Revenue (Million), by Type 2024 & 2032
- Figure 60: Latin America E-commerce App Market Volume (K Unit), by Type 2024 & 2032
- Figure 61: Latin America E-commerce App Market Revenue Share (%), by Type 2024 & 2032
- Figure 62: Latin America E-commerce App Market Volume Share (%), by Type 2024 & 2032
- Figure 63: Latin America E-commerce App Market Revenue (Million), by Platform 2024 & 2032
- Figure 64: Latin America E-commerce App Market Volume (K Unit), by Platform 2024 & 2032
- Figure 65: Latin America E-commerce App Market Revenue Share (%), by Platform 2024 & 2032
- Figure 66: Latin America E-commerce App Market Volume Share (%), by Platform 2024 & 2032
- Figure 67: Latin America E-commerce App Market Revenue (Million), by Country 2024 & 2032
- Figure 68: Latin America E-commerce App Market Volume (K Unit), by Country 2024 & 2032
- Figure 69: Latin America E-commerce App Market Revenue Share (%), by Country 2024 & 2032
- Figure 70: Latin America E-commerce App Market Volume Share (%), by Country 2024 & 2032
- Figure 71: Middle East and Africa E-commerce App Market Revenue (Million), by Type 2024 & 2032
- Figure 72: Middle East and Africa E-commerce App Market Volume (K Unit), by Type 2024 & 2032
- Figure 73: Middle East and Africa E-commerce App Market Revenue Share (%), by Type 2024 & 2032
- Figure 74: Middle East and Africa E-commerce App Market Volume Share (%), by Type 2024 & 2032
- Figure 75: Middle East and Africa E-commerce App Market Revenue (Million), by Platform 2024 & 2032
- Figure 76: Middle East and Africa E-commerce App Market Volume (K Unit), by Platform 2024 & 2032
- Figure 77: Middle East and Africa E-commerce App Market Revenue Share (%), by Platform 2024 & 2032
- Figure 78: Middle East and Africa E-commerce App Market Volume Share (%), by Platform 2024 & 2032
- Figure 79: Middle East and Africa E-commerce App Market Revenue (Million), by Country 2024 & 2032
- Figure 80: Middle East and Africa E-commerce App Market Volume (K Unit), by Country 2024 & 2032
- Figure 81: Middle East and Africa E-commerce App Market Revenue Share (%), by Country 2024 & 2032
- Figure 82: Middle East and Africa E-commerce App Market Volume Share (%), by Country 2024 & 2032
List of Tables
- Table 1: Global E-commerce App Market Revenue Million Forecast, by Region 2019 & 2032
- Table 2: Global E-commerce App Market Volume K Unit Forecast, by Region 2019 & 2032
- Table 3: Global E-commerce App Market Revenue Million Forecast, by Type 2019 & 2032
- Table 4: Global E-commerce App Market Volume K Unit Forecast, by Type 2019 & 2032
- Table 5: Global E-commerce App Market Revenue Million Forecast, by Platform 2019 & 2032
- Table 6: Global E-commerce App Market Volume K Unit Forecast, by Platform 2019 & 2032
- Table 7: Global E-commerce App Market Revenue Million Forecast, by Region 2019 & 2032
- Table 8: Global E-commerce App Market Volume K Unit Forecast, by Region 2019 & 2032
- Table 9: Global E-commerce App Market Revenue Million Forecast, by Country 2019 & 2032
- Table 10: Global E-commerce App Market Volume K Unit Forecast, by Country 2019 & 2032
- Table 11: E-commerce App Market Revenue (Million) Forecast, by Application 2019 & 2032
- Table 12: E-commerce App Market Volume (K Unit) Forecast, by Application 2019 & 2032
- Table 13: Global E-commerce App Market Revenue Million Forecast, by Country 2019 & 2032
- Table 14: Global E-commerce App Market Volume K Unit Forecast, by Country 2019 & 2032
- Table 15: E-commerce App Market Revenue (Million) Forecast, by Application 2019 & 2032
- Table 16: E-commerce App Market Volume (K Unit) Forecast, by Application 2019 & 2032
- Table 17: Global E-commerce App Market Revenue Million Forecast, by Country 2019 & 2032
- Table 18: Global E-commerce App Market Volume K Unit Forecast, by Country 2019 & 2032
- Table 19: E-commerce App Market Revenue (Million) Forecast, by Application 2019 & 2032
- Table 20: E-commerce App Market Volume (K Unit) Forecast, by Application 2019 & 2032
- Table 21: Global E-commerce App Market Revenue Million Forecast, by Country 2019 & 2032
- Table 22: Global E-commerce App Market Volume K Unit Forecast, by Country 2019 & 2032
- Table 23: E-commerce App Market Revenue (Million) Forecast, by Application 2019 & 2032
- Table 24: E-commerce App Market Volume (K Unit) Forecast, by Application 2019 & 2032
- Table 25: Global E-commerce App Market Revenue Million Forecast, by Country 2019 & 2032
- Table 26: Global E-commerce App Market Volume K Unit Forecast, by Country 2019 & 2032
- Table 27: E-commerce App Market Revenue (Million) Forecast, by Application 2019 & 2032
- Table 28: E-commerce App Market Volume (K Unit) Forecast, by Application 2019 & 2032
- Table 29: Global E-commerce App Market Revenue Million Forecast, by Type 2019 & 2032
- Table 30: Global E-commerce App Market Volume K Unit Forecast, by Type 2019 & 2032
- Table 31: Global E-commerce App Market Revenue Million Forecast, by Platform 2019 & 2032
- Table 32: Global E-commerce App Market Volume K Unit Forecast, by Platform 2019 & 2032
- Table 33: Global E-commerce App Market Revenue Million Forecast, by Country 2019 & 2032
- Table 34: Global E-commerce App Market Volume K Unit Forecast, by Country 2019 & 2032
- Table 35: Global E-commerce App Market Revenue Million Forecast, by Type 2019 & 2032
- Table 36: Global E-commerce App Market Volume K Unit Forecast, by Type 2019 & 2032
- Table 37: Global E-commerce App Market Revenue Million Forecast, by Platform 2019 & 2032
- Table 38: Global E-commerce App Market Volume K Unit Forecast, by Platform 2019 & 2032
- Table 39: Global E-commerce App Market Revenue Million Forecast, by Country 2019 & 2032
- Table 40: Global E-commerce App Market Volume K Unit Forecast, by Country 2019 & 2032
- Table 41: Global E-commerce App Market Revenue Million Forecast, by Type 2019 & 2032
- Table 42: Global E-commerce App Market Volume K Unit Forecast, by Type 2019 & 2032
- Table 43: Global E-commerce App Market Revenue Million Forecast, by Platform 2019 & 2032
- Table 44: Global E-commerce App Market Volume K Unit Forecast, by Platform 2019 & 2032
- Table 45: Global E-commerce App Market Revenue Million Forecast, by Country 2019 & 2032
- Table 46: Global E-commerce App Market Volume K Unit Forecast, by Country 2019 & 2032
- Table 47: Global E-commerce App Market Revenue Million Forecast, by Type 2019 & 2032
- Table 48: Global E-commerce App Market Volume K Unit Forecast, by Type 2019 & 2032
- Table 49: Global E-commerce App Market Revenue Million Forecast, by Platform 2019 & 2032
- Table 50: Global E-commerce App Market Volume K Unit Forecast, by Platform 2019 & 2032
- Table 51: Global E-commerce App Market Revenue Million Forecast, by Country 2019 & 2032
- Table 52: Global E-commerce App Market Volume K Unit Forecast, by Country 2019 & 2032
- Table 53: Global E-commerce App Market Revenue Million Forecast, by Type 2019 & 2032
- Table 54: Global E-commerce App Market Volume K Unit Forecast, by Type 2019 & 2032
- Table 55: Global E-commerce App Market Revenue Million Forecast, by Platform 2019 & 2032
- Table 56: Global E-commerce App Market Volume K Unit Forecast, by Platform 2019 & 2032
- Table 57: Global E-commerce App Market Revenue Million Forecast, by Country 2019 & 2032
- Table 58: Global E-commerce App Market Volume K Unit Forecast, by Country 2019 & 2032
Frequently Asked Questions
1. What is the projected Compound Annual Growth Rate (CAGR) of the E-commerce App Market?
The projected CAGR is approximately 9.60%.
2. Which companies are prominent players in the E-commerce App Market?
Key companies in the market include Amazon, Meesho, Shopify Inc, Walmart, SHEIN, AJIO, Tata Cliq, eBay, Alibaba com, Etsy Inc.
3. What are the main segments of the E-commerce App Market?
The market segments include Type, Platform.
4. Can you provide details about the market size?
The market size is estimated to be USD XX Million as of 2022.
5. What are some drivers contributing to market growth?
Utilizing Emerging Technologies Drives Market Growth; Huge Penetration of Smartphones in the Market.
6. What are the notable trends driving market growth?
Use of Emerging Technologies Aids Market Growth.
7. Are there any restraints impacting market growth?
Consumers Security Related Concerns.
8. Can you provide examples of recent developments in the market?
In October 2022, Flipkart, a Walmart subsidiary and a major Indian online retailer, introduced a metaverse purchasing experience. The latest venture from the Indian e-commerce giant experiments with web3 solutions to enhance its customer experience and offer them a more interactive way to find and shop new products. The business is launching the metaverse service, Flipverse, in collaboration with eDAO, a Polygon-incubated business.
9. What pricing options are available for accessing the report?
Pricing options include single-user, multi-user, and enterprise licenses priced at USD 4750, USD 5250, and USD 8750 respectively.
10. Is the market size provided in terms of value or volume?
The market size is provided in terms of value, measured in Million and volume, measured in K Unit.
11. Are there any specific market keywords associated with the report?
Yes, the market keyword associated with the report is "E-commerce App Market," which aids in identifying and referencing the specific market segment covered.
12. How do I determine which pricing option suits my needs best?
The pricing options vary based on user requirements and access needs. Individual users may opt for single-user licenses, while businesses requiring broader access may choose multi-user or enterprise licenses for cost-effective access to the report.
13. Are there any additional resources or data provided in the E-commerce App Market report?
While the report offers comprehensive insights, it's advisable to review the specific contents or supplementary materials provided to ascertain if additional resources or data are available.
14. How can I stay updated on further developments or reports in the E-commerce App Market?
To stay informed about further developments, trends, and reports in the E-commerce App Market, consider subscribing to industry newsletters, following relevant companies and organizations, or regularly checking reputable industry news sources and publications.
Methodology
Step 1 - Identification of Relevant Samples Size from Population Database


Step 2 - Approaches for Defining Global Market Size (Value, Volume* & Price*)

Note*: In applicable scenarios
Step 3 - Data Sources
Primary Research
- Web Analytics
- Survey Reports
- Research Institute
- Latest Research Reports
- Opinion Leaders
Secondary Research
- Annual Reports
- White Paper
- Latest Press Release
- Industry Association
- Paid Database
- Investor Presentations

Step 4 - Data Triangulation
Involves using different sources of information in order to increase the validity of a study
These sources are likely to be stakeholders in a program - participants, other researchers, program staff, other community members, and so on.
Then we put all data in single framework & apply various statistical tools to find out the dynamic on the market.
During the analysis stage, feedback from the stakeholder groups would be compared to determine areas of agreement as well as areas of divergence


