
Key Insights
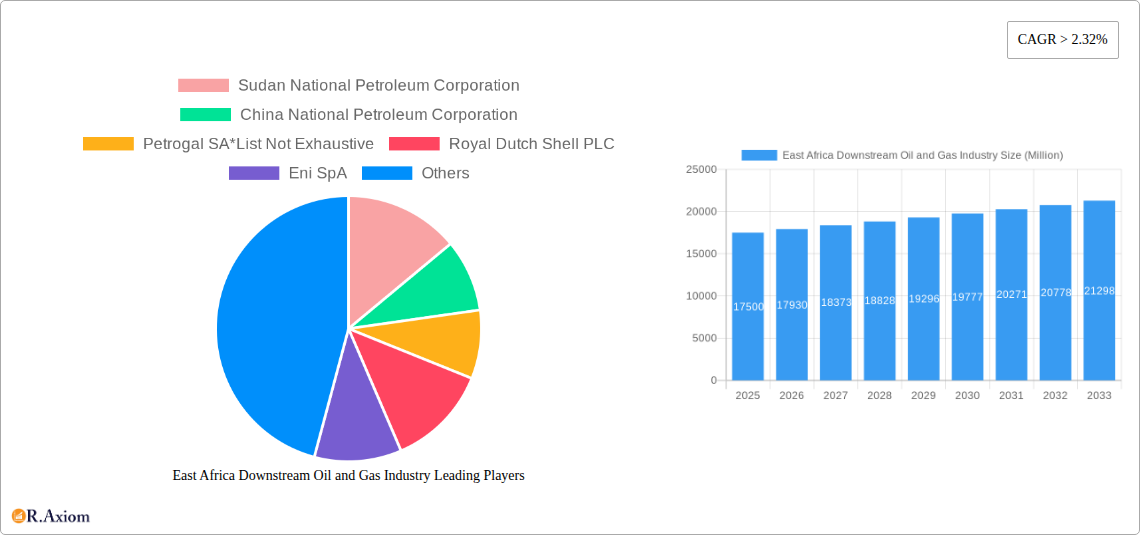
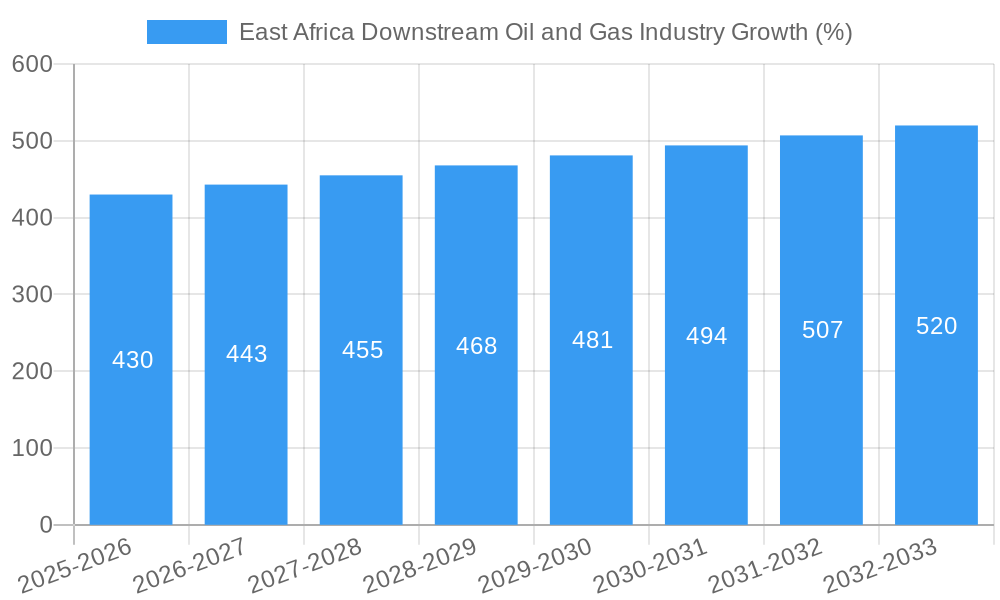
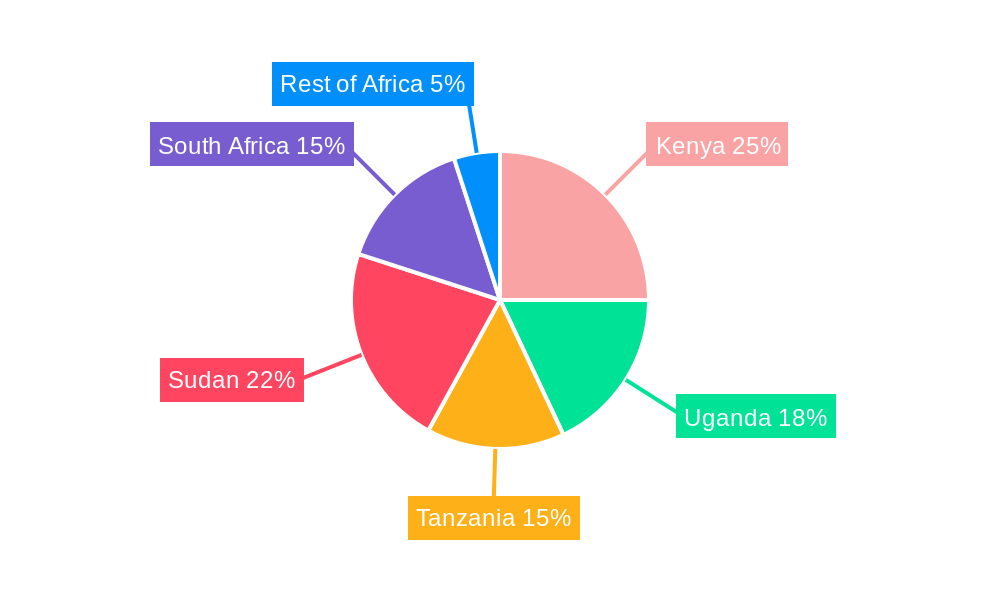
The East African downstream oil and gas industry, valued at $17,500 million in 2025, is projected for robust growth, driven by rising energy demand fueled by a burgeoning population and expanding industrialization across Kenya, Uganda, Tanzania, Sudan, and South Africa. A compound annual growth rate (CAGR) exceeding 2.32% is anticipated through 2033, indicating a significant market expansion. Key growth drivers include increasing vehicle ownership, particularly in urban centers, rising industrial activities requiring substantial energy resources, and expanding LPG adoption for household cooking fuel, replacing traditional biomass fuels. The market is segmented by refined petroleum products (gasoline, diesel, jet fuel), lubricants, petrochemicals, and LPG, catering to industrial, transportation, commercial, and household end-users. Major players like the Sudan National Petroleum Corporation, China National Petroleum Corporation, and international giants such as Royal Dutch Shell PLC and Total Energies are actively competing, shaping the competitive landscape. However, the market faces restraints such as price volatility in global crude oil markets, potential regulatory changes impacting fuel pricing and distribution, and the increasing focus on renewable energy sources, which may influence future energy consumption patterns in the long term.
The industry's trajectory will be significantly influenced by government policies concerning energy security, infrastructure development (pipeline expansion, refinery capacity upgrades), and the degree of investment in renewable energy alternatives. Growth in specific segments, like petrochemicals, will depend on the development of downstream petrochemical industries to create value-added products within the region. Furthermore, the industry's success hinges on the efficient management of supply chains, particularly regarding the transportation and distribution of petroleum products across sometimes challenging geographical terrains. Ongoing investments in infrastructure and technological advancements, combined with strategic partnerships between international and local players, will be key factors determining the market's future performance. This makes the East African downstream oil and gas sector an attractive market for both established and emerging players looking for opportunities in a developing region.
East Africa Downstream Oil and Gas Industry: A Comprehensive Market Report (2019-2033)
This comprehensive report provides an in-depth analysis of the East Africa downstream oil and gas industry, covering the period from 2019 to 2033. It offers invaluable insights for industry stakeholders, investors, and policymakers seeking to understand the market's dynamics, opportunities, and challenges. The report leverages rigorous research methodologies and incorporates up-to-date data to forecast market trends and growth prospects. Key segments analyzed include refined petroleum products, lubricants, petrochemicals, and liquefied petroleum gas (LPG), across industrial, transportation, commercial, and household end-user sectors. The report features detailed profiles of major players such as Sudan National Petroleum Corporation, China National Petroleum Corporation, Petrogal SA, Royal Dutch Shell PLC, Eni SpA, Kenya Petroleum Refineries Ltd (KPRL), Total Energies Marketing Kenya, Shell Kenya, National Oil Corporation of Kenya (NOCK), and Oil Libya (Tamoil).
East Africa Downstream Oil and Gas Industry Market Concentration & Innovation
This section analyzes the market concentration, innovation drivers, regulatory frameworks, product substitutes, end-user trends, and mergers and acquisitions (M&A) activities within the East African downstream oil and gas sector. The study period covers 2019-2033, with 2025 as the base and estimated year.
The market exhibits a moderately concentrated structure, with a few major international and national players holding significant market share. The combined market share of the top five players in 2024 was estimated at xx%. Innovation is driven by the need to enhance efficiency, improve product quality, and meet evolving environmental regulations. Stringent regulatory frameworks, particularly concerning environmental protection and safety standards, influence industry practices. The rising adoption of biofuels and other renewable energy sources presents a significant challenge as product substitutes. Shifting consumer preferences towards cleaner fuels and environmentally friendly lubricants are reshaping market demand. M&A activities have played a crucial role in shaping the competitive landscape, with notable transactions valued at over USD xx Million in the recent past. For instance, the acquisition of producing oil fields in South Sudan by Savannah Energy in December 2022, valued at USD 1.25 Billion, signifies significant investment and consolidation within the sector.
- Market Share: Top 5 players held xx% in 2024.
- M&A Deal Values: Significant transactions exceeding USD xx Million in recent years.
- Innovation Drivers: Efficiency improvements, product quality enhancement, and environmental regulations.
- Regulatory Framework: Stringent environmental and safety standards.
East Africa Downstream Oil and Gas Industry Industry Trends & Insights
This section delves into the market growth drivers, technological disruptions, consumer preferences, and competitive dynamics within the East African downstream oil and gas industry. The analysis uses data from the historical period (2019-2024) to forecast trends during the forecast period (2025-2033).
The East African downstream oil and gas market is projected to experience robust growth, driven by rising energy demand fueled by population growth and economic expansion. Technological advancements, such as the adoption of digitalization and automation in refining processes, are improving efficiency and operational effectiveness. Consumer preferences are shifting towards higher-quality products with enhanced environmental performance. Intense competition among players is driving innovation and price optimization. The compound annual growth rate (CAGR) for the forecast period (2025-2033) is estimated at xx%, with market penetration expected to reach xx% by 2033. This growth is influenced by infrastructure development, government policies promoting energy security, and increasing urbanization. However, volatile crude oil prices and geopolitical uncertainties present significant challenges.
Dominant Markets & Segments in East Africa Downstream Oil and Gas Industry
This section identifies the leading regions, countries, and segments within the East African downstream oil and gas market. The analysis encompasses refined petroleum products, lubricants, petrochemicals, and LPG across industrial, transportation, commercial, and household end-user segments.
Dominant Segment: Refined petroleum products represent the largest segment, accounting for xx% of the market in 2024.
Key Drivers for Refined Petroleum Products Dominance:
- Rapid urbanization and motorization leading to increased transportation fuel demand.
- Industrial growth driving demand for fuel in manufacturing and power generation.
- Growing household consumption in expanding urban centers.
Dominant Region/Country: Kenya holds the largest market share due to its relatively developed infrastructure and higher energy consumption compared to other East African nations.
Key Drivers for Kenya's Dominance:
- Stronger economic growth compared to regional peers.
- Relatively well-developed infrastructure facilitating distribution.
- Higher per capita energy consumption rates.
The transportation segment dominates end-user demand, driven by the increasing number of vehicles and growth in freight transport. The industrial sector is another significant consumer, particularly in manufacturing and power generation.
East Africa Downstream Oil and Gas Industry Product Developments
Recent product innovations include the introduction of higher-quality lubricants with improved performance characteristics and the development of cleaner-burning fuels to meet stringent environmental regulations. These innovations enhance operational efficiency, reduce emissions, and improve product competitiveness. The market is seeing a gradual shift towards environmentally sustainable options.
Report Scope & Segmentation Analysis
This report segments the East African downstream oil and gas market based on product type (refined petroleum products, lubricants, petrochemicals, LPG) and end-user segment (industrial, transportation, commercial, household). Growth projections, market sizes, and competitive dynamics are analyzed for each segment. The refined petroleum products segment is expected to witness the highest growth due to increasing transportation and industrial activities. The lubricants segment is expected to experience steady growth, driven by the demand for high-performance lubricants in various industries. Petrochemicals and LPG segments are also showing promising growth, driven by industrial development and household consumption.
Key Drivers of East Africa Downstream Oil and Gas Industry Growth
Growth in the East African downstream oil and gas industry is driven by several factors, including rising energy demand fueled by population growth and economic expansion. Increased urbanization and motorization significantly contribute to higher transportation fuel consumption. Government initiatives to improve infrastructure and boost industrial activity also stimulate demand. Technological advancements, such as the adoption of digitalization and automation in refining processes, enhance efficiency and productivity.
Challenges in the East Africa Downstream Oil and Gas Industry Sector
The industry faces several challenges, including volatile crude oil prices and geopolitical uncertainties that impact supply and cost. Infrastructure limitations, particularly in some regions, hinder efficient distribution. Stringent environmental regulations impose compliance costs, and competition among players can lead to price wars, affecting profitability. The lack of skilled labor and technological limitations also pose significant challenges.
Emerging Opportunities in East Africa Downstream Oil and Gas Industry
The East African downstream oil and gas sector offers several emerging opportunities. The increasing adoption of cleaner fuels and biofuels presents a growth avenue. Investments in infrastructure development and the expansion of the refining capacity will open new markets. The growing middle class and increasing disposable income contribute to rising energy consumption. Moreover, government support for energy security initiatives creates a favorable environment for investments.
Leading Players in the East Africa Downstream Oil and Gas Industry Market
- China National Petroleum Corporation
- Eni SpA
- Royal Dutch Shell PLC
- Sudan National Petroleum Corporation
- Petrogal SA
- Kenya Petroleum Refineries Ltd (KPRL)
- Total Energies Marketing Kenya
- Shell Kenya
- National Oil Corporation of Kenya (NOCK)
- Oil Libya (Tamoil)
Key Developments in East Africa Downstream Oil and Gas Industry Industry
- December 2022: Savannah Energy acquires producing oil fields in South Sudan from Petronas for USD 1.25 Billion, involving China National Petroleum Corporation, Oil and Natural Gas Corporation (India), and Nilepet (South Sudan). This acquisition significantly reshapes the South Sudanese oil sector and demonstrates investor confidence.
Strategic Outlook for East Africa Downstream Oil and Gas Industry Market
The East African downstream oil and gas market exhibits significant growth potential. Continued economic expansion, population growth, and urbanization will drive energy demand. Strategic investments in infrastructure development and capacity expansion are crucial. Adopting cleaner technologies and sustainable practices will improve industry competitiveness and meet evolving environmental concerns. This presents lucrative opportunities for both established and new players in the market.
East Africa Downstream Oil and Gas Industry Segmentation
- 1. Refineries
- 2. Petrochemicals Plants
-
3. Geography
- 3.1. Mozambique
- 3.2. South Sudan
- 3.3. Kenya
- 3.4. Rest of East Africa
East Africa Downstream Oil and Gas Industry Segmentation By Geography
- 1. Mozambique
- 2. South Sudan
- 3. Kenya
- 4. Rest of East Africa
East Africa Downstream Oil and Gas Industry REPORT HIGHLIGHTS
| Aspects | Details |
|---|---|
| Study Period | 2019-2033 |
| Base Year | 2024 |
| Estimated Year | 2025 |
| Forecast Period | 2025-2033 |
| Historical Period | 2019-2024 |
| Growth Rate | CAGR of > 2.32% from 2019-2033 |
| Segmentation |
|
Table of Contents
- 1. Introduction
- 1.1. Research Scope
- 1.2. Market Segmentation
- 1.3. Research Methodology
- 1.4. Definitions and Assumptions
- 2. Executive Summary
- 2.1. Introduction
- 3. Market Dynamics
- 3.1. Introduction
- 3.2. Market Drivers
- 3.2.1. 4.; Increasing Electricity Demand4.; Rsing Investments in the Coal Industry
- 3.3. Market Restrains
- 3.3.1. 4.; Increasing Installation of Renewable Energy Sources
- 3.4. Market Trends
- 3.4.1. Refinery Capacity to Witness growth
- 4. Market Factor Analysis
- 4.1. Porters Five Forces
- 4.2. Supply/Value Chain
- 4.3. PESTEL analysis
- 4.4. Market Entropy
- 4.5. Patent/Trademark Analysis
- 5. East Africa Downstream Oil and Gas Industry Analysis, Insights and Forecast, 2019-2031
- 5.1. Market Analysis, Insights and Forecast - by Refineries
- 5.2. Market Analysis, Insights and Forecast - by Petrochemicals Plants
- 5.3. Market Analysis, Insights and Forecast - by Geography
- 5.3.1. Mozambique
- 5.3.2. South Sudan
- 5.3.3. Kenya
- 5.3.4. Rest of East Africa
- 5.4. Market Analysis, Insights and Forecast - by Region
- 5.4.1. Mozambique
- 5.4.2. South Sudan
- 5.4.3. Kenya
- 5.4.4. Rest of East Africa
- 5.1. Market Analysis, Insights and Forecast - by Refineries
- 6. Mozambique East Africa Downstream Oil and Gas Industry Analysis, Insights and Forecast, 2019-2031
- 6.1. Market Analysis, Insights and Forecast - by Refineries
- 6.2. Market Analysis, Insights and Forecast - by Petrochemicals Plants
- 6.3. Market Analysis, Insights and Forecast - by Geography
- 6.3.1. Mozambique
- 6.3.2. South Sudan
- 6.3.3. Kenya
- 6.3.4. Rest of East Africa
- 6.1. Market Analysis, Insights and Forecast - by Refineries
- 7. South Sudan East Africa Downstream Oil and Gas Industry Analysis, Insights and Forecast, 2019-2031
- 7.1. Market Analysis, Insights and Forecast - by Refineries
- 7.2. Market Analysis, Insights and Forecast - by Petrochemicals Plants
- 7.3. Market Analysis, Insights and Forecast - by Geography
- 7.3.1. Mozambique
- 7.3.2. South Sudan
- 7.3.3. Kenya
- 7.3.4. Rest of East Africa
- 7.1. Market Analysis, Insights and Forecast - by Refineries
- 8. Kenya East Africa Downstream Oil and Gas Industry Analysis, Insights and Forecast, 2019-2031
- 8.1. Market Analysis, Insights and Forecast - by Refineries
- 8.2. Market Analysis, Insights and Forecast - by Petrochemicals Plants
- 8.3. Market Analysis, Insights and Forecast - by Geography
- 8.3.1. Mozambique
- 8.3.2. South Sudan
- 8.3.3. Kenya
- 8.3.4. Rest of East Africa
- 8.1. Market Analysis, Insights and Forecast - by Refineries
- 9. Rest of East Africa East Africa Downstream Oil and Gas Industry Analysis, Insights and Forecast, 2019-2031
- 9.1. Market Analysis, Insights and Forecast - by Refineries
- 9.2. Market Analysis, Insights and Forecast - by Petrochemicals Plants
- 9.3. Market Analysis, Insights and Forecast - by Geography
- 9.3.1. Mozambique
- 9.3.2. South Sudan
- 9.3.3. Kenya
- 9.3.4. Rest of East Africa
- 9.1. Market Analysis, Insights and Forecast - by Refineries
- 10. South Africa East Africa Downstream Oil and Gas Industry Analysis, Insights and Forecast, 2019-2031
- 11. Sudan East Africa Downstream Oil and Gas Industry Analysis, Insights and Forecast, 2019-2031
- 12. Uganda East Africa Downstream Oil and Gas Industry Analysis, Insights and Forecast, 2019-2031
- 13. Tanzania East Africa Downstream Oil and Gas Industry Analysis, Insights and Forecast, 2019-2031
- 14. Kenya East Africa Downstream Oil and Gas Industry Analysis, Insights and Forecast, 2019-2031
- 15. Rest of Africa East Africa Downstream Oil and Gas Industry Analysis, Insights and Forecast, 2019-2031
- 16. Competitive Analysis
- 16.1. Market Share Analysis 2024
- 16.2. Company Profiles
- 16.2.1 Sudan National Petroleum Corporation
- 16.2.1.1. Overview
- 16.2.1.2. Products
- 16.2.1.3. SWOT Analysis
- 16.2.1.4. Recent Developments
- 16.2.1.5. Financials (Based on Availability)
- 16.2.2 China National Petroleum Corporation
- 16.2.2.1. Overview
- 16.2.2.2. Products
- 16.2.2.3. SWOT Analysis
- 16.2.2.4. Recent Developments
- 16.2.2.5. Financials (Based on Availability)
- 16.2.3 Petrogal SA*List Not Exhaustive
- 16.2.3.1. Overview
- 16.2.3.2. Products
- 16.2.3.3. SWOT Analysis
- 16.2.3.4. Recent Developments
- 16.2.3.5. Financials (Based on Availability)
- 16.2.4 Royal Dutch Shell PLC
- 16.2.4.1. Overview
- 16.2.4.2. Products
- 16.2.4.3. SWOT Analysis
- 16.2.4.4. Recent Developments
- 16.2.4.5. Financials (Based on Availability)
- 16.2.5 Eni SpA
- 16.2.5.1. Overview
- 16.2.5.2. Products
- 16.2.5.3. SWOT Analysis
- 16.2.5.4. Recent Developments
- 16.2.5.5. Financials (Based on Availability)
- 16.2.6 Kenya Petroleum Refineries Ltd (KPRL)
- 16.2.6.1. Overview
- 16.2.6.2. Products
- 16.2.6.3. SWOT Analysis
- 16.2.6.4. Recent Developments
- 16.2.6.5. Financials (Based on Availability)
- 16.2.7 Total Energies Marketing Kenya
- 16.2.7.1. Overview
- 16.2.7.2. Products
- 16.2.7.3. SWOT Analysis
- 16.2.7.4. Recent Developments
- 16.2.7.5. Financials (Based on Availability)
- 16.2.8 Shell Kenya
- 16.2.8.1. Overview
- 16.2.8.2. Products
- 16.2.8.3. SWOT Analysis
- 16.2.8.4. Recent Developments
- 16.2.8.5. Financials (Based on Availability)
- 16.2.9 National Oil Corporation of Kenya (NOCK)
- 16.2.9.1. Overview
- 16.2.9.2. Products
- 16.2.9.3. SWOT Analysis
- 16.2.9.4. Recent Developments
- 16.2.9.5. Financials (Based on Availability)
- 16.2.10 Oil Libya (Tamoil)
- 16.2.10.1. Overview
- 16.2.10.2. Products
- 16.2.10.3. SWOT Analysis
- 16.2.10.4. Recent Developments
- 16.2.10.5. Financials (Based on Availability)
- 16.2.1 Sudan National Petroleum Corporation
List of Figures
- Figure 1: East Africa Downstream Oil and Gas Industry Revenue Breakdown (Million, %) by Product 2024 & 2032
- Figure 2: East Africa Downstream Oil and Gas Industry Share (%) by Company 2024
List of Tables
- Table 1: East Africa Downstream Oil and Gas Industry Revenue Million Forecast, by Region 2019 & 2032
- Table 2: East Africa Downstream Oil and Gas Industry Volume liter Forecast, by Region 2019 & 2032
- Table 3: East Africa Downstream Oil and Gas Industry Revenue Million Forecast, by Refineries 2019 & 2032
- Table 4: East Africa Downstream Oil and Gas Industry Volume liter Forecast, by Refineries 2019 & 2032
- Table 5: East Africa Downstream Oil and Gas Industry Revenue Million Forecast, by Petrochemicals Plants 2019 & 2032
- Table 6: East Africa Downstream Oil and Gas Industry Volume liter Forecast, by Petrochemicals Plants 2019 & 2032
- Table 7: East Africa Downstream Oil and Gas Industry Revenue Million Forecast, by Geography 2019 & 2032
- Table 8: East Africa Downstream Oil and Gas Industry Volume liter Forecast, by Geography 2019 & 2032
- Table 9: East Africa Downstream Oil and Gas Industry Revenue Million Forecast, by Region 2019 & 2032
- Table 10: East Africa Downstream Oil and Gas Industry Volume liter Forecast, by Region 2019 & 2032
- Table 11: East Africa Downstream Oil and Gas Industry Revenue Million Forecast, by Country 2019 & 2032
- Table 12: East Africa Downstream Oil and Gas Industry Volume liter Forecast, by Country 2019 & 2032
- Table 13: South Africa East Africa Downstream Oil and Gas Industry Revenue (Million) Forecast, by Application 2019 & 2032
- Table 14: South Africa East Africa Downstream Oil and Gas Industry Volume (liter ) Forecast, by Application 2019 & 2032
- Table 15: Sudan East Africa Downstream Oil and Gas Industry Revenue (Million) Forecast, by Application 2019 & 2032
- Table 16: Sudan East Africa Downstream Oil and Gas Industry Volume (liter ) Forecast, by Application 2019 & 2032
- Table 17: Uganda East Africa Downstream Oil and Gas Industry Revenue (Million) Forecast, by Application 2019 & 2032
- Table 18: Uganda East Africa Downstream Oil and Gas Industry Volume (liter ) Forecast, by Application 2019 & 2032
- Table 19: Tanzania East Africa Downstream Oil and Gas Industry Revenue (Million) Forecast, by Application 2019 & 2032
- Table 20: Tanzania East Africa Downstream Oil and Gas Industry Volume (liter ) Forecast, by Application 2019 & 2032
- Table 21: Kenya East Africa Downstream Oil and Gas Industry Revenue (Million) Forecast, by Application 2019 & 2032
- Table 22: Kenya East Africa Downstream Oil and Gas Industry Volume (liter ) Forecast, by Application 2019 & 2032
- Table 23: Rest of Africa East Africa Downstream Oil and Gas Industry Revenue (Million) Forecast, by Application 2019 & 2032
- Table 24: Rest of Africa East Africa Downstream Oil and Gas Industry Volume (liter ) Forecast, by Application 2019 & 2032
- Table 25: East Africa Downstream Oil and Gas Industry Revenue Million Forecast, by Refineries 2019 & 2032
- Table 26: East Africa Downstream Oil and Gas Industry Volume liter Forecast, by Refineries 2019 & 2032
- Table 27: East Africa Downstream Oil and Gas Industry Revenue Million Forecast, by Petrochemicals Plants 2019 & 2032
- Table 28: East Africa Downstream Oil and Gas Industry Volume liter Forecast, by Petrochemicals Plants 2019 & 2032
- Table 29: East Africa Downstream Oil and Gas Industry Revenue Million Forecast, by Geography 2019 & 2032
- Table 30: East Africa Downstream Oil and Gas Industry Volume liter Forecast, by Geography 2019 & 2032
- Table 31: East Africa Downstream Oil and Gas Industry Revenue Million Forecast, by Country 2019 & 2032
- Table 32: East Africa Downstream Oil and Gas Industry Volume liter Forecast, by Country 2019 & 2032
- Table 33: East Africa Downstream Oil and Gas Industry Revenue Million Forecast, by Refineries 2019 & 2032
- Table 34: East Africa Downstream Oil and Gas Industry Volume liter Forecast, by Refineries 2019 & 2032
- Table 35: East Africa Downstream Oil and Gas Industry Revenue Million Forecast, by Petrochemicals Plants 2019 & 2032
- Table 36: East Africa Downstream Oil and Gas Industry Volume liter Forecast, by Petrochemicals Plants 2019 & 2032
- Table 37: East Africa Downstream Oil and Gas Industry Revenue Million Forecast, by Geography 2019 & 2032
- Table 38: East Africa Downstream Oil and Gas Industry Volume liter Forecast, by Geography 2019 & 2032
- Table 39: East Africa Downstream Oil and Gas Industry Revenue Million Forecast, by Country 2019 & 2032
- Table 40: East Africa Downstream Oil and Gas Industry Volume liter Forecast, by Country 2019 & 2032
- Table 41: East Africa Downstream Oil and Gas Industry Revenue Million Forecast, by Refineries 2019 & 2032
- Table 42: East Africa Downstream Oil and Gas Industry Volume liter Forecast, by Refineries 2019 & 2032
- Table 43: East Africa Downstream Oil and Gas Industry Revenue Million Forecast, by Petrochemicals Plants 2019 & 2032
- Table 44: East Africa Downstream Oil and Gas Industry Volume liter Forecast, by Petrochemicals Plants 2019 & 2032
- Table 45: East Africa Downstream Oil and Gas Industry Revenue Million Forecast, by Geography 2019 & 2032
- Table 46: East Africa Downstream Oil and Gas Industry Volume liter Forecast, by Geography 2019 & 2032
- Table 47: East Africa Downstream Oil and Gas Industry Revenue Million Forecast, by Country 2019 & 2032
- Table 48: East Africa Downstream Oil and Gas Industry Volume liter Forecast, by Country 2019 & 2032
- Table 49: East Africa Downstream Oil and Gas Industry Revenue Million Forecast, by Refineries 2019 & 2032
- Table 50: East Africa Downstream Oil and Gas Industry Volume liter Forecast, by Refineries 2019 & 2032
- Table 51: East Africa Downstream Oil and Gas Industry Revenue Million Forecast, by Petrochemicals Plants 2019 & 2032
- Table 52: East Africa Downstream Oil and Gas Industry Volume liter Forecast, by Petrochemicals Plants 2019 & 2032
- Table 53: East Africa Downstream Oil and Gas Industry Revenue Million Forecast, by Geography 2019 & 2032
- Table 54: East Africa Downstream Oil and Gas Industry Volume liter Forecast, by Geography 2019 & 2032
- Table 55: East Africa Downstream Oil and Gas Industry Revenue Million Forecast, by Country 2019 & 2032
- Table 56: East Africa Downstream Oil and Gas Industry Volume liter Forecast, by Country 2019 & 2032
Frequently Asked Questions
1. What is the projected Compound Annual Growth Rate (CAGR) of the East Africa Downstream Oil and Gas Industry?
The projected CAGR is approximately > 2.32%.
2. Which companies are prominent players in the East Africa Downstream Oil and Gas Industry?
Key companies in the market include Sudan National Petroleum Corporation, China National Petroleum Corporation, Petrogal SA*List Not Exhaustive, Royal Dutch Shell PLC, Eni SpA, Kenya Petroleum Refineries Ltd (KPRL) , Total Energies Marketing Kenya , Shell Kenya , National Oil Corporation of Kenya (NOCK) , Oil Libya (Tamoil).
3. What are the main segments of the East Africa Downstream Oil and Gas Industry?
The market segments include Refineries, Petrochemicals Plants, Geography.
4. Can you provide details about the market size?
The market size is estimated to be USD 17500 Million as of 2022.
5. What are some drivers contributing to market growth?
4.; Increasing Electricity Demand4.; Rsing Investments in the Coal Industry.
6. What are the notable trends driving market growth?
Refinery Capacity to Witness growth.
7. Are there any restraints impacting market growth?
4.; Increasing Installation of Renewable Energy Sources.
8. Can you provide examples of recent developments in the market?
In December 2022, Savannah Energy declared the acquisition of producing oil fields in South Sudan from Malaysian state oil and gas company Petronas. The investment is valued at USD 1.25 billion. The other partners include the international energy company, the China National Petroleum Corporation, India's flagship energy major, the Oil and Natural Gas Corporation, and South Sudan's national oil and gas company, Nilepet.
9. What pricing options are available for accessing the report?
Pricing options include single-user, multi-user, and enterprise licenses priced at USD 4750, USD 5250, and USD 8750 respectively.
10. Is the market size provided in terms of value or volume?
The market size is provided in terms of value, measured in Million and volume, measured in liter .
11. Are there any specific market keywords associated with the report?
Yes, the market keyword associated with the report is "East Africa Downstream Oil and Gas Industry," which aids in identifying and referencing the specific market segment covered.
12. How do I determine which pricing option suits my needs best?
The pricing options vary based on user requirements and access needs. Individual users may opt for single-user licenses, while businesses requiring broader access may choose multi-user or enterprise licenses for cost-effective access to the report.
13. Are there any additional resources or data provided in the East Africa Downstream Oil and Gas Industry report?
While the report offers comprehensive insights, it's advisable to review the specific contents or supplementary materials provided to ascertain if additional resources or data are available.
14. How can I stay updated on further developments or reports in the East Africa Downstream Oil and Gas Industry?
To stay informed about further developments, trends, and reports in the East Africa Downstream Oil and Gas Industry, consider subscribing to industry newsletters, following relevant companies and organizations, or regularly checking reputable industry news sources and publications.
Methodology
Step 1 - Identification of Relevant Samples Size from Population Database


Step 2 - Approaches for Defining Global Market Size (Value, Volume* & Price*)

Note*: In applicable scenarios
Step 3 - Data Sources
Primary Research
- Web Analytics
- Survey Reports
- Research Institute
- Latest Research Reports
- Opinion Leaders
Secondary Research
- Annual Reports
- White Paper
- Latest Press Release
- Industry Association
- Paid Database
- Investor Presentations

Step 4 - Data Triangulation
Involves using different sources of information in order to increase the validity of a study
These sources are likely to be stakeholders in a program - participants, other researchers, program staff, other community members, and so on.
Then we put all data in single framework & apply various statistical tools to find out the dynamic on the market.
During the analysis stage, feedback from the stakeholder groups would be compared to determine areas of agreement as well as areas of divergence


