

Key Insights
The Electrochromic Materials market is experiencing robust growth, projected to maintain a Compound Annual Growth Rate (CAGR) exceeding 8% from 2025 to 2033. This expansion is driven by increasing demand for energy-efficient smart windows and buildings, growing adoption of electrochromic technology in automotive applications (e.g., dimming mirrors and sunroofs), and the rising popularity of smart devices incorporating electrochromic displays. Key market players such as Changzhou Yapu Smart Variable Color Optics, ChromoGenics, and Gentex Corporation are actively contributing to market growth through continuous innovation and product diversification. The market is segmented by application (automotive, architectural, consumer electronics), material type (tungsten oxide, nickel oxide, etc.), and geography. The architectural segment is expected to dominate due to stringent energy efficiency regulations and rising awareness of sustainability. The automotive sector is also showing strong potential for growth, driven by the increasing integration of advanced driver-assistance systems (ADAS) and improved in-car comfort features.
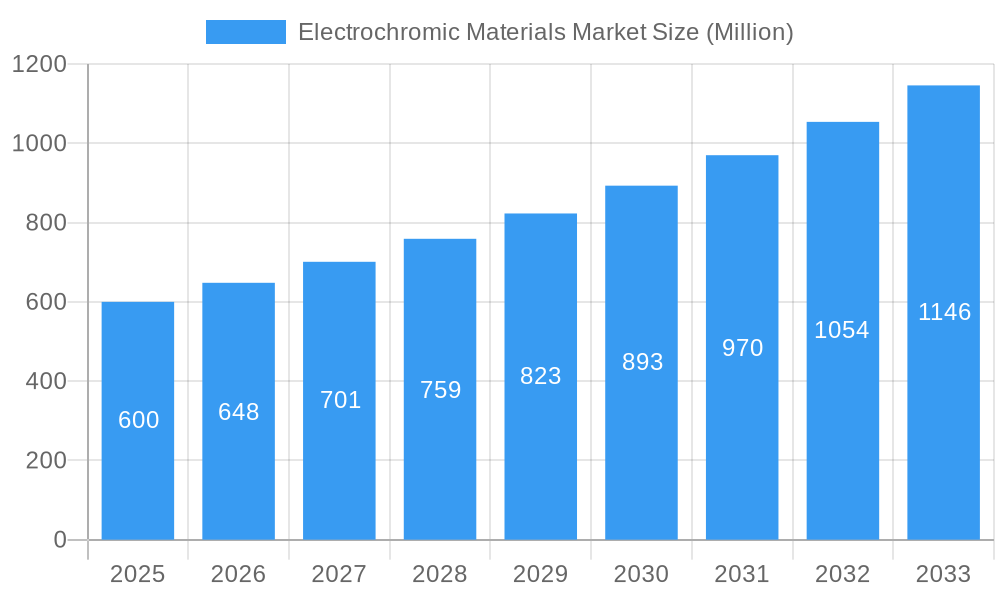
Electrochromic Materials Market Market Size (In Million)
Market restraints include the relatively high initial cost of electrochromic materials compared to traditional alternatives and the need for further technological advancements to improve durability and longevity. However, ongoing research and development efforts aimed at enhancing the performance and reducing the cost of electrochromic materials are expected to mitigate these challenges. The market is geographically diverse, with significant contributions from North America, Europe, and Asia-Pacific. The Asia-Pacific region is anticipated to witness faster growth due to rapid urbanization, industrialization, and increased investment in infrastructure projects featuring smart buildings. While precise market sizing data for 2025 is unavailable, given a CAGR >8% and a mentioned study period from 2019-2033, a reasonable estimation of the 2025 market size could be in the range of $500 million to $700 million, based on extrapolation from publicly available data and industry reports on similar technologies. This would then enable projections into the future based on the projected CAGR.
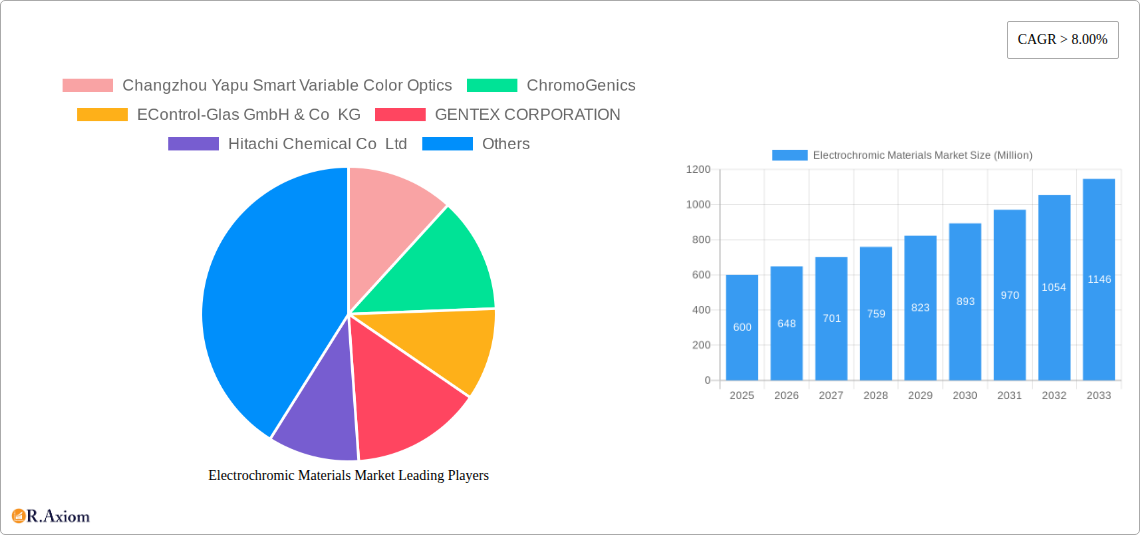
Electrochromic Materials Market Company Market Share
Electrochromic Materials Market: A Comprehensive Report (2019-2033)
This in-depth report provides a comprehensive analysis of the Electrochromic Materials market, offering valuable insights for stakeholders seeking to understand its current dynamics and future trajectory. The study covers the period from 2019 to 2033, with 2025 serving as the base and estimated year. The report utilizes rigorous data analysis and expert insights to deliver actionable intelligence, helping businesses make informed decisions and capitalize on emerging opportunities.
Electrochromic Materials Market Concentration & Innovation
The Electrochromic Materials market exhibits a moderately concentrated landscape, with a handful of key players holding significant market share. While precise market share figures for individual companies are proprietary data and not publicly disclosed, the market is estimated to be dominated by a few major companies, with smaller players specializing in niche segments. Innovation is a key driver, with continuous research and development efforts focused on enhancing material efficiency, durability, and cost-effectiveness. Regulatory frameworks, particularly those concerning energy efficiency and environmental sustainability, play a crucial role in shaping market growth. Product substitutes, such as traditional window coatings, face increasing competitive pressure from electrochromic materials due to their superior energy-saving capabilities. End-user trends, particularly a growing preference for smart buildings and sustainable technologies, fuel market expansion. Mergers and acquisitions (M&A) activity has been moderate, with deal values varying depending on the size and strategic importance of the acquired companies. For instance, in 2022, a xx Million deal resulted in significant market consolidation within a specific niche, whereas the overall annual M&A value in the sector has fluctuated between xx Million and xx Million over the past five years.
- High Concentration: A few dominant players hold significant market share.
- Innovation Drivers: R&D focusing on improved efficiency, durability, and cost reduction.
- Regulatory Impact: Energy efficiency standards drive market adoption.
- Product Substitution: Electrochromic materials are increasingly replacing traditional alternatives.
- M&A Activity: Moderate levels of consolidation through acquisitions.
Electrochromic Materials Market Industry Trends & Insights
The Electrochromic Materials market is projected to experience robust growth throughout the forecast period (2025-2033), with a compound annual growth rate (CAGR) estimated at xx%. This growth is propelled by several key factors. Technological advancements, such as the development of more efficient and durable electrochromic materials, are significantly reducing production costs and expanding potential applications. The rising demand for energy-efficient buildings, driven by increasing environmental awareness and stringent building codes, is a major catalyst. Consumer preferences are shifting towards smart homes and buildings, further boosting market demand. However, competitive dynamics remain complex, with established players facing pressure from new entrants offering innovative solutions and competitive pricing. Market penetration in key segments like automotive and architectural applications continues to grow, with an estimated xx% penetration rate in the automotive sector by 2033.
Dominant Markets & Segments in Electrochromic Materials Market
The North American region currently holds a dominant position in the global Electrochromic Materials market, fueled by strong demand from the construction and automotive industries, with a market size of xx Million in 2025.
- Key Drivers in North America:
- Stringent energy efficiency regulations.
- Robust construction and automotive sectors.
- High consumer adoption of smart building technologies.
- Dominance Analysis: North America's early adoption of electrochromic technology and strong R&D infrastructure contribute to its market leadership. Government incentives and tax breaks for sustainable building technologies also contribute to the high demand. However, Asia Pacific is expected to demonstrate significant growth in the coming years, driven by increasing infrastructure development and government support for energy-efficient projects. Europe follows closely behind with a steadily growing market driven by environmentally-conscious policies and strong consumer awareness.
Electrochromic Materials Market Product Developments
Recent product innovations have focused on enhancing the performance and durability of electrochromic materials. New formulations offer improved switching speeds, wider color ranges, and enhanced transparency control. These advancements expand the range of potential applications, including automotive sunroofs, smart windows in buildings, and electronic displays. The integration of electrochromic technology with other smart building systems is also gaining traction, leading to the development of more integrated and user-friendly solutions. This improved functionality contributes to a strong competitive advantage, creating higher market value and capturing a larger market share for innovators.
Report Scope & Segmentation Analysis
The report segments the Electrochromic Materials market based on material type (Tungsten Oxide, Nickel Oxide, etc.), application (automotive, architectural, consumer electronics), and geography. Each segment's growth projections and competitive landscape are extensively analyzed, providing a granular view of the market. For example, the automotive segment is expected to showcase significant growth driven by the increasing demand for energy-efficient vehicles and advanced driver-assistance systems. The architectural segment, benefiting from heightened energy-efficiency standards, anticipates steady growth, while the consumer electronics segment, though smaller, presents lucrative opportunities for niche applications. The overall market size is projected to reach xx Million by 2033, with significant variations across segments based on their specific growth drivers and competitive dynamics.
Key Drivers of Electrochromic Materials Market Growth
Several key factors propel the growth of the Electrochromic Materials market. The increasing demand for energy-efficient buildings and vehicles is a primary driver. Government regulations and incentives supporting sustainable technologies further enhance market adoption. Technological advancements resulting in lower production costs and improved material performance also contribute significantly. For instance, the development of new, more efficient electrochromic materials has expanded their applicability beyond traditional uses, fostering growth in the consumer electronics sector. Finally, growing consumer awareness of energy conservation and environmental sustainability fuels market expansion.
Challenges in the Electrochromic Materials Market Sector
Despite the market's growth potential, several challenges persist. High initial investment costs for electrochromic technologies can hinder adoption, particularly in developing economies. The supply chain for raw materials can be complex and susceptible to disruptions, potentially impacting production costs and delivery timelines. Furthermore, competition from established window and coating technologies presents an ongoing challenge. The overall impact of these challenges is estimated to reduce the CAGR by approximately xx% over the forecast period, highlighting the need for strategic adaptation and innovation within the industry.
Emerging Opportunities in Electrochromic Materials Market
Significant opportunities exist in untapped market segments. The integration of electrochromic technology with other smart building systems promises to create new revenue streams and expand market penetration. The development of flexible and transparent electrochromic materials opens doors to novel applications in wearable electronics and other advanced technologies. Furthermore, growing demand for energy-efficient solutions in developing nations presents a significant growth opportunity for Electrochromic Materials manufacturers. Specifically, the focus on sustainable infrastructure development in these regions will create a significant increase in demand, driving market expansion.
Leading Players in the Electrochromic Materials Market Market
- Changzhou Yapu Smart Variable Color Optics
- ChromoGenics
- EControl-Glas GmbH & Co KG
- GENTEX CORPORATION
- Hitachi Chemical Co Ltd
- Nikon Corporation
- Ningbo Miro Electronic Technology
- Ricoh
- Saint-Gobain
- View Inc
- Zhuhai Kaivo Optoelectronic Technology
- Zhuzhou Kibing Group
Key Developments in Electrochromic Materials Market Industry
- Q1 2023: Chromogenics announced a significant new contract for the supply of electrochromic windows to a major commercial building project.
- Q3 2022: A major automotive manufacturer partnered with View Inc to integrate electrochromic technology into its new luxury vehicle line.
- Q4 2021: Saint-Gobain unveiled a new generation of electrochromic glass with enhanced performance characteristics.
Strategic Outlook for Electrochromic Materials Market Market
The Electrochromic Materials market is poised for significant growth in the coming years, driven by continuous technological advancements, increasing demand for energy-efficient solutions, and supportive government policies. The expanding range of applications, from automotive and architectural to consumer electronics, presents numerous growth opportunities. Companies focusing on innovation, strategic partnerships, and expanding their geographic reach are best positioned to capitalize on this market's potential. Furthermore, the integration of electrochromic technology into smart home and building automation systems will be a key trend driving market expansion and creating new revenue streams for industry players.
Electrochromic Materials Market Segmentation
-
1. Product Type
- 1.1. Viologens
- 1.2. Conducting Polymers
- 1.3. Metal Oxides
- 1.4. Prussian Blue
- 1.5. Other Product Types
-
2. End-user Industry
- 2.1. Automotive
- 2.2. Electrical and Electronics
- 2.3. Building and Construction
- 2.4. Aerospace and Defense
- 2.5. Other End-user Industries
Electrochromic Materials Market Segmentation By Geography
-
1. Asia Pacific
- 1.1. China
- 1.2. India
- 1.3. Japan
- 1.4. South Korea
- 1.5. Rest of Asia Pacific
-
2. North America
- 2.1. United States
- 2.2. Canada
- 2.3. Mexico
-
3. Europe
- 3.1. Germany
- 3.2. United Kingdom
- 3.3. Italy
- 3.4. France
- 3.5. Rest of Europe
-
4. South America
- 4.1. Brazil
- 4.2. Argentina
- 4.3. Rest of South America
-
5. Middle East and Africa
- 5.1. Saudi Arabia
- 5.2. South Africa
- 5.3. Rest of Middle East and Africa

Electrochromic Materials Market Regional Market Share
Geographic Coverage of Electrochromic Materials Market
Electrochromic Materials Market REPORT HIGHLIGHTS
| Aspects | Details |
|---|---|
| Study Period | 2020-2034 |
| Base Year | 2025 |
| Estimated Year | 2026 |
| Forecast Period | 2026-2034 |
| Historical Period | 2020-2025 |
| Growth Rate | CAGR of 10.5% from 2020-2034 |
| Segmentation |
|
Table of Contents
- 1. Introduction
- 1.1. Research Scope
- 1.2. Market Segmentation
- 1.3. Research Objective
- 1.4. Definitions and Assumptions
- 2. Executive Summary
- 2.1. Market Snapshot
- 3. Market Dynamics
- 3.1. Market Drivers
- 3.2. Market Restrains
- 3.3. Market Trends
- 3.4. Market Opportunities
- 4. Market Factor Analysis
- 4.1. Porters Five Forces
- 4.1.1. Bargaining Power of Suppliers
- 4.1.2. Bargaining Power of Buyers
- 4.1.3. Threat of New Entrants
- 4.1.4. Threat of Substitutes
- 4.1.5. Competitive Rivalry
- 4.2. PESTEL analysis
- 4.3. BCG Analysis
- 4.3.1. Stars (High Growth, High Market Share)
- 4.3.2. Cash Cows (Low Growth, High Market Share)
- 4.3.3. Question Mark (High Growth, Low Market Share)
- 4.3.4. Dogs (Low Growth, Low Market Share)
- 4.4. Ansoff Matrix Analysis
- 4.5. Supply Chain Analysis
- 4.6. Regulatory Landscape
- 4.7. Current Market Potential and Opportunity Assessment (TAM–SAM–SOM Framework)
- 4.8. RAX Analyst Note
- 4.1. Porters Five Forces
- 5. Market Analysis, Insights and Forecast 2021-2033
- 5.1. Market Analysis, Insights and Forecast - by Product Type
- 5.1.1. Viologens
- 5.1.2. Conducting Polymers
- 5.1.3. Metal Oxides
- 5.1.4. Prussian Blue
- 5.1.5. Other Product Types
- 5.2. Market Analysis, Insights and Forecast - by End-user Industry
- 5.2.1. Automotive
- 5.2.2. Electrical and Electronics
- 5.2.3. Building and Construction
- 5.2.4. Aerospace and Defense
- 5.2.5. Other End-user Industries
- 5.3. Market Analysis, Insights and Forecast - by Region
- 5.3.1. Asia Pacific
- 5.3.2. North America
- 5.3.3. Europe
- 5.3.4. South America
- 5.3.5. Middle East and Africa
- 5.1. Market Analysis, Insights and Forecast - by Product Type
- 6. Global Electrochromic Materials Market Analysis, Insights and Forecast, 2021-2033
- 6.1. Market Analysis, Insights and Forecast - by Product Type
- 6.1.1. Viologens
- 6.1.2. Conducting Polymers
- 6.1.3. Metal Oxides
- 6.1.4. Prussian Blue
- 6.1.5. Other Product Types
- 6.2. Market Analysis, Insights and Forecast - by End-user Industry
- 6.2.1. Automotive
- 6.2.2. Electrical and Electronics
- 6.2.3. Building and Construction
- 6.2.4. Aerospace and Defense
- 6.2.5. Other End-user Industries
- 6.1. Market Analysis, Insights and Forecast - by Product Type
- 7. Asia Pacific Electrochromic Materials Market Analysis, Insights and Forecast, 2020-2032
- 7.1. Market Analysis, Insights and Forecast - by Product Type
- 7.1.1. Viologens
- 7.1.2. Conducting Polymers
- 7.1.3. Metal Oxides
- 7.1.4. Prussian Blue
- 7.1.5. Other Product Types
- 7.2. Market Analysis, Insights and Forecast - by End-user Industry
- 7.2.1. Automotive
- 7.2.2. Electrical and Electronics
- 7.2.3. Building and Construction
- 7.2.4. Aerospace and Defense
- 7.2.5. Other End-user Industries
- 7.1. Market Analysis, Insights and Forecast - by Product Type
- 8. North America Electrochromic Materials Market Analysis, Insights and Forecast, 2020-2032
- 8.1. Market Analysis, Insights and Forecast - by Product Type
- 8.1.1. Viologens
- 8.1.2. Conducting Polymers
- 8.1.3. Metal Oxides
- 8.1.4. Prussian Blue
- 8.1.5. Other Product Types
- 8.2. Market Analysis, Insights and Forecast - by End-user Industry
- 8.2.1. Automotive
- 8.2.2. Electrical and Electronics
- 8.2.3. Building and Construction
- 8.2.4. Aerospace and Defense
- 8.2.5. Other End-user Industries
- 8.1. Market Analysis, Insights and Forecast - by Product Type
- 9. Europe Electrochromic Materials Market Analysis, Insights and Forecast, 2020-2032
- 9.1. Market Analysis, Insights and Forecast - by Product Type
- 9.1.1. Viologens
- 9.1.2. Conducting Polymers
- 9.1.3. Metal Oxides
- 9.1.4. Prussian Blue
- 9.1.5. Other Product Types
- 9.2. Market Analysis, Insights and Forecast - by End-user Industry
- 9.2.1. Automotive
- 9.2.2. Electrical and Electronics
- 9.2.3. Building and Construction
- 9.2.4. Aerospace and Defense
- 9.2.5. Other End-user Industries
- 9.1. Market Analysis, Insights and Forecast - by Product Type
- 10. South America Electrochromic Materials Market Analysis, Insights and Forecast, 2020-2032
- 10.1. Market Analysis, Insights and Forecast - by Product Type
- 10.1.1. Viologens
- 10.1.2. Conducting Polymers
- 10.1.3. Metal Oxides
- 10.1.4. Prussian Blue
- 10.1.5. Other Product Types
- 10.2. Market Analysis, Insights and Forecast - by End-user Industry
- 10.2.1. Automotive
- 10.2.2. Electrical and Electronics
- 10.2.3. Building and Construction
- 10.2.4. Aerospace and Defense
- 10.2.5. Other End-user Industries
- 10.1. Market Analysis, Insights and Forecast - by Product Type
- 11. Middle East and Africa Electrochromic Materials Market Analysis, Insights and Forecast, 2020-2032
- 11.1. Market Analysis, Insights and Forecast - by Product Type
- 11.1.1. Viologens
- 11.1.2. Conducting Polymers
- 11.1.3. Metal Oxides
- 11.1.4. Prussian Blue
- 11.1.5. Other Product Types
- 11.2. Market Analysis, Insights and Forecast - by End-user Industry
- 11.2.1. Automotive
- 11.2.2. Electrical and Electronics
- 11.2.3. Building and Construction
- 11.2.4. Aerospace and Defense
- 11.2.5. Other End-user Industries
- 11.1. Market Analysis, Insights and Forecast - by Product Type
- 12. Competitive Analysis
- 12.1. Company Profiles
- 12.1.1 Changzhou Yapu Smart Variable Color Optics
- 12.1.1.1. Company Overview
- 12.1.1.2. Products
- 12.1.1.3. Company Financials
- 12.1.1.4. SWOT Analysis
- 12.1.2 ChromoGenics
- 12.1.2.1. Company Overview
- 12.1.2.2. Products
- 12.1.2.3. Company Financials
- 12.1.2.4. SWOT Analysis
- 12.1.3 EControl-Glas GmbH & Co KG
- 12.1.3.1. Company Overview
- 12.1.3.2. Products
- 12.1.3.3. Company Financials
- 12.1.3.4. SWOT Analysis
- 12.1.4 GENTEX CORPORATION
- 12.1.4.1. Company Overview
- 12.1.4.2. Products
- 12.1.4.3. Company Financials
- 12.1.4.4. SWOT Analysis
- 12.1.5 Hitachi Chemical Co Ltd
- 12.1.5.1. Company Overview
- 12.1.5.2. Products
- 12.1.5.3. Company Financials
- 12.1.5.4. SWOT Analysis
- 12.1.6 Nikon Corporation
- 12.1.6.1. Company Overview
- 12.1.6.2. Products
- 12.1.6.3. Company Financials
- 12.1.6.4. SWOT Analysis
- 12.1.7 Ningbo Miro Electronic Technology
- 12.1.7.1. Company Overview
- 12.1.7.2. Products
- 12.1.7.3. Company Financials
- 12.1.7.4. SWOT Analysis
- 12.1.8 Ricoh
- 12.1.8.1. Company Overview
- 12.1.8.2. Products
- 12.1.8.3. Company Financials
- 12.1.8.4. SWOT Analysis
- 12.1.9 Saint-Gobain
- 12.1.9.1. Company Overview
- 12.1.9.2. Products
- 12.1.9.3. Company Financials
- 12.1.9.4. SWOT Analysis
- 12.1.10 View Inc
- 12.1.10.1. Company Overview
- 12.1.10.2. Products
- 12.1.10.3. Company Financials
- 12.1.10.4. SWOT Analysis
- 12.1.11 Zhuhai Kaivo Optoelectronic Technology
- 12.1.11.1. Company Overview
- 12.1.11.2. Products
- 12.1.11.3. Company Financials
- 12.1.11.4. SWOT Analysis
- 12.1.12 Zhuzhou Kibing Group*List Not Exhaustive
- 12.1.12.1. Company Overview
- 12.1.12.2. Products
- 12.1.12.3. Company Financials
- 12.1.12.4. SWOT Analysis
- 12.1.1 Changzhou Yapu Smart Variable Color Optics
- 12.2. Market Entropy
- 12.2.1 Company's Key Areas Served
- 12.2.2 Recent Developments
- 12.3. Company Market Share Analysis 2025
- 12.3.1 Top 5 Companies Market Share Analysis
- 12.3.2 Top 3 Companies Market Share Analysis
- 12.4. List of Potential Customers
- 13. Research Methodology
List of Figures
- Figure 1: Global Electrochromic Materials Market Revenue Breakdown (billion, %) by Region 2025 & 2033
- Figure 2: Asia Pacific Electrochromic Materials Market Revenue (billion), by Product Type 2025 & 2033
- Figure 3: Asia Pacific Electrochromic Materials Market Revenue Share (%), by Product Type 2025 & 2033
- Figure 4: Asia Pacific Electrochromic Materials Market Revenue (billion), by End-user Industry 2025 & 2033
- Figure 5: Asia Pacific Electrochromic Materials Market Revenue Share (%), by End-user Industry 2025 & 2033
- Figure 6: Asia Pacific Electrochromic Materials Market Revenue (billion), by Country 2025 & 2033
- Figure 7: Asia Pacific Electrochromic Materials Market Revenue Share (%), by Country 2025 & 2033
- Figure 8: North America Electrochromic Materials Market Revenue (billion), by Product Type 2025 & 2033
- Figure 9: North America Electrochromic Materials Market Revenue Share (%), by Product Type 2025 & 2033
- Figure 10: North America Electrochromic Materials Market Revenue (billion), by End-user Industry 2025 & 2033
- Figure 11: North America Electrochromic Materials Market Revenue Share (%), by End-user Industry 2025 & 2033
- Figure 12: North America Electrochromic Materials Market Revenue (billion), by Country 2025 & 2033
- Figure 13: North America Electrochromic Materials Market Revenue Share (%), by Country 2025 & 2033
- Figure 14: Europe Electrochromic Materials Market Revenue (billion), by Product Type 2025 & 2033
- Figure 15: Europe Electrochromic Materials Market Revenue Share (%), by Product Type 2025 & 2033
- Figure 16: Europe Electrochromic Materials Market Revenue (billion), by End-user Industry 2025 & 2033
- Figure 17: Europe Electrochromic Materials Market Revenue Share (%), by End-user Industry 2025 & 2033
- Figure 18: Europe Electrochromic Materials Market Revenue (billion), by Country 2025 & 2033
- Figure 19: Europe Electrochromic Materials Market Revenue Share (%), by Country 2025 & 2033
- Figure 20: South America Electrochromic Materials Market Revenue (billion), by Product Type 2025 & 2033
- Figure 21: South America Electrochromic Materials Market Revenue Share (%), by Product Type 2025 & 2033
- Figure 22: South America Electrochromic Materials Market Revenue (billion), by End-user Industry 2025 & 2033
- Figure 23: South America Electrochromic Materials Market Revenue Share (%), by End-user Industry 2025 & 2033
- Figure 24: South America Electrochromic Materials Market Revenue (billion), by Country 2025 & 2033
- Figure 25: South America Electrochromic Materials Market Revenue Share (%), by Country 2025 & 2033
- Figure 26: Middle East and Africa Electrochromic Materials Market Revenue (billion), by Product Type 2025 & 2033
- Figure 27: Middle East and Africa Electrochromic Materials Market Revenue Share (%), by Product Type 2025 & 2033
- Figure 28: Middle East and Africa Electrochromic Materials Market Revenue (billion), by End-user Industry 2025 & 2033
- Figure 29: Middle East and Africa Electrochromic Materials Market Revenue Share (%), by End-user Industry 2025 & 2033
- Figure 30: Middle East and Africa Electrochromic Materials Market Revenue (billion), by Country 2025 & 2033
- Figure 31: Middle East and Africa Electrochromic Materials Market Revenue Share (%), by Country 2025 & 2033
List of Tables
- Table 1: Global Electrochromic Materials Market Revenue billion Forecast, by Product Type 2020 & 2033
- Table 2: Global Electrochromic Materials Market Revenue billion Forecast, by End-user Industry 2020 & 2033
- Table 3: Global Electrochromic Materials Market Revenue billion Forecast, by Region 2020 & 2033
- Table 4: Global Electrochromic Materials Market Revenue billion Forecast, by Product Type 2020 & 2033
- Table 5: Global Electrochromic Materials Market Revenue billion Forecast, by End-user Industry 2020 & 2033
- Table 6: Global Electrochromic Materials Market Revenue billion Forecast, by Country 2020 & 2033
- Table 7: China Electrochromic Materials Market Revenue (billion) Forecast, by Application 2020 & 2033
- Table 8: India Electrochromic Materials Market Revenue (billion) Forecast, by Application 2020 & 2033
- Table 9: Japan Electrochromic Materials Market Revenue (billion) Forecast, by Application 2020 & 2033
- Table 10: South Korea Electrochromic Materials Market Revenue (billion) Forecast, by Application 2020 & 2033
- Table 11: Rest of Asia Pacific Electrochromic Materials Market Revenue (billion) Forecast, by Application 2020 & 2033
- Table 12: Global Electrochromic Materials Market Revenue billion Forecast, by Product Type 2020 & 2033
- Table 13: Global Electrochromic Materials Market Revenue billion Forecast, by End-user Industry 2020 & 2033
- Table 14: Global Electrochromic Materials Market Revenue billion Forecast, by Country 2020 & 2033
- Table 15: United States Electrochromic Materials Market Revenue (billion) Forecast, by Application 2020 & 2033
- Table 16: Canada Electrochromic Materials Market Revenue (billion) Forecast, by Application 2020 & 2033
- Table 17: Mexico Electrochromic Materials Market Revenue (billion) Forecast, by Application 2020 & 2033
- Table 18: Global Electrochromic Materials Market Revenue billion Forecast, by Product Type 2020 & 2033
- Table 19: Global Electrochromic Materials Market Revenue billion Forecast, by End-user Industry 2020 & 2033
- Table 20: Global Electrochromic Materials Market Revenue billion Forecast, by Country 2020 & 2033
- Table 21: Germany Electrochromic Materials Market Revenue (billion) Forecast, by Application 2020 & 2033
- Table 22: United Kingdom Electrochromic Materials Market Revenue (billion) Forecast, by Application 2020 & 2033
- Table 23: Italy Electrochromic Materials Market Revenue (billion) Forecast, by Application 2020 & 2033
- Table 24: France Electrochromic Materials Market Revenue (billion) Forecast, by Application 2020 & 2033
- Table 25: Rest of Europe Electrochromic Materials Market Revenue (billion) Forecast, by Application 2020 & 2033
- Table 26: Global Electrochromic Materials Market Revenue billion Forecast, by Product Type 2020 & 2033
- Table 27: Global Electrochromic Materials Market Revenue billion Forecast, by End-user Industry 2020 & 2033
- Table 28: Global Electrochromic Materials Market Revenue billion Forecast, by Country 2020 & 2033
- Table 29: Brazil Electrochromic Materials Market Revenue (billion) Forecast, by Application 2020 & 2033
- Table 30: Argentina Electrochromic Materials Market Revenue (billion) Forecast, by Application 2020 & 2033
- Table 31: Rest of South America Electrochromic Materials Market Revenue (billion) Forecast, by Application 2020 & 2033
- Table 32: Global Electrochromic Materials Market Revenue billion Forecast, by Product Type 2020 & 2033
- Table 33: Global Electrochromic Materials Market Revenue billion Forecast, by End-user Industry 2020 & 2033
- Table 34: Global Electrochromic Materials Market Revenue billion Forecast, by Country 2020 & 2033
- Table 35: Saudi Arabia Electrochromic Materials Market Revenue (billion) Forecast, by Application 2020 & 2033
- Table 36: South Africa Electrochromic Materials Market Revenue (billion) Forecast, by Application 2020 & 2033
- Table 37: Rest of Middle East and Africa Electrochromic Materials Market Revenue (billion) Forecast, by Application 2020 & 2033
Frequently Asked Questions
1. What is the projected Compound Annual Growth Rate (CAGR) of the Electrochromic Materials Market?
The projected CAGR is approximately 10.5%.
2. Which companies are prominent players in the Electrochromic Materials Market?
Key companies in the market include Changzhou Yapu Smart Variable Color Optics, ChromoGenics, EControl-Glas GmbH & Co KG, GENTEX CORPORATION, Hitachi Chemical Co Ltd, Nikon Corporation, Ningbo Miro Electronic Technology, Ricoh, Saint-Gobain, View Inc, Zhuhai Kaivo Optoelectronic Technology, Zhuzhou Kibing Group*List Not Exhaustive.
3. What are the main segments of the Electrochromic Materials Market?
The market segments include Product Type, End-user Industry.
4. Can you provide details about the market size?
The market size is estimated to be USD 2.3 billion as of 2022.
5. What are some drivers contributing to market growth?
; Growing demand from Aerospace & Consumer Electronics; Increased Defense Spending by the Government of United States.
6. What are the notable trends driving market growth?
Increasing Usage in the Automotive Industry.
7. Are there any restraints impacting market growth?
; Growing demand from Aerospace & Consumer Electronics; Increased Defense Spending by the Government of United States.
8. Can you provide examples of recent developments in the market?
N/A
9. What pricing options are available for accessing the report?
Pricing options include single-user, multi-user, and enterprise licenses priced at USD 4750, USD 5250, and USD 8750 respectively.
10. Is the market size provided in terms of value or volume?
The market size is provided in terms of value, measured in billion.
11. Are there any specific market keywords associated with the report?
Yes, the market keyword associated with the report is "Electrochromic Materials Market," which aids in identifying and referencing the specific market segment covered.
12. How do I determine which pricing option suits my needs best?
The pricing options vary based on user requirements and access needs. Individual users may opt for single-user licenses, while businesses requiring broader access may choose multi-user or enterprise licenses for cost-effective access to the report.
13. Are there any additional resources or data provided in the Electrochromic Materials Market report?
While the report offers comprehensive insights, it's advisable to review the specific contents or supplementary materials provided to ascertain if additional resources or data are available.
14. How can I stay updated on further developments or reports in the Electrochromic Materials Market?
To stay informed about further developments, trends, and reports in the Electrochromic Materials Market, consider subscribing to industry newsletters, following relevant companies and organizations, or regularly checking reputable industry news sources and publications.
Methodology
Step 1 - Identification of Relevant Samples Size from Population Database


Step 2 - Approaches for Defining Global Market Size (Value, Volume* & Price*)

Note*: In applicable scenarios
Step 3 - Data Sources
Primary Research
- Web Analytics
- Survey Reports
- Research Institute
- Latest Research Reports
- Opinion Leaders
Secondary Research
- Annual Reports
- White Paper
- Latest Press Release
- Industry Association
- Paid Database
- Investor Presentations

Step 4 - Data Triangulation
Involves using different sources of information in order to increase the validity of a study
These sources are likely to be stakeholders in a program - participants, other researchers, program staff, other community members, and so on.
Then we put all data in single framework & apply various statistical tools to find out the dynamic on the market.
During the analysis stage, feedback from the stakeholder groups would be compared to determine areas of agreement as well as areas of divergence