
Key Insights
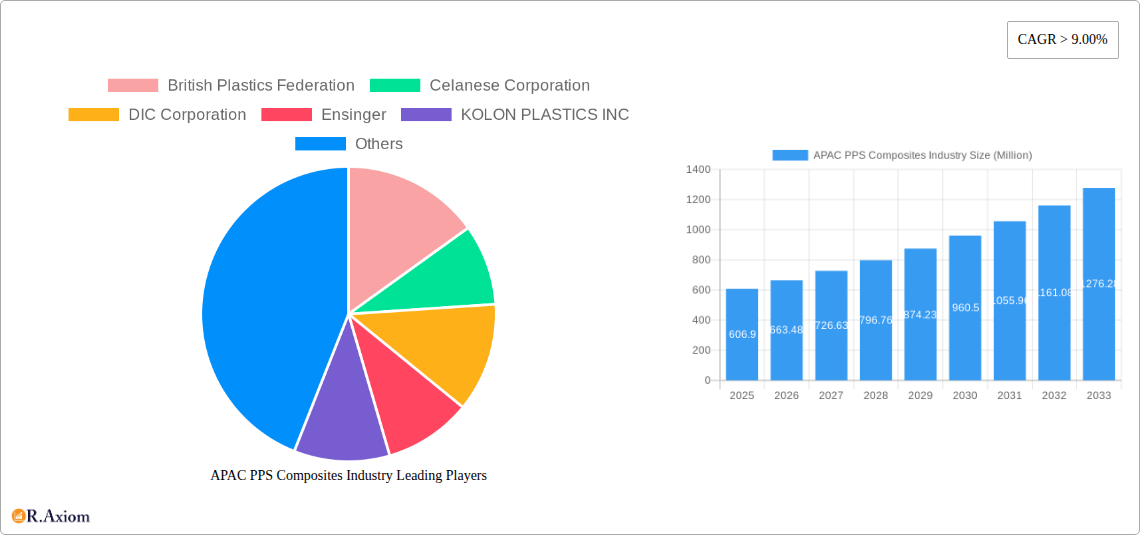
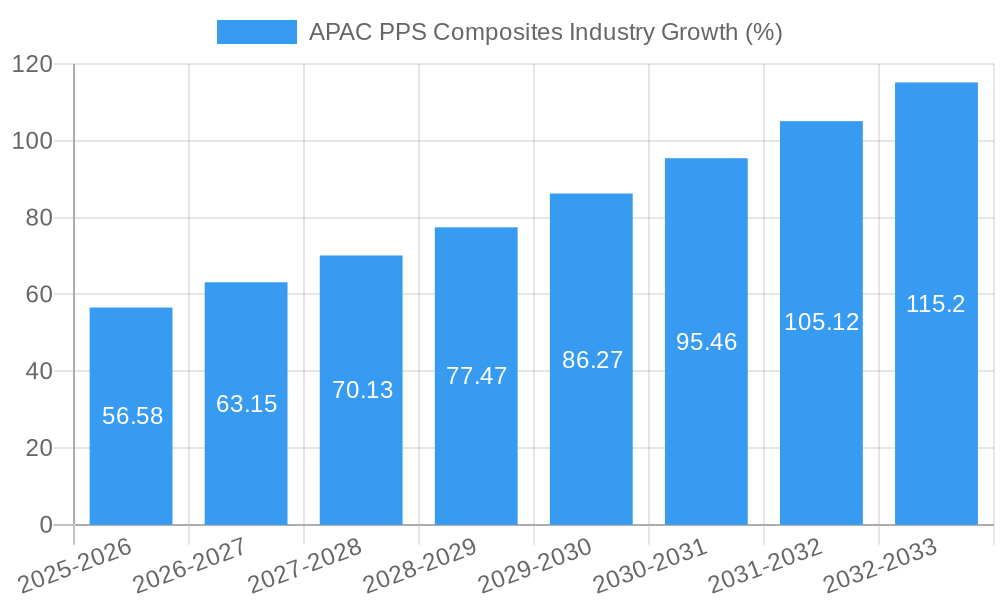
The APAC PPS Composites market, valued at $606.90 million in 2025, is poised for robust growth, exhibiting a Compound Annual Growth Rate (CAGR) exceeding 9.00% from 2025 to 2033. This expansion is fueled by several key drivers. The increasing demand for lightweight, high-performance materials in the automotive and electronics sectors within the region is a significant factor. The rising adoption of electric vehicles (EVs) necessitates components with superior thermal and chemical resistance, properties that PPS composites excel at. Furthermore, the growth of the renewable energy sector, particularly in solar and wind power infrastructure, contributes to market demand, as PPS composites are ideal for demanding applications in these industries. Technological advancements leading to improved processing techniques and the development of specialized PPS composite grades tailored to specific applications further enhance market prospects. However, the market faces certain restraints, including the relatively higher cost of PPS composites compared to alternative materials and potential supply chain disruptions.
Despite these challenges, the market's positive trajectory is expected to continue, driven by the ongoing expansion of manufacturing capabilities in the APAC region and sustained investment in research and development activities. Key players like Celanese Corporation, SABIC, and Teijin Limited are actively involved in expanding their product portfolios and geographical reach, further solidifying the market's position. Segmentation within the market is likely diverse, encompassing various fiber reinforcement types (e.g., carbon fiber, glass fiber), application areas (e.g., automotive, electronics, aerospace), and processing methods (e.g., injection molding, compression molding). Analysis of regional variations within APAC suggests that countries with robust manufacturing sectors and substantial investments in infrastructure development will experience more significant market growth.
APAC PPS Composites Industry: A Comprehensive Market Report (2019-2033)
This in-depth report provides a comprehensive analysis of the Asia-Pacific (APAC) polyphenylene sulfide (PPS) composites industry, offering crucial insights for stakeholders, investors, and industry professionals. Covering the period from 2019 to 2033, with a base year of 2025 and a forecast period of 2025-2033, this report meticulously examines market dynamics, key players, and future growth potential. The report incorporates detailed analysis of market size (in Millions), CAGR, and market penetration.
APAC PPS Composites Industry Market Concentration & Innovation
This section analyzes the competitive landscape of the APAC PPS composites market, exploring market concentration, innovation drivers, regulatory frameworks, product substitutes, end-user trends, and mergers and acquisitions (M&A) activities. The market is characterized by a moderately concentrated structure, with several major players holding significant market share. However, the presence of numerous smaller players indicates a dynamic and competitive environment.
- Market Concentration: The top 5 players account for approximately xx% of the total market share in 2025, while the remaining xx% is distributed among numerous smaller players. This suggests opportunities for both established players and new entrants.
- Innovation Drivers: Technological advancements in PPS resin formulations, coupled with increasing demand for high-performance materials in diverse applications, drive market innovation. This includes the development of specialized composites with enhanced thermal stability, chemical resistance, and mechanical strength.
- Regulatory Landscape: Stringent environmental regulations concerning the use of hazardous materials and the increasing focus on sustainable manufacturing practices influence the adoption of PPS composites as a greener alternative in certain applications.
- Product Substitutes: Competitive pressure arises from alternative materials like high-performance thermoplastics (e.g., PEEK, PEI) and thermosets. However, the unique properties of PPS composites, especially their superior thermal stability and chemical resistance, provide a strong competitive edge.
- End-User Trends: Growth in automotive, electronics, and industrial applications significantly drives market expansion. The increasing adoption of electric vehicles (EVs) and 5G technology further fuels demand for high-performance PPS composites.
- M&A Activities: The past five years have witnessed xx M&A deals in the APAC PPS composites industry, with a total value of approximately $xx Million. These activities reflect the strategic consolidation efforts of major players to enhance their market position and access new technologies.
APAC PPS Composites Industry Industry Trends & Insights
This section delves into the overarching trends and insights shaping the APAC PPS composites market. The market exhibits robust growth, driven by a multitude of factors. The region is projected to witness significant expansion in the forecast period.
The CAGR for the APAC PPS composites market is estimated at xx% during 2025-2033, exceeding the global average. Several key factors contribute to this accelerated growth:
- Rising Demand from Automotive and Electronics Sectors: The increasing adoption of lightweight materials in automobiles to improve fuel efficiency and the growing demand for high-performance components in the electronics industry significantly contribute to the market expansion. Market penetration in these sectors is projected to reach xx% by 2033.
- Technological Advancements: Continuous innovations in PPS resin formulations and manufacturing processes lead to enhanced material properties and cost-effectiveness, driving widespread adoption.
- Government Initiatives and Policy Support: Favorable government policies promoting the adoption of advanced materials and sustainable manufacturing practices in various industries further fuel market growth.
Dominant Markets & Segments in APAC PPS Composites Industry
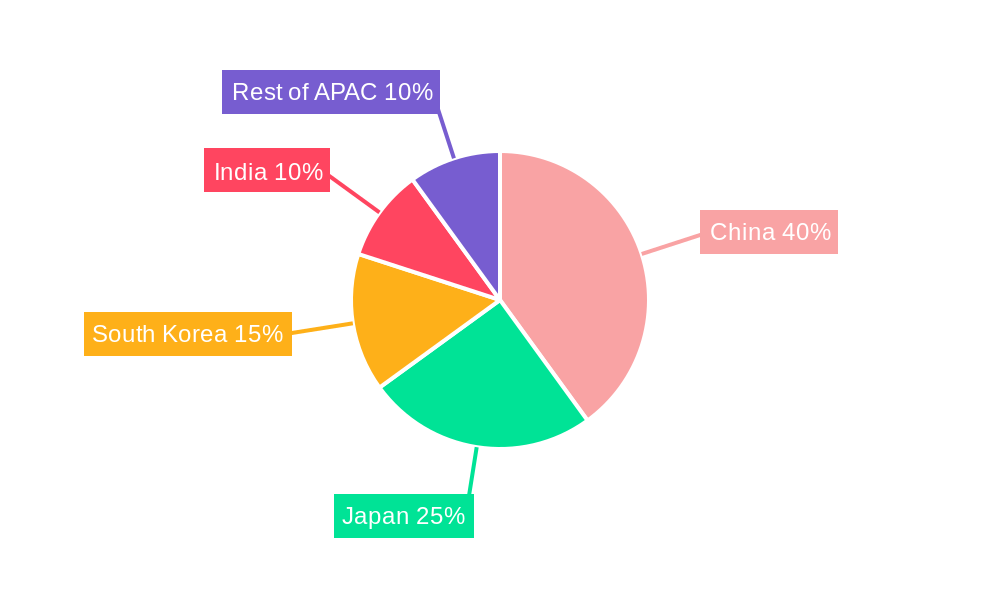
This section identifies the leading regions, countries, and segments within the APAC PPS composites market. China emerges as the dominant market, followed by Japan and South Korea.
- China:
- Key Drivers: Rapid industrialization, significant investments in infrastructure development, and a robust automotive sector contribute to China's dominant position. Government support for advanced material adoption further strengthens its market leadership.
- Japan: A strong electronics industry and a well-established manufacturing base contribute to Japan’s significant market share.
- South Korea: Technological advancements and investments in R&D enhance South Korea’s position as a major player in the APAC PPS composites market.
APAC PPS Composites Industry Product Developments
Recent product developments highlight the industry's focus on enhanced performance and specialized applications. The introduction of glass fiber-reinforced PPS compounds for 5G antenna applications exemplifies the market's progress. Continuous improvements in resin formulations target improved thermal stability, chemical resistance, and mechanical properties, catering to the specific requirements of diverse industries. This focus on tailored solutions differentiates products and secures a competitive edge.
Report Scope & Segmentation Analysis
This report segments the APAC PPS composites market based on material type (fiber-reinforced, unreinforced), application (automotive, electronics, industrial), and region (China, Japan, South Korea, etc.). Each segment is characterized by unique growth projections, market sizes, and competitive dynamics. Growth in the fiber-reinforced segment is expected to significantly outpace the unreinforced segment driven by the higher demand for enhanced mechanical properties. The automotive segment is projected to experience the fastest growth among applications.
Key Drivers of APAC PPS Composites Industry Growth
Several factors contribute to the robust growth of the APAC PPS composites market. Technological advancements lead to improved material properties and processing techniques. The increasing demand for lightweight, high-performance materials in diverse applications fuels market expansion. Government regulations and environmental concerns push the adoption of sustainable materials, further boosting market growth.
Challenges in the APAP PPS Composites Industry Sector
The APAC PPS composites market faces several challenges, including fluctuating raw material prices, intense competition from substitute materials, and supply chain complexities. Stringent regulatory requirements and environmental concerns necessitate careful compliance, while maintaining cost-effectiveness and competitiveness is crucial.
Emerging Opportunities in APAC PPS Composites Industry
Emerging opportunities include expanding into niche applications (e.g., aerospace, medical devices), developing sustainable and bio-based PPS composites, and leveraging digitalization for improved supply chain management and process optimization. Focusing on customized solutions and strategic partnerships will enhance market penetration and secure a strong competitive position.
Leading Players in the APAC PPS Composites Industry Market
- British Plastics Federation
- Celanese Corporation
- DIC Corporation
- Ensinger
- KOLON PLASTICS INC
- KUREHA CORPORATION
- Polyplastics Co Ltd
- RTP Company
- SABIC
- SGL Carbon
- Solvay
- STARCHEM LLC
- Teijin Limited
- Tosoh Corporation
- Xiamen LFT Composite Plastic Co Ltd *List Not Exhaustive
Key Developments in APAC PPS Composites Industry Industry
- November 2022: Polyplastics Co., Ltd. expanded its PPS resin production capacity at its Nantong plant from 9,000 to 21,400 tons annually, with the expansion becoming operational in January 2025. This significantly increases global supply and potentially lowers prices.
- April 2022: SABIC launched the LNP THERMOCOMP OFC08V compound, a glass fiber-reinforced PPS resin for 5G base station antennas and other electronics applications. This highlights the growing demand for PPS in high-tech sectors.
Strategic Outlook for APAC PPS Composites Industry Market
The APAC PPS composites market exhibits strong growth potential driven by technological advancements, increasing demand from key industries, and favorable government policies. Strategic partnerships, focus on innovation, and expansion into new applications will be crucial for success in this dynamic and competitive market. The market is poised for continued expansion, presenting lucrative opportunities for both established players and new entrants.
APAC PPS Composites Industry Segmentation
-
1. Type
- 1.1. Carbon Fiber-Reinforced Composites
- 1.2. Glass Fiber-Reinforced Composites
- 1.3. Other Ty
-
2. End-user Industry
- 2.1. Aerospace and Defense
- 2.2. Automotive
- 2.3. Oil and Gas
- 2.4. Electrical and Electronics
- 2.5. Industrial
- 2.6. Other En
-
3. Geography
- 3.1. China
- 3.2. India
- 3.3. Japan
- 3.4. South Korea
- 3.5. ASEAN Countries
- 3.6. Rest of Asia-Pacific
APAC PPS Composites Industry Segmentation By Geography
- 1. China
- 2. India
- 3. Japan
- 4. South Korea
- 5. ASEAN Countries
- 6. Rest of Asia Pacific
APAC PPS Composites Industry REPORT HIGHLIGHTS
| Aspects | Details |
|---|---|
| Study Period | 2019-2033 |
| Base Year | 2024 |
| Estimated Year | 2025 |
| Forecast Period | 2025-2033 |
| Historical Period | 2019-2024 |
| Growth Rate | CAGR of > 9.00% from 2019-2033 |
| Segmentation |
|
Table of Contents
- 1. Introduction
- 1.1. Research Scope
- 1.2. Market Segmentation
- 1.3. Research Methodology
- 1.4. Definitions and Assumptions
- 2. Executive Summary
- 2.1. Introduction
- 3. Market Dynamics
- 3.1. Introduction
- 3.2. Market Drivers
- 3.2.1. Rising Demand from Aerospace and Defense; Increasing Demand from Oil and Gas Sector; Other Drivers
- 3.3. Market Restrains
- 3.3.1. Rising Demand from Aerospace and Defense; Increasing Demand from Oil and Gas Sector; Other Drivers
- 3.4. Market Trends
- 3.4.1. Aerospace and Defense Sector to Drive the Polyphenylene Sulfide (PPS) Composites Market
- 4. Market Factor Analysis
- 4.1. Porters Five Forces
- 4.2. Supply/Value Chain
- 4.3. PESTEL analysis
- 4.4. Market Entropy
- 4.5. Patent/Trademark Analysis
- 5. Global APAC PPS Composites Industry Analysis, Insights and Forecast, 2019-2031
- 5.1. Market Analysis, Insights and Forecast - by Type
- 5.1.1. Carbon Fiber-Reinforced Composites
- 5.1.2. Glass Fiber-Reinforced Composites
- 5.1.3. Other Ty
- 5.2. Market Analysis, Insights and Forecast - by End-user Industry
- 5.2.1. Aerospace and Defense
- 5.2.2. Automotive
- 5.2.3. Oil and Gas
- 5.2.4. Electrical and Electronics
- 5.2.5. Industrial
- 5.2.6. Other En
- 5.3. Market Analysis, Insights and Forecast - by Geography
- 5.3.1. China
- 5.3.2. India
- 5.3.3. Japan
- 5.3.4. South Korea
- 5.3.5. ASEAN Countries
- 5.3.6. Rest of Asia-Pacific
- 5.4. Market Analysis, Insights and Forecast - by Region
- 5.4.1. China
- 5.4.2. India
- 5.4.3. Japan
- 5.4.4. South Korea
- 5.4.5. ASEAN Countries
- 5.4.6. Rest of Asia Pacific
- 5.1. Market Analysis, Insights and Forecast - by Type
- 6. China APAC PPS Composites Industry Analysis, Insights and Forecast, 2019-2031
- 6.1. Market Analysis, Insights and Forecast - by Type
- 6.1.1. Carbon Fiber-Reinforced Composites
- 6.1.2. Glass Fiber-Reinforced Composites
- 6.1.3. Other Ty
- 6.2. Market Analysis, Insights and Forecast - by End-user Industry
- 6.2.1. Aerospace and Defense
- 6.2.2. Automotive
- 6.2.3. Oil and Gas
- 6.2.4. Electrical and Electronics
- 6.2.5. Industrial
- 6.2.6. Other En
- 6.3. Market Analysis, Insights and Forecast - by Geography
- 6.3.1. China
- 6.3.2. India
- 6.3.3. Japan
- 6.3.4. South Korea
- 6.3.5. ASEAN Countries
- 6.3.6. Rest of Asia-Pacific
- 6.1. Market Analysis, Insights and Forecast - by Type
- 7. India APAC PPS Composites Industry Analysis, Insights and Forecast, 2019-2031
- 7.1. Market Analysis, Insights and Forecast - by Type
- 7.1.1. Carbon Fiber-Reinforced Composites
- 7.1.2. Glass Fiber-Reinforced Composites
- 7.1.3. Other Ty
- 7.2. Market Analysis, Insights and Forecast - by End-user Industry
- 7.2.1. Aerospace and Defense
- 7.2.2. Automotive
- 7.2.3. Oil and Gas
- 7.2.4. Electrical and Electronics
- 7.2.5. Industrial
- 7.2.6. Other En
- 7.3. Market Analysis, Insights and Forecast - by Geography
- 7.3.1. China
- 7.3.2. India
- 7.3.3. Japan
- 7.3.4. South Korea
- 7.3.5. ASEAN Countries
- 7.3.6. Rest of Asia-Pacific
- 7.1. Market Analysis, Insights and Forecast - by Type
- 8. Japan APAC PPS Composites Industry Analysis, Insights and Forecast, 2019-2031
- 8.1. Market Analysis, Insights and Forecast - by Type
- 8.1.1. Carbon Fiber-Reinforced Composites
- 8.1.2. Glass Fiber-Reinforced Composites
- 8.1.3. Other Ty
- 8.2. Market Analysis, Insights and Forecast - by End-user Industry
- 8.2.1. Aerospace and Defense
- 8.2.2. Automotive
- 8.2.3. Oil and Gas
- 8.2.4. Electrical and Electronics
- 8.2.5. Industrial
- 8.2.6. Other En
- 8.3. Market Analysis, Insights and Forecast - by Geography
- 8.3.1. China
- 8.3.2. India
- 8.3.3. Japan
- 8.3.4. South Korea
- 8.3.5. ASEAN Countries
- 8.3.6. Rest of Asia-Pacific
- 8.1. Market Analysis, Insights and Forecast - by Type
- 9. South Korea APAC PPS Composites Industry Analysis, Insights and Forecast, 2019-2031
- 9.1. Market Analysis, Insights and Forecast - by Type
- 9.1.1. Carbon Fiber-Reinforced Composites
- 9.1.2. Glass Fiber-Reinforced Composites
- 9.1.3. Other Ty
- 9.2. Market Analysis, Insights and Forecast - by End-user Industry
- 9.2.1. Aerospace and Defense
- 9.2.2. Automotive
- 9.2.3. Oil and Gas
- 9.2.4. Electrical and Electronics
- 9.2.5. Industrial
- 9.2.6. Other En
- 9.3. Market Analysis, Insights and Forecast - by Geography
- 9.3.1. China
- 9.3.2. India
- 9.3.3. Japan
- 9.3.4. South Korea
- 9.3.5. ASEAN Countries
- 9.3.6. Rest of Asia-Pacific
- 9.1. Market Analysis, Insights and Forecast - by Type
- 10. ASEAN Countries APAC PPS Composites Industry Analysis, Insights and Forecast, 2019-2031
- 10.1. Market Analysis, Insights and Forecast - by Type
- 10.1.1. Carbon Fiber-Reinforced Composites
- 10.1.2. Glass Fiber-Reinforced Composites
- 10.1.3. Other Ty
- 10.2. Market Analysis, Insights and Forecast - by End-user Industry
- 10.2.1. Aerospace and Defense
- 10.2.2. Automotive
- 10.2.3. Oil and Gas
- 10.2.4. Electrical and Electronics
- 10.2.5. Industrial
- 10.2.6. Other En
- 10.3. Market Analysis, Insights and Forecast - by Geography
- 10.3.1. China
- 10.3.2. India
- 10.3.3. Japan
- 10.3.4. South Korea
- 10.3.5. ASEAN Countries
- 10.3.6. Rest of Asia-Pacific
- 10.1. Market Analysis, Insights and Forecast - by Type
- 11. Rest of Asia Pacific APAC PPS Composites Industry Analysis, Insights and Forecast, 2019-2031
- 11.1. Market Analysis, Insights and Forecast - by Type
- 11.1.1. Carbon Fiber-Reinforced Composites
- 11.1.2. Glass Fiber-Reinforced Composites
- 11.1.3. Other Ty
- 11.2. Market Analysis, Insights and Forecast - by End-user Industry
- 11.2.1. Aerospace and Defense
- 11.2.2. Automotive
- 11.2.3. Oil and Gas
- 11.2.4. Electrical and Electronics
- 11.2.5. Industrial
- 11.2.6. Other En
- 11.3. Market Analysis, Insights and Forecast - by Geography
- 11.3.1. China
- 11.3.2. India
- 11.3.3. Japan
- 11.3.4. South Korea
- 11.3.5. ASEAN Countries
- 11.3.6. Rest of Asia-Pacific
- 11.1. Market Analysis, Insights and Forecast - by Type
- 12. Competitive Analysis
- 12.1. Global Market Share Analysis 2024
- 12.2. Company Profiles
- 12.2.1 British Plastics Federation
- 12.2.1.1. Overview
- 12.2.1.2. Products
- 12.2.1.3. SWOT Analysis
- 12.2.1.4. Recent Developments
- 12.2.1.5. Financials (Based on Availability)
- 12.2.2 Celanese Corporation
- 12.2.2.1. Overview
- 12.2.2.2. Products
- 12.2.2.3. SWOT Analysis
- 12.2.2.4. Recent Developments
- 12.2.2.5. Financials (Based on Availability)
- 12.2.3 DIC Corporation
- 12.2.3.1. Overview
- 12.2.3.2. Products
- 12.2.3.3. SWOT Analysis
- 12.2.3.4. Recent Developments
- 12.2.3.5. Financials (Based on Availability)
- 12.2.4 Ensinger
- 12.2.4.1. Overview
- 12.2.4.2. Products
- 12.2.4.3. SWOT Analysis
- 12.2.4.4. Recent Developments
- 12.2.4.5. Financials (Based on Availability)
- 12.2.5 KOLON PLASTICS INC
- 12.2.5.1. Overview
- 12.2.5.2. Products
- 12.2.5.3. SWOT Analysis
- 12.2.5.4. Recent Developments
- 12.2.5.5. Financials (Based on Availability)
- 12.2.6 KUREHA CORPORATION
- 12.2.6.1. Overview
- 12.2.6.2. Products
- 12.2.6.3. SWOT Analysis
- 12.2.6.4. Recent Developments
- 12.2.6.5. Financials (Based on Availability)
- 12.2.7 Polyplastics Co Ltd
- 12.2.7.1. Overview
- 12.2.7.2. Products
- 12.2.7.3. SWOT Analysis
- 12.2.7.4. Recent Developments
- 12.2.7.5. Financials (Based on Availability)
- 12.2.8 RTP Company
- 12.2.8.1. Overview
- 12.2.8.2. Products
- 12.2.8.3. SWOT Analysis
- 12.2.8.4. Recent Developments
- 12.2.8.5. Financials (Based on Availability)
- 12.2.9 SABIC
- 12.2.9.1. Overview
- 12.2.9.2. Products
- 12.2.9.3. SWOT Analysis
- 12.2.9.4. Recent Developments
- 12.2.9.5. Financials (Based on Availability)
- 12.2.10 SGL Carbon
- 12.2.10.1. Overview
- 12.2.10.2. Products
- 12.2.10.3. SWOT Analysis
- 12.2.10.4. Recent Developments
- 12.2.10.5. Financials (Based on Availability)
- 12.2.11 Solvay
- 12.2.11.1. Overview
- 12.2.11.2. Products
- 12.2.11.3. SWOT Analysis
- 12.2.11.4. Recent Developments
- 12.2.11.5. Financials (Based on Availability)
- 12.2.12 STARCHEM LLC
- 12.2.12.1. Overview
- 12.2.12.2. Products
- 12.2.12.3. SWOT Analysis
- 12.2.12.4. Recent Developments
- 12.2.12.5. Financials (Based on Availability)
- 12.2.13 Teijin Limited
- 12.2.13.1. Overview
- 12.2.13.2. Products
- 12.2.13.3. SWOT Analysis
- 12.2.13.4. Recent Developments
- 12.2.13.5. Financials (Based on Availability)
- 12.2.14 Tosoh Corporation
- 12.2.14.1. Overview
- 12.2.14.2. Products
- 12.2.14.3. SWOT Analysis
- 12.2.14.4. Recent Developments
- 12.2.14.5. Financials (Based on Availability)
- 12.2.15 Xiamen LFT Composite Plastic Co Ltd*List Not Exhaustive
- 12.2.15.1. Overview
- 12.2.15.2. Products
- 12.2.15.3. SWOT Analysis
- 12.2.15.4. Recent Developments
- 12.2.15.5. Financials (Based on Availability)
- 12.2.1 British Plastics Federation
List of Figures
- Figure 1: Global APAC PPS Composites Industry Revenue Breakdown (Million, %) by Region 2024 & 2032
- Figure 2: Global APAC PPS Composites Industry Volume Breakdown (Million, %) by Region 2024 & 2032
- Figure 3: China APAC PPS Composites Industry Revenue (Million), by Type 2024 & 2032
- Figure 4: China APAC PPS Composites Industry Volume (Million), by Type 2024 & 2032
- Figure 5: China APAC PPS Composites Industry Revenue Share (%), by Type 2024 & 2032
- Figure 6: China APAC PPS Composites Industry Volume Share (%), by Type 2024 & 2032
- Figure 7: China APAC PPS Composites Industry Revenue (Million), by End-user Industry 2024 & 2032
- Figure 8: China APAC PPS Composites Industry Volume (Million), by End-user Industry 2024 & 2032
- Figure 9: China APAC PPS Composites Industry Revenue Share (%), by End-user Industry 2024 & 2032
- Figure 10: China APAC PPS Composites Industry Volume Share (%), by End-user Industry 2024 & 2032
- Figure 11: China APAC PPS Composites Industry Revenue (Million), by Geography 2024 & 2032
- Figure 12: China APAC PPS Composites Industry Volume (Million), by Geography 2024 & 2032
- Figure 13: China APAC PPS Composites Industry Revenue Share (%), by Geography 2024 & 2032
- Figure 14: China APAC PPS Composites Industry Volume Share (%), by Geography 2024 & 2032
- Figure 15: China APAC PPS Composites Industry Revenue (Million), by Country 2024 & 2032
- Figure 16: China APAC PPS Composites Industry Volume (Million), by Country 2024 & 2032
- Figure 17: China APAC PPS Composites Industry Revenue Share (%), by Country 2024 & 2032
- Figure 18: China APAC PPS Composites Industry Volume Share (%), by Country 2024 & 2032
- Figure 19: India APAC PPS Composites Industry Revenue (Million), by Type 2024 & 2032
- Figure 20: India APAC PPS Composites Industry Volume (Million), by Type 2024 & 2032
- Figure 21: India APAC PPS Composites Industry Revenue Share (%), by Type 2024 & 2032
- Figure 22: India APAC PPS Composites Industry Volume Share (%), by Type 2024 & 2032
- Figure 23: India APAC PPS Composites Industry Revenue (Million), by End-user Industry 2024 & 2032
- Figure 24: India APAC PPS Composites Industry Volume (Million), by End-user Industry 2024 & 2032
- Figure 25: India APAC PPS Composites Industry Revenue Share (%), by End-user Industry 2024 & 2032
- Figure 26: India APAC PPS Composites Industry Volume Share (%), by End-user Industry 2024 & 2032
- Figure 27: India APAC PPS Composites Industry Revenue (Million), by Geography 2024 & 2032
- Figure 28: India APAC PPS Composites Industry Volume (Million), by Geography 2024 & 2032
- Figure 29: India APAC PPS Composites Industry Revenue Share (%), by Geography 2024 & 2032
- Figure 30: India APAC PPS Composites Industry Volume Share (%), by Geography 2024 & 2032
- Figure 31: India APAC PPS Composites Industry Revenue (Million), by Country 2024 & 2032
- Figure 32: India APAC PPS Composites Industry Volume (Million), by Country 2024 & 2032
- Figure 33: India APAC PPS Composites Industry Revenue Share (%), by Country 2024 & 2032
- Figure 34: India APAC PPS Composites Industry Volume Share (%), by Country 2024 & 2032
- Figure 35: Japan APAC PPS Composites Industry Revenue (Million), by Type 2024 & 2032
- Figure 36: Japan APAC PPS Composites Industry Volume (Million), by Type 2024 & 2032
- Figure 37: Japan APAC PPS Composites Industry Revenue Share (%), by Type 2024 & 2032
- Figure 38: Japan APAC PPS Composites Industry Volume Share (%), by Type 2024 & 2032
- Figure 39: Japan APAC PPS Composites Industry Revenue (Million), by End-user Industry 2024 & 2032
- Figure 40: Japan APAC PPS Composites Industry Volume (Million), by End-user Industry 2024 & 2032
- Figure 41: Japan APAC PPS Composites Industry Revenue Share (%), by End-user Industry 2024 & 2032
- Figure 42: Japan APAC PPS Composites Industry Volume Share (%), by End-user Industry 2024 & 2032
- Figure 43: Japan APAC PPS Composites Industry Revenue (Million), by Geography 2024 & 2032
- Figure 44: Japan APAC PPS Composites Industry Volume (Million), by Geography 2024 & 2032
- Figure 45: Japan APAC PPS Composites Industry Revenue Share (%), by Geography 2024 & 2032
- Figure 46: Japan APAC PPS Composites Industry Volume Share (%), by Geography 2024 & 2032
- Figure 47: Japan APAC PPS Composites Industry Revenue (Million), by Country 2024 & 2032
- Figure 48: Japan APAC PPS Composites Industry Volume (Million), by Country 2024 & 2032
- Figure 49: Japan APAC PPS Composites Industry Revenue Share (%), by Country 2024 & 2032
- Figure 50: Japan APAC PPS Composites Industry Volume Share (%), by Country 2024 & 2032
- Figure 51: South Korea APAC PPS Composites Industry Revenue (Million), by Type 2024 & 2032
- Figure 52: South Korea APAC PPS Composites Industry Volume (Million), by Type 2024 & 2032
- Figure 53: South Korea APAC PPS Composites Industry Revenue Share (%), by Type 2024 & 2032
- Figure 54: South Korea APAC PPS Composites Industry Volume Share (%), by Type 2024 & 2032
- Figure 55: South Korea APAC PPS Composites Industry Revenue (Million), by End-user Industry 2024 & 2032
- Figure 56: South Korea APAC PPS Composites Industry Volume (Million), by End-user Industry 2024 & 2032
- Figure 57: South Korea APAC PPS Composites Industry Revenue Share (%), by End-user Industry 2024 & 2032
- Figure 58: South Korea APAC PPS Composites Industry Volume Share (%), by End-user Industry 2024 & 2032
- Figure 59: South Korea APAC PPS Composites Industry Revenue (Million), by Geography 2024 & 2032
- Figure 60: South Korea APAC PPS Composites Industry Volume (Million), by Geography 2024 & 2032
- Figure 61: South Korea APAC PPS Composites Industry Revenue Share (%), by Geography 2024 & 2032
- Figure 62: South Korea APAC PPS Composites Industry Volume Share (%), by Geography 2024 & 2032
- Figure 63: South Korea APAC PPS Composites Industry Revenue (Million), by Country 2024 & 2032
- Figure 64: South Korea APAC PPS Composites Industry Volume (Million), by Country 2024 & 2032
- Figure 65: South Korea APAC PPS Composites Industry Revenue Share (%), by Country 2024 & 2032
- Figure 66: South Korea APAC PPS Composites Industry Volume Share (%), by Country 2024 & 2032
- Figure 67: ASEAN Countries APAC PPS Composites Industry Revenue (Million), by Type 2024 & 2032
- Figure 68: ASEAN Countries APAC PPS Composites Industry Volume (Million), by Type 2024 & 2032
- Figure 69: ASEAN Countries APAC PPS Composites Industry Revenue Share (%), by Type 2024 & 2032
- Figure 70: ASEAN Countries APAC PPS Composites Industry Volume Share (%), by Type 2024 & 2032
- Figure 71: ASEAN Countries APAC PPS Composites Industry Revenue (Million), by End-user Industry 2024 & 2032
- Figure 72: ASEAN Countries APAC PPS Composites Industry Volume (Million), by End-user Industry 2024 & 2032
- Figure 73: ASEAN Countries APAC PPS Composites Industry Revenue Share (%), by End-user Industry 2024 & 2032
- Figure 74: ASEAN Countries APAC PPS Composites Industry Volume Share (%), by End-user Industry 2024 & 2032
- Figure 75: ASEAN Countries APAC PPS Composites Industry Revenue (Million), by Geography 2024 & 2032
- Figure 76: ASEAN Countries APAC PPS Composites Industry Volume (Million), by Geography 2024 & 2032
- Figure 77: ASEAN Countries APAC PPS Composites Industry Revenue Share (%), by Geography 2024 & 2032
- Figure 78: ASEAN Countries APAC PPS Composites Industry Volume Share (%), by Geography 2024 & 2032
- Figure 79: ASEAN Countries APAC PPS Composites Industry Revenue (Million), by Country 2024 & 2032
- Figure 80: ASEAN Countries APAC PPS Composites Industry Volume (Million), by Country 2024 & 2032
- Figure 81: ASEAN Countries APAC PPS Composites Industry Revenue Share (%), by Country 2024 & 2032
- Figure 82: ASEAN Countries APAC PPS Composites Industry Volume Share (%), by Country 2024 & 2032
- Figure 83: Rest of Asia Pacific APAC PPS Composites Industry Revenue (Million), by Type 2024 & 2032
- Figure 84: Rest of Asia Pacific APAC PPS Composites Industry Volume (Million), by Type 2024 & 2032
- Figure 85: Rest of Asia Pacific APAC PPS Composites Industry Revenue Share (%), by Type 2024 & 2032
- Figure 86: Rest of Asia Pacific APAC PPS Composites Industry Volume Share (%), by Type 2024 & 2032
- Figure 87: Rest of Asia Pacific APAC PPS Composites Industry Revenue (Million), by End-user Industry 2024 & 2032
- Figure 88: Rest of Asia Pacific APAC PPS Composites Industry Volume (Million), by End-user Industry 2024 & 2032
- Figure 89: Rest of Asia Pacific APAC PPS Composites Industry Revenue Share (%), by End-user Industry 2024 & 2032
- Figure 90: Rest of Asia Pacific APAC PPS Composites Industry Volume Share (%), by End-user Industry 2024 & 2032
- Figure 91: Rest of Asia Pacific APAC PPS Composites Industry Revenue (Million), by Geography 2024 & 2032
- Figure 92: Rest of Asia Pacific APAC PPS Composites Industry Volume (Million), by Geography 2024 & 2032
- Figure 93: Rest of Asia Pacific APAC PPS Composites Industry Revenue Share (%), by Geography 2024 & 2032
- Figure 94: Rest of Asia Pacific APAC PPS Composites Industry Volume Share (%), by Geography 2024 & 2032
- Figure 95: Rest of Asia Pacific APAC PPS Composites Industry Revenue (Million), by Country 2024 & 2032
- Figure 96: Rest of Asia Pacific APAC PPS Composites Industry Volume (Million), by Country 2024 & 2032
- Figure 97: Rest of Asia Pacific APAC PPS Composites Industry Revenue Share (%), by Country 2024 & 2032
- Figure 98: Rest of Asia Pacific APAC PPS Composites Industry Volume Share (%), by Country 2024 & 2032
List of Tables
- Table 1: Global APAC PPS Composites Industry Revenue Million Forecast, by Region 2019 & 2032
- Table 2: Global APAC PPS Composites Industry Volume Million Forecast, by Region 2019 & 2032
- Table 3: Global APAC PPS Composites Industry Revenue Million Forecast, by Type 2019 & 2032
- Table 4: Global APAC PPS Composites Industry Volume Million Forecast, by Type 2019 & 2032
- Table 5: Global APAC PPS Composites Industry Revenue Million Forecast, by End-user Industry 2019 & 2032
- Table 6: Global APAC PPS Composites Industry Volume Million Forecast, by End-user Industry 2019 & 2032
- Table 7: Global APAC PPS Composites Industry Revenue Million Forecast, by Geography 2019 & 2032
- Table 8: Global APAC PPS Composites Industry Volume Million Forecast, by Geography 2019 & 2032
- Table 9: Global APAC PPS Composites Industry Revenue Million Forecast, by Region 2019 & 2032
- Table 10: Global APAC PPS Composites Industry Volume Million Forecast, by Region 2019 & 2032
- Table 11: Global APAC PPS Composites Industry Revenue Million Forecast, by Type 2019 & 2032
- Table 12: Global APAC PPS Composites Industry Volume Million Forecast, by Type 2019 & 2032
- Table 13: Global APAC PPS Composites Industry Revenue Million Forecast, by End-user Industry 2019 & 2032
- Table 14: Global APAC PPS Composites Industry Volume Million Forecast, by End-user Industry 2019 & 2032
- Table 15: Global APAC PPS Composites Industry Revenue Million Forecast, by Geography 2019 & 2032
- Table 16: Global APAC PPS Composites Industry Volume Million Forecast, by Geography 2019 & 2032
- Table 17: Global APAC PPS Composites Industry Revenue Million Forecast, by Country 2019 & 2032
- Table 18: Global APAC PPS Composites Industry Volume Million Forecast, by Country 2019 & 2032
- Table 19: Global APAC PPS Composites Industry Revenue Million Forecast, by Type 2019 & 2032
- Table 20: Global APAC PPS Composites Industry Volume Million Forecast, by Type 2019 & 2032
- Table 21: Global APAC PPS Composites Industry Revenue Million Forecast, by End-user Industry 2019 & 2032
- Table 22: Global APAC PPS Composites Industry Volume Million Forecast, by End-user Industry 2019 & 2032
- Table 23: Global APAC PPS Composites Industry Revenue Million Forecast, by Geography 2019 & 2032
- Table 24: Global APAC PPS Composites Industry Volume Million Forecast, by Geography 2019 & 2032
- Table 25: Global APAC PPS Composites Industry Revenue Million Forecast, by Country 2019 & 2032
- Table 26: Global APAC PPS Composites Industry Volume Million Forecast, by Country 2019 & 2032
- Table 27: Global APAC PPS Composites Industry Revenue Million Forecast, by Type 2019 & 2032
- Table 28: Global APAC PPS Composites Industry Volume Million Forecast, by Type 2019 & 2032
- Table 29: Global APAC PPS Composites Industry Revenue Million Forecast, by End-user Industry 2019 & 2032
- Table 30: Global APAC PPS Composites Industry Volume Million Forecast, by End-user Industry 2019 & 2032
- Table 31: Global APAC PPS Composites Industry Revenue Million Forecast, by Geography 2019 & 2032
- Table 32: Global APAC PPS Composites Industry Volume Million Forecast, by Geography 2019 & 2032
- Table 33: Global APAC PPS Composites Industry Revenue Million Forecast, by Country 2019 & 2032
- Table 34: Global APAC PPS Composites Industry Volume Million Forecast, by Country 2019 & 2032
- Table 35: Global APAC PPS Composites Industry Revenue Million Forecast, by Type 2019 & 2032
- Table 36: Global APAC PPS Composites Industry Volume Million Forecast, by Type 2019 & 2032
- Table 37: Global APAC PPS Composites Industry Revenue Million Forecast, by End-user Industry 2019 & 2032
- Table 38: Global APAC PPS Composites Industry Volume Million Forecast, by End-user Industry 2019 & 2032
- Table 39: Global APAC PPS Composites Industry Revenue Million Forecast, by Geography 2019 & 2032
- Table 40: Global APAC PPS Composites Industry Volume Million Forecast, by Geography 2019 & 2032
- Table 41: Global APAC PPS Composites Industry Revenue Million Forecast, by Country 2019 & 2032
- Table 42: Global APAC PPS Composites Industry Volume Million Forecast, by Country 2019 & 2032
- Table 43: Global APAC PPS Composites Industry Revenue Million Forecast, by Type 2019 & 2032
- Table 44: Global APAC PPS Composites Industry Volume Million Forecast, by Type 2019 & 2032
- Table 45: Global APAC PPS Composites Industry Revenue Million Forecast, by End-user Industry 2019 & 2032
- Table 46: Global APAC PPS Composites Industry Volume Million Forecast, by End-user Industry 2019 & 2032
- Table 47: Global APAC PPS Composites Industry Revenue Million Forecast, by Geography 2019 & 2032
- Table 48: Global APAC PPS Composites Industry Volume Million Forecast, by Geography 2019 & 2032
- Table 49: Global APAC PPS Composites Industry Revenue Million Forecast, by Country 2019 & 2032
- Table 50: Global APAC PPS Composites Industry Volume Million Forecast, by Country 2019 & 2032
- Table 51: Global APAC PPS Composites Industry Revenue Million Forecast, by Type 2019 & 2032
- Table 52: Global APAC PPS Composites Industry Volume Million Forecast, by Type 2019 & 2032
- Table 53: Global APAC PPS Composites Industry Revenue Million Forecast, by End-user Industry 2019 & 2032
- Table 54: Global APAC PPS Composites Industry Volume Million Forecast, by End-user Industry 2019 & 2032
- Table 55: Global APAC PPS Composites Industry Revenue Million Forecast, by Geography 2019 & 2032
- Table 56: Global APAC PPS Composites Industry Volume Million Forecast, by Geography 2019 & 2032
- Table 57: Global APAC PPS Composites Industry Revenue Million Forecast, by Country 2019 & 2032
- Table 58: Global APAC PPS Composites Industry Volume Million Forecast, by Country 2019 & 2032
Frequently Asked Questions
1. What is the projected Compound Annual Growth Rate (CAGR) of the APAC PPS Composites Industry?
The projected CAGR is approximately > 9.00%.
2. Which companies are prominent players in the APAC PPS Composites Industry?
Key companies in the market include British Plastics Federation, Celanese Corporation, DIC Corporation, Ensinger, KOLON PLASTICS INC, KUREHA CORPORATION, Polyplastics Co Ltd, RTP Company, SABIC, SGL Carbon, Solvay, STARCHEM LLC, Teijin Limited, Tosoh Corporation, Xiamen LFT Composite Plastic Co Ltd*List Not Exhaustive.
3. What are the main segments of the APAC PPS Composites Industry?
The market segments include Type, End-user Industry, Geography.
4. Can you provide details about the market size?
The market size is estimated to be USD 606.90 Million as of 2022.
5. What are some drivers contributing to market growth?
Rising Demand from Aerospace and Defense; Increasing Demand from Oil and Gas Sector; Other Drivers.
6. What are the notable trends driving market growth?
Aerospace and Defense Sector to Drive the Polyphenylene Sulfide (PPS) Composites Market.
7. Are there any restraints impacting market growth?
Rising Demand from Aerospace and Defense; Increasing Demand from Oil and Gas Sector; Other Drivers.
8. Can you provide examples of recent developments in the market?
November 2022: Polyplastics Co., Ltd. expanded its compound capacity of (Nantong) Ltd., the PPS resin production plant. The newly expanded capacity will meet the demand for engineering plastics worldwide and increase the annual production capacity from 9,000 to 21,400 tons. The new manufacturing plant will be in operation from January 2025.
9. What pricing options are available for accessing the report?
Pricing options include single-user, multi-user, and enterprise licenses priced at USD 4750, USD 5250, and USD 8750 respectively.
10. Is the market size provided in terms of value or volume?
The market size is provided in terms of value, measured in Million and volume, measured in Million.
11. Are there any specific market keywords associated with the report?
Yes, the market keyword associated with the report is "APAC PPS Composites Industry," which aids in identifying and referencing the specific market segment covered.
12. How do I determine which pricing option suits my needs best?
The pricing options vary based on user requirements and access needs. Individual users may opt for single-user licenses, while businesses requiring broader access may choose multi-user or enterprise licenses for cost-effective access to the report.
13. Are there any additional resources or data provided in the APAC PPS Composites Industry report?
While the report offers comprehensive insights, it's advisable to review the specific contents or supplementary materials provided to ascertain if additional resources or data are available.
14. How can I stay updated on further developments or reports in the APAC PPS Composites Industry?
To stay informed about further developments, trends, and reports in the APAC PPS Composites Industry, consider subscribing to industry newsletters, following relevant companies and organizations, or regularly checking reputable industry news sources and publications.
Methodology
Step 1 - Identification of Relevant Samples Size from Population Database


Step 2 - Approaches for Defining Global Market Size (Value, Volume* & Price*)

Note*: In applicable scenarios
Step 3 - Data Sources
Primary Research
- Web Analytics
- Survey Reports
- Research Institute
- Latest Research Reports
- Opinion Leaders
Secondary Research
- Annual Reports
- White Paper
- Latest Press Release
- Industry Association
- Paid Database
- Investor Presentations

Step 4 - Data Triangulation
Involves using different sources of information in order to increase the validity of a study
These sources are likely to be stakeholders in a program - participants, other researchers, program staff, other community members, and so on.
Then we put all data in single framework & apply various statistical tools to find out the dynamic on the market.
During the analysis stage, feedback from the stakeholder groups would be compared to determine areas of agreement as well as areas of divergence


