
Key Insights
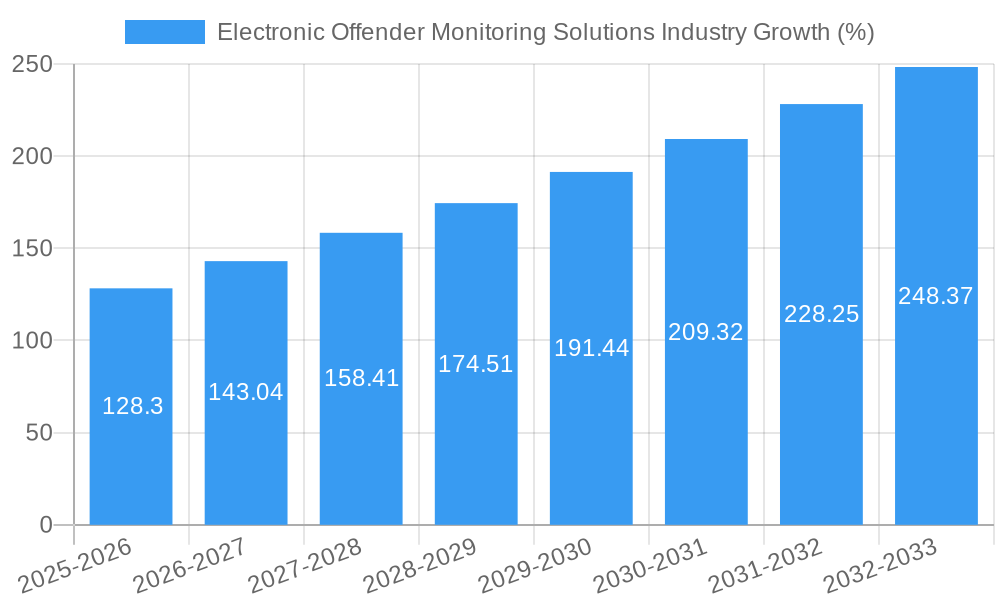
The Electronic Offender Monitoring (EOM) solutions market, valued at $1.34 billion in 2025, is projected to experience robust growth, exhibiting a Compound Annual Growth Rate (CAGR) of 9.50% from 2025 to 2033. This expansion is driven by several key factors. Increasing crime rates and the need for cost-effective alternatives to incarceration are major catalysts. Furthermore, technological advancements in GPS tracking, radio frequency (RF) technology, and AI-powered analytics are enhancing the accuracy, reliability, and efficiency of EOM systems. Governments are increasingly adopting these solutions to improve public safety, reduce recidivism, and manage offender populations more effectively. The market is segmented by technology (RF and GPS) and offering (solutions and services), with GPS technology currently holding a significant market share due to its precise location tracking capabilities. The solutions segment dominates due to the high demand for comprehensive monitoring systems integrating hardware, software, and data analytics. The North American market, particularly the United States, is expected to remain a significant revenue contributor, driven by high adoption rates and advanced technological infrastructure. However, growing concerns regarding privacy and data security pose a significant restraint. The market is also witnessing the emergence of innovative solutions leveraging AI and machine learning for risk assessment and predictive policing, which will further shape market growth in the coming years.
The competitive landscape is characterized by a mix of established players and emerging technology companies. Key players like BI Incorporated, G4S Limited, and Securus Technologies are leveraging their extensive experience and established networks to maintain their market positions. Meanwhile, innovative startups are introducing new technologies and services, focusing on improving system accuracy, user experience, and data integration. Geographic expansion into developing markets and the integration of advanced analytics capabilities will be critical for market participants to gain a competitive edge. The continued development and integration of Artificial Intelligence (AI) and Internet of Things (IoT) technologies are poised to significantly influence future market growth by enhancing the accuracy, efficiency, and overall effectiveness of EOM solutions. This includes features like automated alerts, real-time risk assessments, and improved data visualization for law enforcement agencies.

Electronic Offender Monitoring Solutions Industry Report: 2019-2033
This comprehensive report provides a detailed analysis of the Electronic Offender Monitoring Solutions industry, offering actionable insights for stakeholders, investors, and industry professionals. Covering the period from 2019 to 2033, with a base year of 2025 and a forecast period of 2025-2033, this report delivers in-depth market sizing, segmentation, competitive landscape analysis, and future growth projections. The report uses USD Million for all values.
Electronic Offender Monitoring Solutions Industry Market Concentration & Innovation
The Electronic Offender Monitoring Solutions market exhibits a moderately concentrated landscape, with a few key players holding significant market share. The exact market share distribution among leading players like BI Incorporated, G4S Limited, Securus Technologies LLC, and others is dynamic and varies across geographical regions and product segments. However, the industry is witnessing increased innovation driven by technological advancements in GPS and RF technologies, as well as the development of AI-powered analytics for risk assessment and improved supervision. This innovation is further fueled by evolving regulatory frameworks that emphasize cost-effectiveness and enhanced community safety. Product substitutes, while limited, include traditional parole officer supervision, but electronic monitoring offers enhanced efficiency and cost savings. End-user trends indicate a growing preference for integrated solutions that combine various monitoring technologies with data analytics capabilities. M&A activity has been moderate, with deal values ranging from USD xx million to USD xx million in recent years, primarily focused on expanding geographical reach or enhancing technological capabilities. Examples include the exclusive agreement signed by B.I. Incorporated in October 2022.
Electronic Offender Monitoring Solutions Industry Industry Trends & Insights
The Electronic Offender Monitoring Solutions market is experiencing robust growth, projected to achieve a CAGR of xx% during the forecast period (2025-2033). Key market drivers include increasing crime rates globally, the growing adoption of community-based corrections programs to reduce prison overcrowding and costs, and the increasing demand for enhanced surveillance and risk management. Technological disruptions such as the integration of AI and machine learning for predictive analytics are driving higher efficiency and improved outcomes. Consumer preferences are shifting towards solutions that offer greater accuracy, reliability, and user-friendliness, resulting in a demand for sophisticated, yet intuitive systems. Competitive dynamics are characterized by intense competition among established players and emerging startups, focusing on innovation, cost optimization, and the expansion of service offerings. Market penetration of electronic monitoring solutions continues to grow, driven primarily by increasing government adoption and the effectiveness of these solutions in reducing recidivism.
Dominant Markets & Segments in Electronic Offender Monitoring Solutions Industry
The North American region holds a dominant position in the Electronic Offender Monitoring Solutions market, driven by factors including mature correctional systems, advanced technological infrastructure, and robust funding for public safety initiatives. Within North America, the United States demonstrates the highest market share.
Key Drivers in North America:
- Stringent government regulations and increased focus on public safety.
- Extensive adoption of advanced technologies, such as GPS and AI-powered analytics.
- Higher per-capita spending on corrections and law enforcement.
By Technology:
- GPS-based monitoring solutions are gaining traction due to their accuracy and real-time tracking capabilities.
- RF technology remains a significant segment, particularly for cost-sensitive applications.
By Offering:
- The solutions segment dominates the market, driven by the need for comprehensive, integrated systems.
- The services segment is growing rapidly, with increasing demand for monitoring and data analytics services.
The dominance of the North American region is also influenced by the presence of numerous key players and a more developed correctional infrastructure.
Electronic Offender Monitoring Solutions Industry Product Developments
Recent product innovations in the electronic offender monitoring solutions market include the development of more compact and user-friendly devices, the integration of AI-powered analytics for improved risk assessment, and the incorporation of biometric authentication features to enhance security. These technological advancements enhance the effectiveness and efficiency of offender monitoring programs, aligning with market demands for higher accuracy, improved risk management, and streamlined operations. The market fit for these new products is strong, as they address key challenges faced by correctional agencies, while improving community safety.
Report Scope & Segmentation Analysis
This report segments the Electronic Offender Monitoring Solutions market based on technology (Radio Frequency (RF) and Global Positioning System (GPS)) and offering (Solutions and Services). The RF segment is expected to experience moderate growth due to its cost-effectiveness, while the GPS segment will show faster growth due to improved accuracy and enhanced capabilities. The solutions segment is projected to maintain a larger market share compared to the services segment, although both are expected to witness significant expansion. Competitive dynamics within each segment vary, with intense competition among established players and the emergence of niche players catering to specific needs. The overall market size is expected to reach USD xx million by 2033, reflecting the market's significant growth potential.
Key Drivers of Electronic Offender Monitoring Solutions Industry Growth
Several key factors drive the growth of the Electronic Offender Monitoring Solutions industry. Firstly, escalating crime rates necessitate more efficient monitoring systems. Secondly, the rising adoption of community-based corrections programs, aiming to reduce prison overcrowding and associated costs, fuels the demand for electronic monitoring. Finally, technological advancements like AI and machine learning, enhancing risk assessment and management, are also key growth drivers. The shift towards data-driven decision-making and the increasing need to optimize resource allocation in correctional systems contributes to further market expansion.
Challenges in the Electronic Offender Monitoring Solutions Industry Sector
Challenges within the Electronic Offender Monitoring Solutions industry include regulatory hurdles in different jurisdictions, leading to variations in adoption rates and system standardization. Supply chain disruptions can impact the availability of components and increase manufacturing costs. Furthermore, intense competition among established and emerging players creates pressure on pricing and profitability. These factors, along with concerns about data privacy and security, present significant challenges to sustained industry growth. For example, the cost of implementation and the need for ongoing maintenance can limit adoption by smaller jurisdictions.
Emerging Opportunities in Electronic Offender Monitoring Solutions Industry
Emerging opportunities exist in expanding into new geographical markets, particularly in developing countries with growing correctional needs. The integration of advanced technologies like IoT and blockchain for improved data security and interoperability presents significant opportunities. Growing emphasis on remote monitoring capabilities opens up avenues for expansion. Finally, catering to the increasing demand for user-friendly and cost-effective solutions remains a key opportunity.
Leading Players in the Electronic Offender Monitoring Solutions Industry Market
- BI Incorporated
- Geosatis
- Upstreem
- Corrisoft com
- Synergye
- Supercom
- AMOS Spacecom
- Buddi AI
- G4S Limited
- Attenti
- Securus Technologies LLC
- Alcohol Monitoring Systems Inc (SCRAM Systems)
- TRACK GROUP
Key Developments in Electronic Offender Monitoring Solutions Industry Industry
October 2022: B.I. Incorporated secured an exclusive agreement with OMNIA Partners Public Sector, streamlining procurement for government agencies and boosting market access. This significantly impacted market dynamics by accelerating sales and reducing sales cycle time.
January 2022: Denver City Council's USD 1.5 million contract with B.I. Incorporated demonstrated the growing adoption of electronic monitoring solutions by municipalities. This contract showcases the increasing willingness of city governments to invest in innovative corrections technologies.
Strategic Outlook for Electronic Offender Monitoring Solutions Industry Market
The Electronic Offender Monitoring Solutions market is poised for sustained growth, driven by increasing crime rates, budget constraints on traditional incarceration, and ongoing technological advancements. The integration of AI, IoT, and other cutting-edge technologies will further enhance the efficiency and effectiveness of these solutions, driving adoption among correctional agencies worldwide. The market will continue to see consolidation through mergers and acquisitions, creating larger, more efficient providers. Opportunities exist in developing more sophisticated risk assessment tools and expanding into new geographical markets, thereby offering substantial growth potential over the forecast period.
Electronic Offender Monitoring Solutions Industry Segmentation
-
1. Technology
- 1.1. Radio Frequency (RF)
- 1.2. Global Positioning System (GPS)
-
2. Offering
- 2.1. Solutions
- 2.2. Services
Electronic Offender Monitoring Solutions Industry Segmentation By Geography
- 1. North America
- 2. Europe
- 3. Asia
- 4. Australia and New Zealand
- 5. Latin America
- 6. Middle East and Africa

Electronic Offender Monitoring Solutions Industry REPORT HIGHLIGHTS
| Aspects | Details |
|---|---|
| Study Period | 2019-2033 |
| Base Year | 2024 |
| Estimated Year | 2025 |
| Forecast Period | 2025-2033 |
| Historical Period | 2019-2024 |
| Growth Rate | CAGR of 9.50% from 2019-2033 |
| Segmentation |
|
Table of Contents
- 1. Introduction
- 1.1. Research Scope
- 1.2. Market Segmentation
- 1.3. Research Methodology
- 1.4. Definitions and Assumptions
- 2. Executive Summary
- 2.1. Introduction
- 3. Market Dynamics
- 3.1. Introduction
- 3.2. Market Drivers
- 3.2.1. The Prison Overcrowding Worsened by the COVID-19 Pandemic; Growing Adoption of Victim Protection Solutions
- 3.3. Market Restrains
- 3.3.1. Electronic Offender Monitoring Devices Can Be Tampered by Offenders
- 3.4. Market Trends
- 3.4.1. Global Positioning System Driving the Market Growth
- 4. Market Factor Analysis
- 4.1. Porters Five Forces
- 4.2. Supply/Value Chain
- 4.3. PESTEL analysis
- 4.4. Market Entropy
- 4.5. Patent/Trademark Analysis
- 5. Global Electronic Offender Monitoring Solutions Industry Analysis, Insights and Forecast, 2019-2031
- 5.1. Market Analysis, Insights and Forecast - by Technology
- 5.1.1. Radio Frequency (RF)
- 5.1.2. Global Positioning System (GPS)
- 5.2. Market Analysis, Insights and Forecast - by Offering
- 5.2.1. Solutions
- 5.2.2. Services
- 5.3. Market Analysis, Insights and Forecast - by Region
- 5.3.1. North America
- 5.3.2. Europe
- 5.3.3. Asia
- 5.3.4. Australia and New Zealand
- 5.3.5. Latin America
- 5.3.6. Middle East and Africa
- 5.1. Market Analysis, Insights and Forecast - by Technology
- 6. North America Electronic Offender Monitoring Solutions Industry Analysis, Insights and Forecast, 2019-2031
- 6.1. Market Analysis, Insights and Forecast - by Technology
- 6.1.1. Radio Frequency (RF)
- 6.1.2. Global Positioning System (GPS)
- 6.2. Market Analysis, Insights and Forecast - by Offering
- 6.2.1. Solutions
- 6.2.2. Services
- 6.1. Market Analysis, Insights and Forecast - by Technology
- 7. Europe Electronic Offender Monitoring Solutions Industry Analysis, Insights and Forecast, 2019-2031
- 7.1. Market Analysis, Insights and Forecast - by Technology
- 7.1.1. Radio Frequency (RF)
- 7.1.2. Global Positioning System (GPS)
- 7.2. Market Analysis, Insights and Forecast - by Offering
- 7.2.1. Solutions
- 7.2.2. Services
- 7.1. Market Analysis, Insights and Forecast - by Technology
- 8. Asia Electronic Offender Monitoring Solutions Industry Analysis, Insights and Forecast, 2019-2031
- 8.1. Market Analysis, Insights and Forecast - by Technology
- 8.1.1. Radio Frequency (RF)
- 8.1.2. Global Positioning System (GPS)
- 8.2. Market Analysis, Insights and Forecast - by Offering
- 8.2.1. Solutions
- 8.2.2. Services
- 8.1. Market Analysis, Insights and Forecast - by Technology
- 9. Australia and New Zealand Electronic Offender Monitoring Solutions Industry Analysis, Insights and Forecast, 2019-2031
- 9.1. Market Analysis, Insights and Forecast - by Technology
- 9.1.1. Radio Frequency (RF)
- 9.1.2. Global Positioning System (GPS)
- 9.2. Market Analysis, Insights and Forecast - by Offering
- 9.2.1. Solutions
- 9.2.2. Services
- 9.1. Market Analysis, Insights and Forecast - by Technology
- 10. Latin America Electronic Offender Monitoring Solutions Industry Analysis, Insights and Forecast, 2019-2031
- 10.1. Market Analysis, Insights and Forecast - by Technology
- 10.1.1. Radio Frequency (RF)
- 10.1.2. Global Positioning System (GPS)
- 10.2. Market Analysis, Insights and Forecast - by Offering
- 10.2.1. Solutions
- 10.2.2. Services
- 10.1. Market Analysis, Insights and Forecast - by Technology
- 11. Middle East and Africa Electronic Offender Monitoring Solutions Industry Analysis, Insights and Forecast, 2019-2031
- 11.1. Market Analysis, Insights and Forecast - by Technology
- 11.1.1. Radio Frequency (RF)
- 11.1.2. Global Positioning System (GPS)
- 11.2. Market Analysis, Insights and Forecast - by Offering
- 11.2.1. Solutions
- 11.2.2. Services
- 11.1. Market Analysis, Insights and Forecast - by Technology
- 12. North America Electronic Offender Monitoring Solutions Industry Analysis, Insights and Forecast, 2019-2031
- 12.1. Market Analysis, Insights and Forecast - By Country/Sub-region
- 12.1.1 United States
- 12.1.2 Canada
- 12.1.3 Mexico
- 13. Europe Electronic Offender Monitoring Solutions Industry Analysis, Insights and Forecast, 2019-2031
- 13.1. Market Analysis, Insights and Forecast - By Country/Sub-region
- 13.1.1 Germany
- 13.1.2 United Kingdom
- 13.1.3 France
- 13.1.4 Spain
- 13.1.5 Italy
- 13.1.6 Spain
- 13.1.7 Belgium
- 13.1.8 Netherland
- 13.1.9 Nordics
- 13.1.10 Rest of Europe
- 14. Asia Pacific Electronic Offender Monitoring Solutions Industry Analysis, Insights and Forecast, 2019-2031
- 14.1. Market Analysis, Insights and Forecast - By Country/Sub-region
- 14.1.1 China
- 14.1.2 Japan
- 14.1.3 India
- 14.1.4 South Korea
- 14.1.5 Southeast Asia
- 14.1.6 Australia
- 14.1.7 Indonesia
- 14.1.8 Phillipes
- 14.1.9 Singapore
- 14.1.10 Thailandc
- 14.1.11 Rest of Asia Pacific
- 15. South America Electronic Offender Monitoring Solutions Industry Analysis, Insights and Forecast, 2019-2031
- 15.1. Market Analysis, Insights and Forecast - By Country/Sub-region
- 15.1.1 Brazil
- 15.1.2 Argentina
- 15.1.3 Peru
- 15.1.4 Chile
- 15.1.5 Colombia
- 15.1.6 Ecuador
- 15.1.7 Venezuela
- 15.1.8 Rest of South America
- 16. North America Electronic Offender Monitoring Solutions Industry Analysis, Insights and Forecast, 2019-2031
- 16.1. Market Analysis, Insights and Forecast - By Country/Sub-region
- 16.1.1 United States
- 16.1.2 Canada
- 16.1.3 Mexico
- 17. MEA Electronic Offender Monitoring Solutions Industry Analysis, Insights and Forecast, 2019-2031
- 17.1. Market Analysis, Insights and Forecast - By Country/Sub-region
- 17.1.1 United Arab Emirates
- 17.1.2 Saudi Arabia
- 17.1.3 South Africa
- 17.1.4 Rest of Middle East and Africa
- 18. Competitive Analysis
- 18.1. Global Market Share Analysis 2024
- 18.2. Company Profiles
- 18.2.1 BI Incorporated
- 18.2.1.1. Overview
- 18.2.1.2. Products
- 18.2.1.3. SWOT Analysis
- 18.2.1.4. Recent Developments
- 18.2.1.5. Financials (Based on Availability)
- 18.2.2 Geosatis
- 18.2.2.1. Overview
- 18.2.2.2. Products
- 18.2.2.3. SWOT Analysis
- 18.2.2.4. Recent Developments
- 18.2.2.5. Financials (Based on Availability)
- 18.2.3 Upstreem
- 18.2.3.1. Overview
- 18.2.3.2. Products
- 18.2.3.3. SWOT Analysis
- 18.2.3.4. Recent Developments
- 18.2.3.5. Financials (Based on Availability)
- 18.2.4 Corrisoft com
- 18.2.4.1. Overview
- 18.2.4.2. Products
- 18.2.4.3. SWOT Analysis
- 18.2.4.4. Recent Developments
- 18.2.4.5. Financials (Based on Availability)
- 18.2.5 Synergye
- 18.2.5.1. Overview
- 18.2.5.2. Products
- 18.2.5.3. SWOT Analysis
- 18.2.5.4. Recent Developments
- 18.2.5.5. Financials (Based on Availability)
- 18.2.6 Supercom
- 18.2.6.1. Overview
- 18.2.6.2. Products
- 18.2.6.3. SWOT Analysis
- 18.2.6.4. Recent Developments
- 18.2.6.5. Financials (Based on Availability)
- 18.2.7 AMOS Spacecom
- 18.2.7.1. Overview
- 18.2.7.2. Products
- 18.2.7.3. SWOT Analysis
- 18.2.7.4. Recent Developments
- 18.2.7.5. Financials (Based on Availability)
- 18.2.8 Buddi AI
- 18.2.8.1. Overview
- 18.2.8.2. Products
- 18.2.8.3. SWOT Analysis
- 18.2.8.4. Recent Developments
- 18.2.8.5. Financials (Based on Availability)
- 18.2.9 G4S Limited
- 18.2.9.1. Overview
- 18.2.9.2. Products
- 18.2.9.3. SWOT Analysis
- 18.2.9.4. Recent Developments
- 18.2.9.5. Financials (Based on Availability)
- 18.2.10 Attenti
- 18.2.10.1. Overview
- 18.2.10.2. Products
- 18.2.10.3. SWOT Analysis
- 18.2.10.4. Recent Developments
- 18.2.10.5. Financials (Based on Availability)
- 18.2.11 Securus Technologies LLC
- 18.2.11.1. Overview
- 18.2.11.2. Products
- 18.2.11.3. SWOT Analysis
- 18.2.11.4. Recent Developments
- 18.2.11.5. Financials (Based on Availability)
- 18.2.12 Alcohol Monitoring Systems Inc (SCRAM Systems)
- 18.2.12.1. Overview
- 18.2.12.2. Products
- 18.2.12.3. SWOT Analysis
- 18.2.12.4. Recent Developments
- 18.2.12.5. Financials (Based on Availability)
- 18.2.13 TRACK GROUP
- 18.2.13.1. Overview
- 18.2.13.2. Products
- 18.2.13.3. SWOT Analysis
- 18.2.13.4. Recent Developments
- 18.2.13.5. Financials (Based on Availability)
- 18.2.1 BI Incorporated
List of Figures
- Figure 1: Global Electronic Offender Monitoring Solutions Industry Revenue Breakdown (Million, %) by Region 2024 & 2032
- Figure 2: Global Electronic Offender Monitoring Solutions Industry Volume Breakdown (K Unit, %) by Region 2024 & 2032
- Figure 3: North America Electronic Offender Monitoring Solutions Industry Revenue (Million), by Country 2024 & 2032
- Figure 4: North America Electronic Offender Monitoring Solutions Industry Volume (K Unit), by Country 2024 & 2032
- Figure 5: North America Electronic Offender Monitoring Solutions Industry Revenue Share (%), by Country 2024 & 2032
- Figure 6: North America Electronic Offender Monitoring Solutions Industry Volume Share (%), by Country 2024 & 2032
- Figure 7: Europe Electronic Offender Monitoring Solutions Industry Revenue (Million), by Country 2024 & 2032
- Figure 8: Europe Electronic Offender Monitoring Solutions Industry Volume (K Unit), by Country 2024 & 2032
- Figure 9: Europe Electronic Offender Monitoring Solutions Industry Revenue Share (%), by Country 2024 & 2032
- Figure 10: Europe Electronic Offender Monitoring Solutions Industry Volume Share (%), by Country 2024 & 2032
- Figure 11: Asia Pacific Electronic Offender Monitoring Solutions Industry Revenue (Million), by Country 2024 & 2032
- Figure 12: Asia Pacific Electronic Offender Monitoring Solutions Industry Volume (K Unit), by Country 2024 & 2032
- Figure 13: Asia Pacific Electronic Offender Monitoring Solutions Industry Revenue Share (%), by Country 2024 & 2032
- Figure 14: Asia Pacific Electronic Offender Monitoring Solutions Industry Volume Share (%), by Country 2024 & 2032
- Figure 15: South America Electronic Offender Monitoring Solutions Industry Revenue (Million), by Country 2024 & 2032
- Figure 16: South America Electronic Offender Monitoring Solutions Industry Volume (K Unit), by Country 2024 & 2032
- Figure 17: South America Electronic Offender Monitoring Solutions Industry Revenue Share (%), by Country 2024 & 2032
- Figure 18: South America Electronic Offender Monitoring Solutions Industry Volume Share (%), by Country 2024 & 2032
- Figure 19: North America Electronic Offender Monitoring Solutions Industry Revenue (Million), by Country 2024 & 2032
- Figure 20: North America Electronic Offender Monitoring Solutions Industry Volume (K Unit), by Country 2024 & 2032
- Figure 21: North America Electronic Offender Monitoring Solutions Industry Revenue Share (%), by Country 2024 & 2032
- Figure 22: North America Electronic Offender Monitoring Solutions Industry Volume Share (%), by Country 2024 & 2032
- Figure 23: MEA Electronic Offender Monitoring Solutions Industry Revenue (Million), by Country 2024 & 2032
- Figure 24: MEA Electronic Offender Monitoring Solutions Industry Volume (K Unit), by Country 2024 & 2032
- Figure 25: MEA Electronic Offender Monitoring Solutions Industry Revenue Share (%), by Country 2024 & 2032
- Figure 26: MEA Electronic Offender Monitoring Solutions Industry Volume Share (%), by Country 2024 & 2032
- Figure 27: North America Electronic Offender Monitoring Solutions Industry Revenue (Million), by Technology 2024 & 2032
- Figure 28: North America Electronic Offender Monitoring Solutions Industry Volume (K Unit), by Technology 2024 & 2032
- Figure 29: North America Electronic Offender Monitoring Solutions Industry Revenue Share (%), by Technology 2024 & 2032
- Figure 30: North America Electronic Offender Monitoring Solutions Industry Volume Share (%), by Technology 2024 & 2032
- Figure 31: North America Electronic Offender Monitoring Solutions Industry Revenue (Million), by Offering 2024 & 2032
- Figure 32: North America Electronic Offender Monitoring Solutions Industry Volume (K Unit), by Offering 2024 & 2032
- Figure 33: North America Electronic Offender Monitoring Solutions Industry Revenue Share (%), by Offering 2024 & 2032
- Figure 34: North America Electronic Offender Monitoring Solutions Industry Volume Share (%), by Offering 2024 & 2032
- Figure 35: North America Electronic Offender Monitoring Solutions Industry Revenue (Million), by Country 2024 & 2032
- Figure 36: North America Electronic Offender Monitoring Solutions Industry Volume (K Unit), by Country 2024 & 2032
- Figure 37: North America Electronic Offender Monitoring Solutions Industry Revenue Share (%), by Country 2024 & 2032
- Figure 38: North America Electronic Offender Monitoring Solutions Industry Volume Share (%), by Country 2024 & 2032
- Figure 39: Europe Electronic Offender Monitoring Solutions Industry Revenue (Million), by Technology 2024 & 2032
- Figure 40: Europe Electronic Offender Monitoring Solutions Industry Volume (K Unit), by Technology 2024 & 2032
- Figure 41: Europe Electronic Offender Monitoring Solutions Industry Revenue Share (%), by Technology 2024 & 2032
- Figure 42: Europe Electronic Offender Monitoring Solutions Industry Volume Share (%), by Technology 2024 & 2032
- Figure 43: Europe Electronic Offender Monitoring Solutions Industry Revenue (Million), by Offering 2024 & 2032
- Figure 44: Europe Electronic Offender Monitoring Solutions Industry Volume (K Unit), by Offering 2024 & 2032
- Figure 45: Europe Electronic Offender Monitoring Solutions Industry Revenue Share (%), by Offering 2024 & 2032
- Figure 46: Europe Electronic Offender Monitoring Solutions Industry Volume Share (%), by Offering 2024 & 2032
- Figure 47: Europe Electronic Offender Monitoring Solutions Industry Revenue (Million), by Country 2024 & 2032
- Figure 48: Europe Electronic Offender Monitoring Solutions Industry Volume (K Unit), by Country 2024 & 2032
- Figure 49: Europe Electronic Offender Monitoring Solutions Industry Revenue Share (%), by Country 2024 & 2032
- Figure 50: Europe Electronic Offender Monitoring Solutions Industry Volume Share (%), by Country 2024 & 2032
- Figure 51: Asia Electronic Offender Monitoring Solutions Industry Revenue (Million), by Technology 2024 & 2032
- Figure 52: Asia Electronic Offender Monitoring Solutions Industry Volume (K Unit), by Technology 2024 & 2032
- Figure 53: Asia Electronic Offender Monitoring Solutions Industry Revenue Share (%), by Technology 2024 & 2032
- Figure 54: Asia Electronic Offender Monitoring Solutions Industry Volume Share (%), by Technology 2024 & 2032
- Figure 55: Asia Electronic Offender Monitoring Solutions Industry Revenue (Million), by Offering 2024 & 2032
- Figure 56: Asia Electronic Offender Monitoring Solutions Industry Volume (K Unit), by Offering 2024 & 2032
- Figure 57: Asia Electronic Offender Monitoring Solutions Industry Revenue Share (%), by Offering 2024 & 2032
- Figure 58: Asia Electronic Offender Monitoring Solutions Industry Volume Share (%), by Offering 2024 & 2032
- Figure 59: Asia Electronic Offender Monitoring Solutions Industry Revenue (Million), by Country 2024 & 2032
- Figure 60: Asia Electronic Offender Monitoring Solutions Industry Volume (K Unit), by Country 2024 & 2032
- Figure 61: Asia Electronic Offender Monitoring Solutions Industry Revenue Share (%), by Country 2024 & 2032
- Figure 62: Asia Electronic Offender Monitoring Solutions Industry Volume Share (%), by Country 2024 & 2032
- Figure 63: Australia and New Zealand Electronic Offender Monitoring Solutions Industry Revenue (Million), by Technology 2024 & 2032
- Figure 64: Australia and New Zealand Electronic Offender Monitoring Solutions Industry Volume (K Unit), by Technology 2024 & 2032
- Figure 65: Australia and New Zealand Electronic Offender Monitoring Solutions Industry Revenue Share (%), by Technology 2024 & 2032
- Figure 66: Australia and New Zealand Electronic Offender Monitoring Solutions Industry Volume Share (%), by Technology 2024 & 2032
- Figure 67: Australia and New Zealand Electronic Offender Monitoring Solutions Industry Revenue (Million), by Offering 2024 & 2032
- Figure 68: Australia and New Zealand Electronic Offender Monitoring Solutions Industry Volume (K Unit), by Offering 2024 & 2032
- Figure 69: Australia and New Zealand Electronic Offender Monitoring Solutions Industry Revenue Share (%), by Offering 2024 & 2032
- Figure 70: Australia and New Zealand Electronic Offender Monitoring Solutions Industry Volume Share (%), by Offering 2024 & 2032
- Figure 71: Australia and New Zealand Electronic Offender Monitoring Solutions Industry Revenue (Million), by Country 2024 & 2032
- Figure 72: Australia and New Zealand Electronic Offender Monitoring Solutions Industry Volume (K Unit), by Country 2024 & 2032
- Figure 73: Australia and New Zealand Electronic Offender Monitoring Solutions Industry Revenue Share (%), by Country 2024 & 2032
- Figure 74: Australia and New Zealand Electronic Offender Monitoring Solutions Industry Volume Share (%), by Country 2024 & 2032
- Figure 75: Latin America Electronic Offender Monitoring Solutions Industry Revenue (Million), by Technology 2024 & 2032
- Figure 76: Latin America Electronic Offender Monitoring Solutions Industry Volume (K Unit), by Technology 2024 & 2032
- Figure 77: Latin America Electronic Offender Monitoring Solutions Industry Revenue Share (%), by Technology 2024 & 2032
- Figure 78: Latin America Electronic Offender Monitoring Solutions Industry Volume Share (%), by Technology 2024 & 2032
- Figure 79: Latin America Electronic Offender Monitoring Solutions Industry Revenue (Million), by Offering 2024 & 2032
- Figure 80: Latin America Electronic Offender Monitoring Solutions Industry Volume (K Unit), by Offering 2024 & 2032
- Figure 81: Latin America Electronic Offender Monitoring Solutions Industry Revenue Share (%), by Offering 2024 & 2032
- Figure 82: Latin America Electronic Offender Monitoring Solutions Industry Volume Share (%), by Offering 2024 & 2032
- Figure 83: Latin America Electronic Offender Monitoring Solutions Industry Revenue (Million), by Country 2024 & 2032
- Figure 84: Latin America Electronic Offender Monitoring Solutions Industry Volume (K Unit), by Country 2024 & 2032
- Figure 85: Latin America Electronic Offender Monitoring Solutions Industry Revenue Share (%), by Country 2024 & 2032
- Figure 86: Latin America Electronic Offender Monitoring Solutions Industry Volume Share (%), by Country 2024 & 2032
- Figure 87: Middle East and Africa Electronic Offender Monitoring Solutions Industry Revenue (Million), by Technology 2024 & 2032
- Figure 88: Middle East and Africa Electronic Offender Monitoring Solutions Industry Volume (K Unit), by Technology 2024 & 2032
- Figure 89: Middle East and Africa Electronic Offender Monitoring Solutions Industry Revenue Share (%), by Technology 2024 & 2032
- Figure 90: Middle East and Africa Electronic Offender Monitoring Solutions Industry Volume Share (%), by Technology 2024 & 2032
- Figure 91: Middle East and Africa Electronic Offender Monitoring Solutions Industry Revenue (Million), by Offering 2024 & 2032
- Figure 92: Middle East and Africa Electronic Offender Monitoring Solutions Industry Volume (K Unit), by Offering 2024 & 2032
- Figure 93: Middle East and Africa Electronic Offender Monitoring Solutions Industry Revenue Share (%), by Offering 2024 & 2032
- Figure 94: Middle East and Africa Electronic Offender Monitoring Solutions Industry Volume Share (%), by Offering 2024 & 2032
- Figure 95: Middle East and Africa Electronic Offender Monitoring Solutions Industry Revenue (Million), by Country 2024 & 2032
- Figure 96: Middle East and Africa Electronic Offender Monitoring Solutions Industry Volume (K Unit), by Country 2024 & 2032
- Figure 97: Middle East and Africa Electronic Offender Monitoring Solutions Industry Revenue Share (%), by Country 2024 & 2032
- Figure 98: Middle East and Africa Electronic Offender Monitoring Solutions Industry Volume Share (%), by Country 2024 & 2032
List of Tables
- Table 1: Global Electronic Offender Monitoring Solutions Industry Revenue Million Forecast, by Region 2019 & 2032
- Table 2: Global Electronic Offender Monitoring Solutions Industry Volume K Unit Forecast, by Region 2019 & 2032
- Table 3: Global Electronic Offender Monitoring Solutions Industry Revenue Million Forecast, by Technology 2019 & 2032
- Table 4: Global Electronic Offender Monitoring Solutions Industry Volume K Unit Forecast, by Technology 2019 & 2032
- Table 5: Global Electronic Offender Monitoring Solutions Industry Revenue Million Forecast, by Offering 2019 & 2032
- Table 6: Global Electronic Offender Monitoring Solutions Industry Volume K Unit Forecast, by Offering 2019 & 2032
- Table 7: Global Electronic Offender Monitoring Solutions Industry Revenue Million Forecast, by Region 2019 & 2032
- Table 8: Global Electronic Offender Monitoring Solutions Industry Volume K Unit Forecast, by Region 2019 & 2032
- Table 9: Global Electronic Offender Monitoring Solutions Industry Revenue Million Forecast, by Country 2019 & 2032
- Table 10: Global Electronic Offender Monitoring Solutions Industry Volume K Unit Forecast, by Country 2019 & 2032
- Table 11: United States Electronic Offender Monitoring Solutions Industry Revenue (Million) Forecast, by Application 2019 & 2032
- Table 12: United States Electronic Offender Monitoring Solutions Industry Volume (K Unit) Forecast, by Application 2019 & 2032
- Table 13: Canada Electronic Offender Monitoring Solutions Industry Revenue (Million) Forecast, by Application 2019 & 2032
- Table 14: Canada Electronic Offender Monitoring Solutions Industry Volume (K Unit) Forecast, by Application 2019 & 2032
- Table 15: Mexico Electronic Offender Monitoring Solutions Industry Revenue (Million) Forecast, by Application 2019 & 2032
- Table 16: Mexico Electronic Offender Monitoring Solutions Industry Volume (K Unit) Forecast, by Application 2019 & 2032
- Table 17: Global Electronic Offender Monitoring Solutions Industry Revenue Million Forecast, by Country 2019 & 2032
- Table 18: Global Electronic Offender Monitoring Solutions Industry Volume K Unit Forecast, by Country 2019 & 2032
- Table 19: Germany Electronic Offender Monitoring Solutions Industry Revenue (Million) Forecast, by Application 2019 & 2032
- Table 20: Germany Electronic Offender Monitoring Solutions Industry Volume (K Unit) Forecast, by Application 2019 & 2032
- Table 21: United Kingdom Electronic Offender Monitoring Solutions Industry Revenue (Million) Forecast, by Application 2019 & 2032
- Table 22: United Kingdom Electronic Offender Monitoring Solutions Industry Volume (K Unit) Forecast, by Application 2019 & 2032
- Table 23: France Electronic Offender Monitoring Solutions Industry Revenue (Million) Forecast, by Application 2019 & 2032
- Table 24: France Electronic Offender Monitoring Solutions Industry Volume (K Unit) Forecast, by Application 2019 & 2032
- Table 25: Spain Electronic Offender Monitoring Solutions Industry Revenue (Million) Forecast, by Application 2019 & 2032
- Table 26: Spain Electronic Offender Monitoring Solutions Industry Volume (K Unit) Forecast, by Application 2019 & 2032
- Table 27: Italy Electronic Offender Monitoring Solutions Industry Revenue (Million) Forecast, by Application 2019 & 2032
- Table 28: Italy Electronic Offender Monitoring Solutions Industry Volume (K Unit) Forecast, by Application 2019 & 2032
- Table 29: Spain Electronic Offender Monitoring Solutions Industry Revenue (Million) Forecast, by Application 2019 & 2032
- Table 30: Spain Electronic Offender Monitoring Solutions Industry Volume (K Unit) Forecast, by Application 2019 & 2032
- Table 31: Belgium Electronic Offender Monitoring Solutions Industry Revenue (Million) Forecast, by Application 2019 & 2032
- Table 32: Belgium Electronic Offender Monitoring Solutions Industry Volume (K Unit) Forecast, by Application 2019 & 2032
- Table 33: Netherland Electronic Offender Monitoring Solutions Industry Revenue (Million) Forecast, by Application 2019 & 2032
- Table 34: Netherland Electronic Offender Monitoring Solutions Industry Volume (K Unit) Forecast, by Application 2019 & 2032
- Table 35: Nordics Electronic Offender Monitoring Solutions Industry Revenue (Million) Forecast, by Application 2019 & 2032
- Table 36: Nordics Electronic Offender Monitoring Solutions Industry Volume (K Unit) Forecast, by Application 2019 & 2032
- Table 37: Rest of Europe Electronic Offender Monitoring Solutions Industry Revenue (Million) Forecast, by Application 2019 & 2032
- Table 38: Rest of Europe Electronic Offender Monitoring Solutions Industry Volume (K Unit) Forecast, by Application 2019 & 2032
- Table 39: Global Electronic Offender Monitoring Solutions Industry Revenue Million Forecast, by Country 2019 & 2032
- Table 40: Global Electronic Offender Monitoring Solutions Industry Volume K Unit Forecast, by Country 2019 & 2032
- Table 41: China Electronic Offender Monitoring Solutions Industry Revenue (Million) Forecast, by Application 2019 & 2032
- Table 42: China Electronic Offender Monitoring Solutions Industry Volume (K Unit) Forecast, by Application 2019 & 2032
- Table 43: Japan Electronic Offender Monitoring Solutions Industry Revenue (Million) Forecast, by Application 2019 & 2032
- Table 44: Japan Electronic Offender Monitoring Solutions Industry Volume (K Unit) Forecast, by Application 2019 & 2032
- Table 45: India Electronic Offender Monitoring Solutions Industry Revenue (Million) Forecast, by Application 2019 & 2032
- Table 46: India Electronic Offender Monitoring Solutions Industry Volume (K Unit) Forecast, by Application 2019 & 2032
- Table 47: South Korea Electronic Offender Monitoring Solutions Industry Revenue (Million) Forecast, by Application 2019 & 2032
- Table 48: South Korea Electronic Offender Monitoring Solutions Industry Volume (K Unit) Forecast, by Application 2019 & 2032
- Table 49: Southeast Asia Electronic Offender Monitoring Solutions Industry Revenue (Million) Forecast, by Application 2019 & 2032
- Table 50: Southeast Asia Electronic Offender Monitoring Solutions Industry Volume (K Unit) Forecast, by Application 2019 & 2032
- Table 51: Australia Electronic Offender Monitoring Solutions Industry Revenue (Million) Forecast, by Application 2019 & 2032
- Table 52: Australia Electronic Offender Monitoring Solutions Industry Volume (K Unit) Forecast, by Application 2019 & 2032
- Table 53: Indonesia Electronic Offender Monitoring Solutions Industry Revenue (Million) Forecast, by Application 2019 & 2032
- Table 54: Indonesia Electronic Offender Monitoring Solutions Industry Volume (K Unit) Forecast, by Application 2019 & 2032
- Table 55: Phillipes Electronic Offender Monitoring Solutions Industry Revenue (Million) Forecast, by Application 2019 & 2032
- Table 56: Phillipes Electronic Offender Monitoring Solutions Industry Volume (K Unit) Forecast, by Application 2019 & 2032
- Table 57: Singapore Electronic Offender Monitoring Solutions Industry Revenue (Million) Forecast, by Application 2019 & 2032
- Table 58: Singapore Electronic Offender Monitoring Solutions Industry Volume (K Unit) Forecast, by Application 2019 & 2032
- Table 59: Thailandc Electronic Offender Monitoring Solutions Industry Revenue (Million) Forecast, by Application 2019 & 2032
- Table 60: Thailandc Electronic Offender Monitoring Solutions Industry Volume (K Unit) Forecast, by Application 2019 & 2032
- Table 61: Rest of Asia Pacific Electronic Offender Monitoring Solutions Industry Revenue (Million) Forecast, by Application 2019 & 2032
- Table 62: Rest of Asia Pacific Electronic Offender Monitoring Solutions Industry Volume (K Unit) Forecast, by Application 2019 & 2032
- Table 63: Global Electronic Offender Monitoring Solutions Industry Revenue Million Forecast, by Country 2019 & 2032
- Table 64: Global Electronic Offender Monitoring Solutions Industry Volume K Unit Forecast, by Country 2019 & 2032
- Table 65: Brazil Electronic Offender Monitoring Solutions Industry Revenue (Million) Forecast, by Application 2019 & 2032
- Table 66: Brazil Electronic Offender Monitoring Solutions Industry Volume (K Unit) Forecast, by Application 2019 & 2032
- Table 67: Argentina Electronic Offender Monitoring Solutions Industry Revenue (Million) Forecast, by Application 2019 & 2032
- Table 68: Argentina Electronic Offender Monitoring Solutions Industry Volume (K Unit) Forecast, by Application 2019 & 2032
- Table 69: Peru Electronic Offender Monitoring Solutions Industry Revenue (Million) Forecast, by Application 2019 & 2032
- Table 70: Peru Electronic Offender Monitoring Solutions Industry Volume (K Unit) Forecast, by Application 2019 & 2032
- Table 71: Chile Electronic Offender Monitoring Solutions Industry Revenue (Million) Forecast, by Application 2019 & 2032
- Table 72: Chile Electronic Offender Monitoring Solutions Industry Volume (K Unit) Forecast, by Application 2019 & 2032
- Table 73: Colombia Electronic Offender Monitoring Solutions Industry Revenue (Million) Forecast, by Application 2019 & 2032
- Table 74: Colombia Electronic Offender Monitoring Solutions Industry Volume (K Unit) Forecast, by Application 2019 & 2032
- Table 75: Ecuador Electronic Offender Monitoring Solutions Industry Revenue (Million) Forecast, by Application 2019 & 2032
- Table 76: Ecuador Electronic Offender Monitoring Solutions Industry Volume (K Unit) Forecast, by Application 2019 & 2032
- Table 77: Venezuela Electronic Offender Monitoring Solutions Industry Revenue (Million) Forecast, by Application 2019 & 2032
- Table 78: Venezuela Electronic Offender Monitoring Solutions Industry Volume (K Unit) Forecast, by Application 2019 & 2032
- Table 79: Rest of South America Electronic Offender Monitoring Solutions Industry Revenue (Million) Forecast, by Application 2019 & 2032
- Table 80: Rest of South America Electronic Offender Monitoring Solutions Industry Volume (K Unit) Forecast, by Application 2019 & 2032
- Table 81: Global Electronic Offender Monitoring Solutions Industry Revenue Million Forecast, by Country 2019 & 2032
- Table 82: Global Electronic Offender Monitoring Solutions Industry Volume K Unit Forecast, by Country 2019 & 2032
- Table 83: United States Electronic Offender Monitoring Solutions Industry Revenue (Million) Forecast, by Application 2019 & 2032
- Table 84: United States Electronic Offender Monitoring Solutions Industry Volume (K Unit) Forecast, by Application 2019 & 2032
- Table 85: Canada Electronic Offender Monitoring Solutions Industry Revenue (Million) Forecast, by Application 2019 & 2032
- Table 86: Canada Electronic Offender Monitoring Solutions Industry Volume (K Unit) Forecast, by Application 2019 & 2032
- Table 87: Mexico Electronic Offender Monitoring Solutions Industry Revenue (Million) Forecast, by Application 2019 & 2032
- Table 88: Mexico Electronic Offender Monitoring Solutions Industry Volume (K Unit) Forecast, by Application 2019 & 2032
- Table 89: Global Electronic Offender Monitoring Solutions Industry Revenue Million Forecast, by Country 2019 & 2032
- Table 90: Global Electronic Offender Monitoring Solutions Industry Volume K Unit Forecast, by Country 2019 & 2032
- Table 91: United Arab Emirates Electronic Offender Monitoring Solutions Industry Revenue (Million) Forecast, by Application 2019 & 2032
- Table 92: United Arab Emirates Electronic Offender Monitoring Solutions Industry Volume (K Unit) Forecast, by Application 2019 & 2032
- Table 93: Saudi Arabia Electronic Offender Monitoring Solutions Industry Revenue (Million) Forecast, by Application 2019 & 2032
- Table 94: Saudi Arabia Electronic Offender Monitoring Solutions Industry Volume (K Unit) Forecast, by Application 2019 & 2032
- Table 95: South Africa Electronic Offender Monitoring Solutions Industry Revenue (Million) Forecast, by Application 2019 & 2032
- Table 96: South Africa Electronic Offender Monitoring Solutions Industry Volume (K Unit) Forecast, by Application 2019 & 2032
- Table 97: Rest of Middle East and Africa Electronic Offender Monitoring Solutions Industry Revenue (Million) Forecast, by Application 2019 & 2032
- Table 98: Rest of Middle East and Africa Electronic Offender Monitoring Solutions Industry Volume (K Unit) Forecast, by Application 2019 & 2032
- Table 99: Global Electronic Offender Monitoring Solutions Industry Revenue Million Forecast, by Technology 2019 & 2032
- Table 100: Global Electronic Offender Monitoring Solutions Industry Volume K Unit Forecast, by Technology 2019 & 2032
- Table 101: Global Electronic Offender Monitoring Solutions Industry Revenue Million Forecast, by Offering 2019 & 2032
- Table 102: Global Electronic Offender Monitoring Solutions Industry Volume K Unit Forecast, by Offering 2019 & 2032
- Table 103: Global Electronic Offender Monitoring Solutions Industry Revenue Million Forecast, by Country 2019 & 2032
- Table 104: Global Electronic Offender Monitoring Solutions Industry Volume K Unit Forecast, by Country 2019 & 2032
- Table 105: Global Electronic Offender Monitoring Solutions Industry Revenue Million Forecast, by Technology 2019 & 2032
- Table 106: Global Electronic Offender Monitoring Solutions Industry Volume K Unit Forecast, by Technology 2019 & 2032
- Table 107: Global Electronic Offender Monitoring Solutions Industry Revenue Million Forecast, by Offering 2019 & 2032
- Table 108: Global Electronic Offender Monitoring Solutions Industry Volume K Unit Forecast, by Offering 2019 & 2032
- Table 109: Global Electronic Offender Monitoring Solutions Industry Revenue Million Forecast, by Country 2019 & 2032
- Table 110: Global Electronic Offender Monitoring Solutions Industry Volume K Unit Forecast, by Country 2019 & 2032
- Table 111: Global Electronic Offender Monitoring Solutions Industry Revenue Million Forecast, by Technology 2019 & 2032
- Table 112: Global Electronic Offender Monitoring Solutions Industry Volume K Unit Forecast, by Technology 2019 & 2032
- Table 113: Global Electronic Offender Monitoring Solutions Industry Revenue Million Forecast, by Offering 2019 & 2032
- Table 114: Global Electronic Offender Monitoring Solutions Industry Volume K Unit Forecast, by Offering 2019 & 2032
- Table 115: Global Electronic Offender Monitoring Solutions Industry Revenue Million Forecast, by Country 2019 & 2032
- Table 116: Global Electronic Offender Monitoring Solutions Industry Volume K Unit Forecast, by Country 2019 & 2032
- Table 117: Global Electronic Offender Monitoring Solutions Industry Revenue Million Forecast, by Technology 2019 & 2032
- Table 118: Global Electronic Offender Monitoring Solutions Industry Volume K Unit Forecast, by Technology 2019 & 2032
- Table 119: Global Electronic Offender Monitoring Solutions Industry Revenue Million Forecast, by Offering 2019 & 2032
- Table 120: Global Electronic Offender Monitoring Solutions Industry Volume K Unit Forecast, by Offering 2019 & 2032
- Table 121: Global Electronic Offender Monitoring Solutions Industry Revenue Million Forecast, by Country 2019 & 2032
- Table 122: Global Electronic Offender Monitoring Solutions Industry Volume K Unit Forecast, by Country 2019 & 2032
- Table 123: Global Electronic Offender Monitoring Solutions Industry Revenue Million Forecast, by Technology 2019 & 2032
- Table 124: Global Electronic Offender Monitoring Solutions Industry Volume K Unit Forecast, by Technology 2019 & 2032
- Table 125: Global Electronic Offender Monitoring Solutions Industry Revenue Million Forecast, by Offering 2019 & 2032
- Table 126: Global Electronic Offender Monitoring Solutions Industry Volume K Unit Forecast, by Offering 2019 & 2032
- Table 127: Global Electronic Offender Monitoring Solutions Industry Revenue Million Forecast, by Country 2019 & 2032
- Table 128: Global Electronic Offender Monitoring Solutions Industry Volume K Unit Forecast, by Country 2019 & 2032
- Table 129: Global Electronic Offender Monitoring Solutions Industry Revenue Million Forecast, by Technology 2019 & 2032
- Table 130: Global Electronic Offender Monitoring Solutions Industry Volume K Unit Forecast, by Technology 2019 & 2032
- Table 131: Global Electronic Offender Monitoring Solutions Industry Revenue Million Forecast, by Offering 2019 & 2032
- Table 132: Global Electronic Offender Monitoring Solutions Industry Volume K Unit Forecast, by Offering 2019 & 2032
- Table 133: Global Electronic Offender Monitoring Solutions Industry Revenue Million Forecast, by Country 2019 & 2032
- Table 134: Global Electronic Offender Monitoring Solutions Industry Volume K Unit Forecast, by Country 2019 & 2032
Frequently Asked Questions
1. What is the projected Compound Annual Growth Rate (CAGR) of the Electronic Offender Monitoring Solutions Industry?
The projected CAGR is approximately 9.50%.
2. Which companies are prominent players in the Electronic Offender Monitoring Solutions Industry?
Key companies in the market include BI Incorporated, Geosatis, Upstreem, Corrisoft com, Synergye, Supercom, AMOS Spacecom, Buddi AI, G4S Limited, Attenti, Securus Technologies LLC, Alcohol Monitoring Systems Inc (SCRAM Systems), TRACK GROUP.
3. What are the main segments of the Electronic Offender Monitoring Solutions Industry?
The market segments include Technology, Offering.
4. Can you provide details about the market size?
The market size is estimated to be USD 1.34 Million as of 2022.
5. What are some drivers contributing to market growth?
The Prison Overcrowding Worsened by the COVID-19 Pandemic; Growing Adoption of Victim Protection Solutions.
6. What are the notable trends driving market growth?
Global Positioning System Driving the Market Growth.
7. Are there any restraints impacting market growth?
Electronic Offender Monitoring Devices Can Be Tampered by Offenders.
8. Can you provide examples of recent developments in the market?
October 2022: B.I. Incorporated, the U.S. player for electronic monitoring products and services, entered an exclusive agreement with OMNIA Partners Public Sector that allowed national city, county, and state government agencies to contract with B.I. for its community corrections supervision technologies at competitive costs. Participating agencies save time and effort by skipping the lengthy Request for Proposal process.
9. What pricing options are available for accessing the report?
Pricing options include single-user, multi-user, and enterprise licenses priced at USD 4750, USD 5250, and USD 8750 respectively.
10. Is the market size provided in terms of value or volume?
The market size is provided in terms of value, measured in Million and volume, measured in K Unit.
11. Are there any specific market keywords associated with the report?
Yes, the market keyword associated with the report is "Electronic Offender Monitoring Solutions Industry," which aids in identifying and referencing the specific market segment covered.
12. How do I determine which pricing option suits my needs best?
The pricing options vary based on user requirements and access needs. Individual users may opt for single-user licenses, while businesses requiring broader access may choose multi-user or enterprise licenses for cost-effective access to the report.
13. Are there any additional resources or data provided in the Electronic Offender Monitoring Solutions Industry report?
While the report offers comprehensive insights, it's advisable to review the specific contents or supplementary materials provided to ascertain if additional resources or data are available.
14. How can I stay updated on further developments or reports in the Electronic Offender Monitoring Solutions Industry?
To stay informed about further developments, trends, and reports in the Electronic Offender Monitoring Solutions Industry, consider subscribing to industry newsletters, following relevant companies and organizations, or regularly checking reputable industry news sources and publications.
Methodology
Step 1 - Identification of Relevant Samples Size from Population Database


Step 2 - Approaches for Defining Global Market Size (Value, Volume* & Price*)

Note*: In applicable scenarios
Step 3 - Data Sources
Primary Research
- Web Analytics
- Survey Reports
- Research Institute
- Latest Research Reports
- Opinion Leaders
Secondary Research
- Annual Reports
- White Paper
- Latest Press Release
- Industry Association
- Paid Database
- Investor Presentations

Step 4 - Data Triangulation
Involves using different sources of information in order to increase the validity of a study
These sources are likely to be stakeholders in a program - participants, other researchers, program staff, other community members, and so on.
Then we put all data in single framework & apply various statistical tools to find out the dynamic on the market.
During the analysis stage, feedback from the stakeholder groups would be compared to determine areas of agreement as well as areas of divergence


