

Key Insights
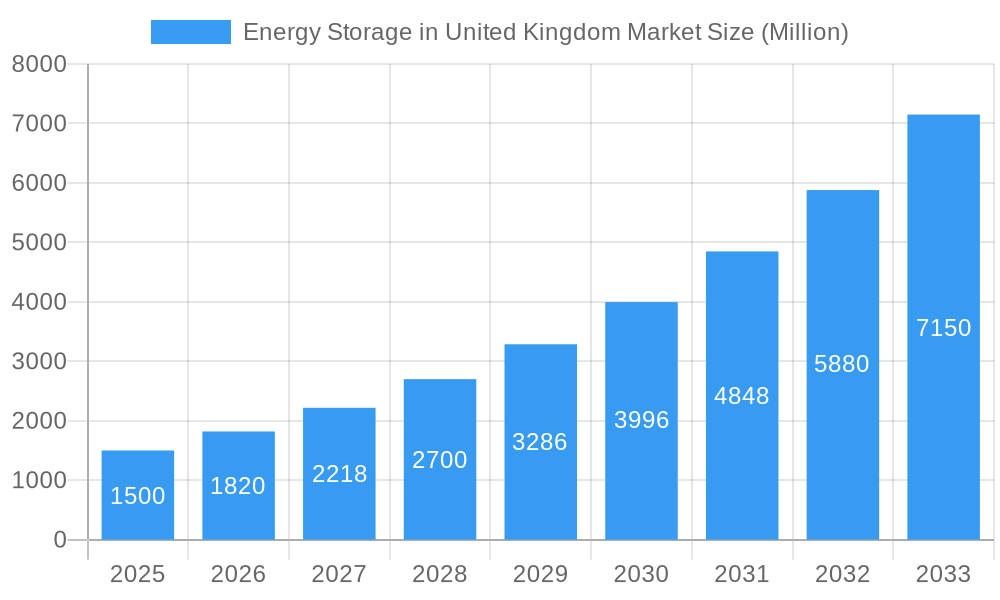
The United Kingdom's energy storage market is poised for significant expansion, driven by the escalating integration of renewable energy sources, supportive government decarbonization policies, and the imperative for enhanced grid stability. The market, valued at 6872 million in 2025, is projected to achieve a Compound Annual Growth Rate (CAGR) of 19.57% from 2025 to 2033. Key drivers fueling this robust growth include the need for consistent power supply from intermittent renewables and the UK's net-zero emissions targets, stimulating substantial investment. Additionally, rising electricity costs and energy security concerns are further bolstering market demand. Battery storage solutions dominate both residential and commercial & industrial segments, with Pumped-storage Hydroelectricity (PSH) and emerging technologies also playing a role. Leading companies such as ABB, Samsung SDI, LG Energy Solution, and Tesla are instrumental in shaping market dynamics through innovation and strategic collaborations.
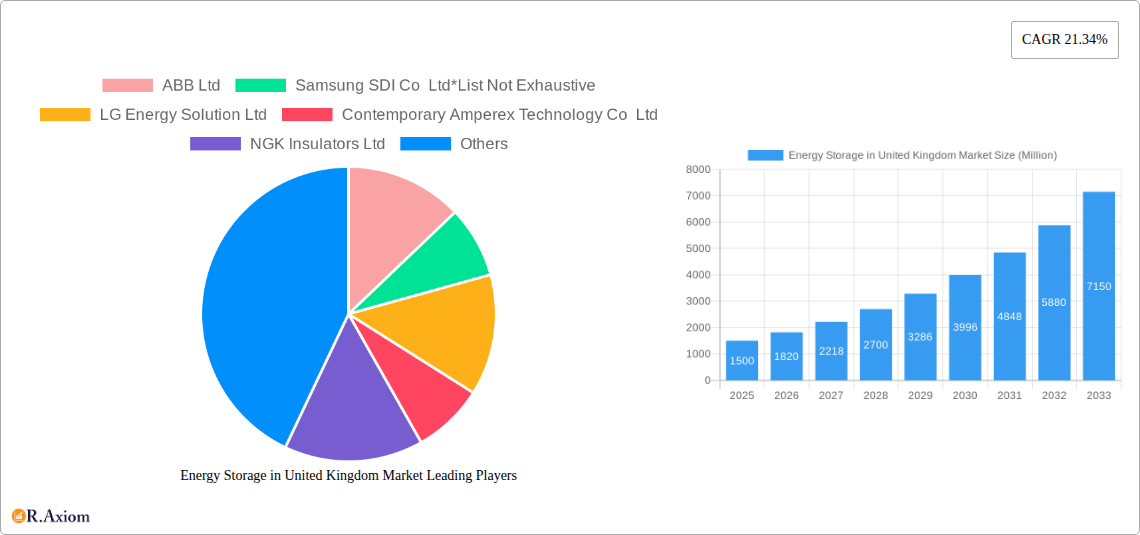
Energy Storage in United Kingdom Market Market Size (In Billion)
Future market expansion will be propelled by continuous technological advancements, particularly in battery efficiency and cost reduction, alongside favorable government incentives. While high initial investment and grid integration complexities may present challenges, opportunities lie in extending reach beyond the UK into other European markets as global renewable energy adoption accelerates. The evolution of smart grid technologies will also be critical for optimizing the integration and deployment of energy storage systems. The forecast period of 2025-2033 indicates substantial market value growth, underpinned by these drivers and the UK's sustained commitment to a sustainable energy future.
Energy Storage in United Kingdom Market Company Market Share
Energy Storage in the United Kingdom Market: A Comprehensive Report (2019-2033)
This comprehensive report provides a detailed analysis of the burgeoning Energy Storage market in the United Kingdom, offering invaluable insights for stakeholders across the value chain. Covering the period 2019-2033, with a focus on 2025, this report meticulously examines market trends, dominant segments, key players, and future growth prospects.
Energy Storage in United Kingdom Market Market Concentration & Innovation
This section analyzes the competitive landscape of the UK energy storage market, focusing on market concentration, innovation drivers, regulatory influences, and recent M&A activity. The market is currently characterized by a mix of established players and emerging companies, leading to a moderately concentrated market. While exact market share figures are proprietary to the full report, we can state that several multinational corporations hold significant shares, with smaller, more specialized firms competing in niche segments. Innovation is driven by advancements in battery technology (lithium-ion, flow batteries etc.), coupled with government incentives promoting renewable energy integration. The regulatory framework, including feed-in tariffs and capacity market mechanisms, plays a crucial role in shaping market growth. Product substitutes include traditional pumped hydro storage and other forms of grid management technology. End-user trends favor decentralized energy solutions, particularly in the residential and C&I sectors.
- Market Concentration: Moderately concentrated, with a few large players holding significant shares. Further detail on specific market shares is available in the full report.
- Innovation Drivers: Advancements in battery technologies, government support for renewables.
- M&A Activity: The report details several significant mergers and acquisitions, including deal values (where available). For instance, the xx Million deal between Company A and Company B highlights a trend towards consolidation. (Specific examples from the full report will be provided)
- Regulatory Framework: The evolving regulatory landscape significantly influences investment and deployment of energy storage solutions.
Energy Storage in United Kingdom Market Industry Trends & Insights
The UK energy storage market is experiencing robust growth, driven by several key factors. The increasing penetration of renewable energy sources (solar and wind), the need for grid stabilization, and supportive government policies are major contributors. The Compound Annual Growth Rate (CAGR) for the forecast period (2025-2033) is projected to be xx%, exceeding the global average. This growth reflects a rising demand for energy storage solutions across all application segments, especially the rapidly expanding C&I sector. Market penetration of energy storage technologies is increasing steadily, with battery-based systems currently dominating, followed by pumped hydro storage. Technological disruptions are anticipated from advanced battery chemistries and improved energy management systems, increasing efficiency and reducing costs. Consumer preferences shift towards environmentally friendly and cost-effective energy solutions. The competitive landscape is highly dynamic, with both established and new entrants vying for market share.
Dominant Markets & Segments in Energy Storage in United Kingdom Market
This section identifies the leading segments within the UK energy storage market. While the specific market size figures for each segment are contained within the full report, we can highlight the key factors driving dominance.
Type:
- Batteries: The dominant segment, fueled by technological advancements and falling costs. Key drivers include increasing affordability, efficiency improvements, and flexibility of deployment across various applications.
- Pumped-storage Hydroelectricity (PSH): A significant segment, particularly in regions with suitable geography. Its key drivers are established technology, large-scale storage capacity and proven reliability, though expansion is limited by geographical constraints.
- Other Types: This segment includes compressed air energy storage (CAES) and thermal energy storage (TES). Growth in this segment is limited compared to batteries and PSH due to technological and cost barriers.
Application:
- Commercial and Industrial (C&I): The fastest-growing segment, driven by the need for backup power, load shifting, and reduced energy costs. Infrastructure development and economic incentives are boosting demand.
- Residential: This segment is growing steadily as the cost of battery storage systems decreases, making them increasingly affordable for homeowners.
- Grid-Scale: This market segment continues to play a key role in grid stability and resilience. Policy support and significant investment are key drivers for this segment.
(Detailed analysis of regional dominance will be included in the full report)
Energy Storage in United Kingdom Market Product Developments
Recent years have witnessed significant advancements in energy storage technology, focusing primarily on improving battery performance, extending lifespan, and reducing costs. New battery chemistries, such as solid-state batteries, hold great promise for enhancing energy density and safety. This innovation is directly translated into increased market competitiveness, providing better value propositions to customers. Furthermore, smart energy management systems are being integrated into storage solutions to optimize energy usage and grid integration, driving further market acceptance.
Report Scope & Segmentation Analysis
This report provides a comprehensive analysis of the UK energy storage market, segmented by type (Batteries, PSH, Other Types) and application (Residential, C&I). Each segment's growth projections, market size estimations (in Millions), and competitive dynamics are detailed within the full report. For example, the battery segment is expected to witness significant growth due to decreasing costs and improved performance. The C&I segment shows strong potential, driven by increasing demand from businesses seeking to manage energy costs and improve grid resilience.
Key Drivers of Energy Storage in United Kingdom Market Growth
Several key factors are driving the expansion of the UK energy storage market:
- Government Policies: Supportive policies incentivize renewable energy integration, thereby increasing the demand for energy storage. This includes feed-in tariffs and capacity market mechanisms.
- Technological Advancements: Improvements in battery technology, reducing costs and enhancing efficiency, are pivotal drivers.
- Increased Renewable Energy Penetration: The increasing reliance on intermittent renewable sources necessitates energy storage solutions for grid stability and reliability.
- Falling Battery Costs: Significant decreases in battery costs make energy storage solutions more economically viable across various applications.
Challenges in the Energy Storage in United Kingdom Market Sector
Despite significant growth, several challenges hinder the market's full potential:
- Regulatory Hurdles: Navigating regulatory approvals and grid connection processes can pose significant barriers, impacting project timelines and costs.
- Supply Chain Issues: The dependence on raw materials and components from global supply chains can create vulnerabilities and price volatility.
- Intermittency of Renewables: The intermittent nature of renewable energy sources, like solar and wind, necessitates robust and reliable energy storage solutions, often posing challenges.
Emerging Opportunities in Energy Storage in United Kingdom Market
Several opportunities are emerging within the UK energy storage sector:
- Growth of the C&I sector: This presents significant opportunities for energy storage solutions tailored to specific business needs.
- Development of innovative battery chemistries: Advancements in solid-state and flow batteries open exciting avenues for enhancing energy density and lifespan.
- Integration with smart grids: Smart energy management systems integrating energy storage enhances efficiency and grid resilience.
Leading Players in the Energy Storage in United Kingdom Market Market
- ABB Ltd
- Samsung SDI Co Ltd
- LG Energy Solution Ltd
- Contemporary Amperex Technology Co Ltd
- NGK Insulators Ltd
- Electricite de France SA (EDF)
- Wartsila Oyj Abp
- Tesla Inc
- Siemens Energy AG
- General Electric Company
Key Developments in Energy Storage in United Kingdom Market Industry
- June 2022: Quinbrook Infrastructure Partners acquired project development rights for a 230 MW/460 MWh battery energy storage project in Wales, signaling significant investment in large-scale storage.
- January 2022: Voltalia commissioned the Hallen Battery Energy Storage Scheme (BESS) project (32 MW/32 MWh), demonstrating the growing adoption of lithium-ion battery storage in the UK.
Strategic Outlook for Energy Storage in United Kingdom Market Market
The UK energy storage market is poised for continued significant growth driven by supportive government policies, technological advancements, and increasing demand from diverse sectors. The focus on renewable energy integration, grid modernization, and decarbonization efforts will fuel further investment and deployment of energy storage technologies, creating substantial market opportunities for existing and new players in the coming years. The market is expected to reach xx Million by 2033.
Energy Storage in United Kingdom Market Segmentation
-
1. Type
- 1.1. Batteries
- 1.2. Pumped-storage Hydroelectricity (PSH)
- 1.3. Other Types
-
2. Application
- 2.1. Residential
- 2.2. Commercial and Industrial (C&I)
Energy Storage in United Kingdom Market Segmentation By Geography
-
1. North America
- 1.1. United States
- 1.2. Canada
- 1.3. Mexico
-
2. South America
- 2.1. Brazil
- 2.2. Argentina
- 2.3. Rest of South America
-
3. Europe
- 3.1. United Kingdom
- 3.2. Germany
- 3.3. France
- 3.4. Italy
- 3.5. Spain
- 3.6. Russia
- 3.7. Benelux
- 3.8. Nordics
- 3.9. Rest of Europe
-
4. Middle East & Africa
- 4.1. Turkey
- 4.2. Israel
- 4.3. GCC
- 4.4. North Africa
- 4.5. South Africa
- 4.6. Rest of Middle East & Africa
-
5. Asia Pacific
- 5.1. China
- 5.2. India
- 5.3. Japan
- 5.4. South Korea
- 5.5. ASEAN
- 5.6. Oceania
- 5.7. Rest of Asia Pacific
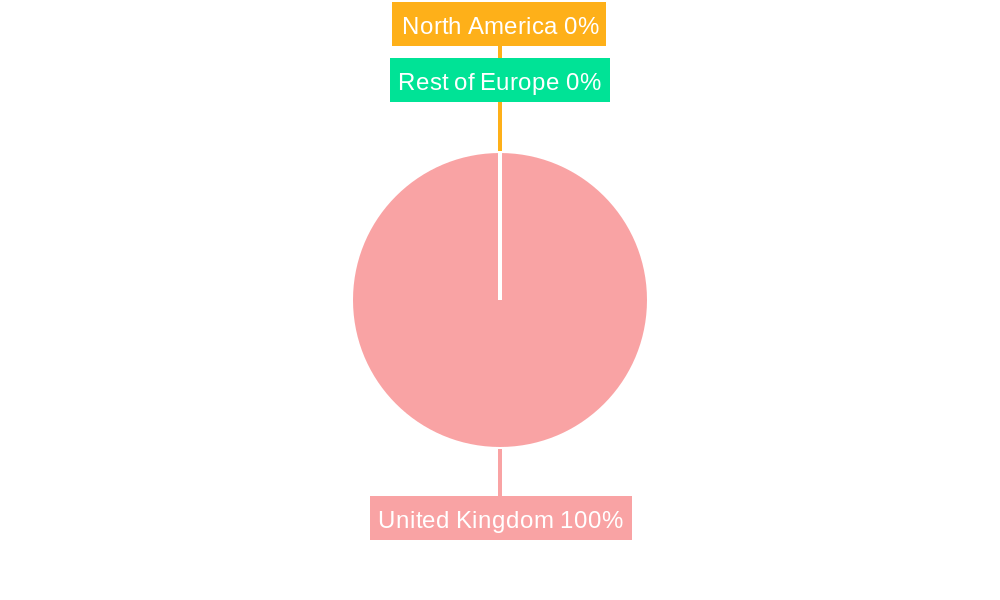
Energy Storage in United Kingdom Market Regional Market Share
Geographic Coverage of Energy Storage in United Kingdom Market
Energy Storage in United Kingdom Market REPORT HIGHLIGHTS
| Aspects | Details |
|---|---|
| Study Period | 2020-2034 |
| Base Year | 2025 |
| Estimated Year | 2026 |
| Forecast Period | 2026-2034 |
| Historical Period | 2020-2025 |
| Growth Rate | CAGR of 19.57% from 2020-2034 |
| Segmentation |
|
Table of Contents
- 1. Introduction
- 1.1. Research Scope
- 1.2. Market Segmentation
- 1.3. Research Objective
- 1.4. Definitions and Assumptions
- 2. Executive Summary
- 2.1. Market Snapshot
- 3. Market Dynamics
- 3.1. Market Drivers
- 3.2. Market Restrains
- 3.3. Market Trends
- 3.4. Market Opportunities
- 4. Market Factor Analysis
- 4.1. Porters Five Forces
- 4.1.1. Bargaining Power of Suppliers
- 4.1.2. Bargaining Power of Buyers
- 4.1.3. Threat of New Entrants
- 4.1.4. Threat of Substitutes
- 4.1.5. Competitive Rivalry
- 4.2. PESTEL analysis
- 4.3. BCG Analysis
- 4.3.1. Stars (High Growth, High Market Share)
- 4.3.2. Cash Cows (Low Growth, High Market Share)
- 4.3.3. Question Mark (High Growth, Low Market Share)
- 4.3.4. Dogs (Low Growth, Low Market Share)
- 4.4. Ansoff Matrix Analysis
- 4.5. Supply Chain Analysis
- 4.6. Regulatory Landscape
- 4.7. Current Market Potential and Opportunity Assessment (TAM–SAM–SOM Framework)
- 4.8. RAX Analyst Note
- 4.1. Porters Five Forces
- 5. Market Analysis, Insights and Forecast 2021-2033
- 5.1. Market Analysis, Insights and Forecast - by Type
- 5.1.1. Batteries
- 5.1.2. Pumped-storage Hydroelectricity (PSH)
- 5.1.3. Other Types
- 5.2. Market Analysis, Insights and Forecast - by Application
- 5.2.1. Residential
- 5.2.2. Commercial and Industrial (C&I)
- 5.3. Market Analysis, Insights and Forecast - by Region
- 5.3.1. North America
- 5.3.2. South America
- 5.3.3. Europe
- 5.3.4. Middle East & Africa
- 5.3.5. Asia Pacific
- 5.1. Market Analysis, Insights and Forecast - by Type
- 6. Global Energy Storage in United Kingdom Market Analysis, Insights and Forecast, 2021-2033
- 6.1. Market Analysis, Insights and Forecast - by Type
- 6.1.1. Batteries
- 6.1.2. Pumped-storage Hydroelectricity (PSH)
- 6.1.3. Other Types
- 6.2. Market Analysis, Insights and Forecast - by Application
- 6.2.1. Residential
- 6.2.2. Commercial and Industrial (C&I)
- 6.1. Market Analysis, Insights and Forecast - by Type
- 7. North America Energy Storage in United Kingdom Market Analysis, Insights and Forecast, 2020-2032
- 7.1. Market Analysis, Insights and Forecast - by Type
- 7.1.1. Batteries
- 7.1.2. Pumped-storage Hydroelectricity (PSH)
- 7.1.3. Other Types
- 7.2. Market Analysis, Insights and Forecast - by Application
- 7.2.1. Residential
- 7.2.2. Commercial and Industrial (C&I)
- 7.1. Market Analysis, Insights and Forecast - by Type
- 8. South America Energy Storage in United Kingdom Market Analysis, Insights and Forecast, 2020-2032
- 8.1. Market Analysis, Insights and Forecast - by Type
- 8.1.1. Batteries
- 8.1.2. Pumped-storage Hydroelectricity (PSH)
- 8.1.3. Other Types
- 8.2. Market Analysis, Insights and Forecast - by Application
- 8.2.1. Residential
- 8.2.2. Commercial and Industrial (C&I)
- 8.1. Market Analysis, Insights and Forecast - by Type
- 9. Europe Energy Storage in United Kingdom Market Analysis, Insights and Forecast, 2020-2032
- 9.1. Market Analysis, Insights and Forecast - by Type
- 9.1.1. Batteries
- 9.1.2. Pumped-storage Hydroelectricity (PSH)
- 9.1.3. Other Types
- 9.2. Market Analysis, Insights and Forecast - by Application
- 9.2.1. Residential
- 9.2.2. Commercial and Industrial (C&I)
- 9.1. Market Analysis, Insights and Forecast - by Type
- 10. Middle East & Africa Energy Storage in United Kingdom Market Analysis, Insights and Forecast, 2020-2032
- 10.1. Market Analysis, Insights and Forecast - by Type
- 10.1.1. Batteries
- 10.1.2. Pumped-storage Hydroelectricity (PSH)
- 10.1.3. Other Types
- 10.2. Market Analysis, Insights and Forecast - by Application
- 10.2.1. Residential
- 10.2.2. Commercial and Industrial (C&I)
- 10.1. Market Analysis, Insights and Forecast - by Type
- 11. Asia Pacific Energy Storage in United Kingdom Market Analysis, Insights and Forecast, 2020-2032
- 11.1. Market Analysis, Insights and Forecast - by Type
- 11.1.1. Batteries
- 11.1.2. Pumped-storage Hydroelectricity (PSH)
- 11.1.3. Other Types
- 11.2. Market Analysis, Insights and Forecast - by Application
- 11.2.1. Residential
- 11.2.2. Commercial and Industrial (C&I)
- 11.1. Market Analysis, Insights and Forecast - by Type
- 12. Competitive Analysis
- 12.1. Company Profiles
- 12.1.1 ABB Ltd
- 12.1.1.1. Company Overview
- 12.1.1.2. Products
- 12.1.1.3. Company Financials
- 12.1.1.4. SWOT Analysis
- 12.1.2 Samsung SDI Co Ltd*List Not Exhaustive
- 12.1.2.1. Company Overview
- 12.1.2.2. Products
- 12.1.2.3. Company Financials
- 12.1.2.4. SWOT Analysis
- 12.1.3 LG Energy Solution Ltd
- 12.1.3.1. Company Overview
- 12.1.3.2. Products
- 12.1.3.3. Company Financials
- 12.1.3.4. SWOT Analysis
- 12.1.4 Contemporary Amperex Technology Co Ltd
- 12.1.4.1. Company Overview
- 12.1.4.2. Products
- 12.1.4.3. Company Financials
- 12.1.4.4. SWOT Analysis
- 12.1.5 NGK Insulators Ltd
- 12.1.5.1. Company Overview
- 12.1.5.2. Products
- 12.1.5.3. Company Financials
- 12.1.5.4. SWOT Analysis
- 12.1.6 Electricite de France SA (EDF)
- 12.1.6.1. Company Overview
- 12.1.6.2. Products
- 12.1.6.3. Company Financials
- 12.1.6.4. SWOT Analysis
- 12.1.7 Wartsila Oyj Abp
- 12.1.7.1. Company Overview
- 12.1.7.2. Products
- 12.1.7.3. Company Financials
- 12.1.7.4. SWOT Analysis
- 12.1.8 Tesla Inc
- 12.1.8.1. Company Overview
- 12.1.8.2. Products
- 12.1.8.3. Company Financials
- 12.1.8.4. SWOT Analysis
- 12.1.9 Siemens Energy AG
- 12.1.9.1. Company Overview
- 12.1.9.2. Products
- 12.1.9.3. Company Financials
- 12.1.9.4. SWOT Analysis
- 12.1.10 General Electric Company
- 12.1.10.1. Company Overview
- 12.1.10.2. Products
- 12.1.10.3. Company Financials
- 12.1.10.4. SWOT Analysis
- 12.1.1 ABB Ltd
- 12.2. Market Entropy
- 12.2.1 Company's Key Areas Served
- 12.2.2 Recent Developments
- 12.3. Company Market Share Analysis 2025
- 12.3.1 Top 5 Companies Market Share Analysis
- 12.3.2 Top 3 Companies Market Share Analysis
- 12.4. List of Potential Customers
- 13. Research Methodology
List of Figures
- Figure 1: Global Energy Storage in United Kingdom Market Revenue Breakdown (million, %) by Region 2025 & 2033
- Figure 2: Global Energy Storage in United Kingdom Market Volume Breakdown (megawatt, %) by Region 2025 & 2033
- Figure 3: North America Energy Storage in United Kingdom Market Revenue (million), by Type 2025 & 2033
- Figure 4: North America Energy Storage in United Kingdom Market Volume (megawatt), by Type 2025 & 2033
- Figure 5: North America Energy Storage in United Kingdom Market Revenue Share (%), by Type 2025 & 2033
- Figure 6: North America Energy Storage in United Kingdom Market Volume Share (%), by Type 2025 & 2033
- Figure 7: North America Energy Storage in United Kingdom Market Revenue (million), by Application 2025 & 2033
- Figure 8: North America Energy Storage in United Kingdom Market Volume (megawatt), by Application 2025 & 2033
- Figure 9: North America Energy Storage in United Kingdom Market Revenue Share (%), by Application 2025 & 2033
- Figure 10: North America Energy Storage in United Kingdom Market Volume Share (%), by Application 2025 & 2033
- Figure 11: North America Energy Storage in United Kingdom Market Revenue (million), by Country 2025 & 2033
- Figure 12: North America Energy Storage in United Kingdom Market Volume (megawatt), by Country 2025 & 2033
- Figure 13: North America Energy Storage in United Kingdom Market Revenue Share (%), by Country 2025 & 2033
- Figure 14: North America Energy Storage in United Kingdom Market Volume Share (%), by Country 2025 & 2033
- Figure 15: South America Energy Storage in United Kingdom Market Revenue (million), by Type 2025 & 2033
- Figure 16: South America Energy Storage in United Kingdom Market Volume (megawatt), by Type 2025 & 2033
- Figure 17: South America Energy Storage in United Kingdom Market Revenue Share (%), by Type 2025 & 2033
- Figure 18: South America Energy Storage in United Kingdom Market Volume Share (%), by Type 2025 & 2033
- Figure 19: South America Energy Storage in United Kingdom Market Revenue (million), by Application 2025 & 2033
- Figure 20: South America Energy Storage in United Kingdom Market Volume (megawatt), by Application 2025 & 2033
- Figure 21: South America Energy Storage in United Kingdom Market Revenue Share (%), by Application 2025 & 2033
- Figure 22: South America Energy Storage in United Kingdom Market Volume Share (%), by Application 2025 & 2033
- Figure 23: South America Energy Storage in United Kingdom Market Revenue (million), by Country 2025 & 2033
- Figure 24: South America Energy Storage in United Kingdom Market Volume (megawatt), by Country 2025 & 2033
- Figure 25: South America Energy Storage in United Kingdom Market Revenue Share (%), by Country 2025 & 2033
- Figure 26: South America Energy Storage in United Kingdom Market Volume Share (%), by Country 2025 & 2033
- Figure 27: Europe Energy Storage in United Kingdom Market Revenue (million), by Type 2025 & 2033
- Figure 28: Europe Energy Storage in United Kingdom Market Volume (megawatt), by Type 2025 & 2033
- Figure 29: Europe Energy Storage in United Kingdom Market Revenue Share (%), by Type 2025 & 2033
- Figure 30: Europe Energy Storage in United Kingdom Market Volume Share (%), by Type 2025 & 2033
- Figure 31: Europe Energy Storage in United Kingdom Market Revenue (million), by Application 2025 & 2033
- Figure 32: Europe Energy Storage in United Kingdom Market Volume (megawatt), by Application 2025 & 2033
- Figure 33: Europe Energy Storage in United Kingdom Market Revenue Share (%), by Application 2025 & 2033
- Figure 34: Europe Energy Storage in United Kingdom Market Volume Share (%), by Application 2025 & 2033
- Figure 35: Europe Energy Storage in United Kingdom Market Revenue (million), by Country 2025 & 2033
- Figure 36: Europe Energy Storage in United Kingdom Market Volume (megawatt), by Country 2025 & 2033
- Figure 37: Europe Energy Storage in United Kingdom Market Revenue Share (%), by Country 2025 & 2033
- Figure 38: Europe Energy Storage in United Kingdom Market Volume Share (%), by Country 2025 & 2033
- Figure 39: Middle East & Africa Energy Storage in United Kingdom Market Revenue (million), by Type 2025 & 2033
- Figure 40: Middle East & Africa Energy Storage in United Kingdom Market Volume (megawatt), by Type 2025 & 2033
- Figure 41: Middle East & Africa Energy Storage in United Kingdom Market Revenue Share (%), by Type 2025 & 2033
- Figure 42: Middle East & Africa Energy Storage in United Kingdom Market Volume Share (%), by Type 2025 & 2033
- Figure 43: Middle East & Africa Energy Storage in United Kingdom Market Revenue (million), by Application 2025 & 2033
- Figure 44: Middle East & Africa Energy Storage in United Kingdom Market Volume (megawatt), by Application 2025 & 2033
- Figure 45: Middle East & Africa Energy Storage in United Kingdom Market Revenue Share (%), by Application 2025 & 2033
- Figure 46: Middle East & Africa Energy Storage in United Kingdom Market Volume Share (%), by Application 2025 & 2033
- Figure 47: Middle East & Africa Energy Storage in United Kingdom Market Revenue (million), by Country 2025 & 2033
- Figure 48: Middle East & Africa Energy Storage in United Kingdom Market Volume (megawatt), by Country 2025 & 2033
- Figure 49: Middle East & Africa Energy Storage in United Kingdom Market Revenue Share (%), by Country 2025 & 2033
- Figure 50: Middle East & Africa Energy Storage in United Kingdom Market Volume Share (%), by Country 2025 & 2033
- Figure 51: Asia Pacific Energy Storage in United Kingdom Market Revenue (million), by Type 2025 & 2033
- Figure 52: Asia Pacific Energy Storage in United Kingdom Market Volume (megawatt), by Type 2025 & 2033
- Figure 53: Asia Pacific Energy Storage in United Kingdom Market Revenue Share (%), by Type 2025 & 2033
- Figure 54: Asia Pacific Energy Storage in United Kingdom Market Volume Share (%), by Type 2025 & 2033
- Figure 55: Asia Pacific Energy Storage in United Kingdom Market Revenue (million), by Application 2025 & 2033
- Figure 56: Asia Pacific Energy Storage in United Kingdom Market Volume (megawatt), by Application 2025 & 2033
- Figure 57: Asia Pacific Energy Storage in United Kingdom Market Revenue Share (%), by Application 2025 & 2033
- Figure 58: Asia Pacific Energy Storage in United Kingdom Market Volume Share (%), by Application 2025 & 2033
- Figure 59: Asia Pacific Energy Storage in United Kingdom Market Revenue (million), by Country 2025 & 2033
- Figure 60: Asia Pacific Energy Storage in United Kingdom Market Volume (megawatt), by Country 2025 & 2033
- Figure 61: Asia Pacific Energy Storage in United Kingdom Market Revenue Share (%), by Country 2025 & 2033
- Figure 62: Asia Pacific Energy Storage in United Kingdom Market Volume Share (%), by Country 2025 & 2033
List of Tables
- Table 1: Global Energy Storage in United Kingdom Market Revenue million Forecast, by Type 2020 & 2033
- Table 2: Global Energy Storage in United Kingdom Market Volume megawatt Forecast, by Type 2020 & 2033
- Table 3: Global Energy Storage in United Kingdom Market Revenue million Forecast, by Application 2020 & 2033
- Table 4: Global Energy Storage in United Kingdom Market Volume megawatt Forecast, by Application 2020 & 2033
- Table 5: Global Energy Storage in United Kingdom Market Revenue million Forecast, by Region 2020 & 2033
- Table 6: Global Energy Storage in United Kingdom Market Volume megawatt Forecast, by Region 2020 & 2033
- Table 7: Global Energy Storage in United Kingdom Market Revenue million Forecast, by Type 2020 & 2033
- Table 8: Global Energy Storage in United Kingdom Market Volume megawatt Forecast, by Type 2020 & 2033
- Table 9: Global Energy Storage in United Kingdom Market Revenue million Forecast, by Application 2020 & 2033
- Table 10: Global Energy Storage in United Kingdom Market Volume megawatt Forecast, by Application 2020 & 2033
- Table 11: Global Energy Storage in United Kingdom Market Revenue million Forecast, by Country 2020 & 2033
- Table 12: Global Energy Storage in United Kingdom Market Volume megawatt Forecast, by Country 2020 & 2033
- Table 13: United States Energy Storage in United Kingdom Market Revenue (million) Forecast, by Application 2020 & 2033
- Table 14: United States Energy Storage in United Kingdom Market Volume (megawatt) Forecast, by Application 2020 & 2033
- Table 15: Canada Energy Storage in United Kingdom Market Revenue (million) Forecast, by Application 2020 & 2033
- Table 16: Canada Energy Storage in United Kingdom Market Volume (megawatt) Forecast, by Application 2020 & 2033
- Table 17: Mexico Energy Storage in United Kingdom Market Revenue (million) Forecast, by Application 2020 & 2033
- Table 18: Mexico Energy Storage in United Kingdom Market Volume (megawatt) Forecast, by Application 2020 & 2033
- Table 19: Global Energy Storage in United Kingdom Market Revenue million Forecast, by Type 2020 & 2033
- Table 20: Global Energy Storage in United Kingdom Market Volume megawatt Forecast, by Type 2020 & 2033
- Table 21: Global Energy Storage in United Kingdom Market Revenue million Forecast, by Application 2020 & 2033
- Table 22: Global Energy Storage in United Kingdom Market Volume megawatt Forecast, by Application 2020 & 2033
- Table 23: Global Energy Storage in United Kingdom Market Revenue million Forecast, by Country 2020 & 2033
- Table 24: Global Energy Storage in United Kingdom Market Volume megawatt Forecast, by Country 2020 & 2033
- Table 25: Brazil Energy Storage in United Kingdom Market Revenue (million) Forecast, by Application 2020 & 2033
- Table 26: Brazil Energy Storage in United Kingdom Market Volume (megawatt) Forecast, by Application 2020 & 2033
- Table 27: Argentina Energy Storage in United Kingdom Market Revenue (million) Forecast, by Application 2020 & 2033
- Table 28: Argentina Energy Storage in United Kingdom Market Volume (megawatt) Forecast, by Application 2020 & 2033
- Table 29: Rest of South America Energy Storage in United Kingdom Market Revenue (million) Forecast, by Application 2020 & 2033
- Table 30: Rest of South America Energy Storage in United Kingdom Market Volume (megawatt) Forecast, by Application 2020 & 2033
- Table 31: Global Energy Storage in United Kingdom Market Revenue million Forecast, by Type 2020 & 2033
- Table 32: Global Energy Storage in United Kingdom Market Volume megawatt Forecast, by Type 2020 & 2033
- Table 33: Global Energy Storage in United Kingdom Market Revenue million Forecast, by Application 2020 & 2033
- Table 34: Global Energy Storage in United Kingdom Market Volume megawatt Forecast, by Application 2020 & 2033
- Table 35: Global Energy Storage in United Kingdom Market Revenue million Forecast, by Country 2020 & 2033
- Table 36: Global Energy Storage in United Kingdom Market Volume megawatt Forecast, by Country 2020 & 2033
- Table 37: United Kingdom Energy Storage in United Kingdom Market Revenue (million) Forecast, by Application 2020 & 2033
- Table 38: United Kingdom Energy Storage in United Kingdom Market Volume (megawatt) Forecast, by Application 2020 & 2033
- Table 39: Germany Energy Storage in United Kingdom Market Revenue (million) Forecast, by Application 2020 & 2033
- Table 40: Germany Energy Storage in United Kingdom Market Volume (megawatt) Forecast, by Application 2020 & 2033
- Table 41: France Energy Storage in United Kingdom Market Revenue (million) Forecast, by Application 2020 & 2033
- Table 42: France Energy Storage in United Kingdom Market Volume (megawatt) Forecast, by Application 2020 & 2033
- Table 43: Italy Energy Storage in United Kingdom Market Revenue (million) Forecast, by Application 2020 & 2033
- Table 44: Italy Energy Storage in United Kingdom Market Volume (megawatt) Forecast, by Application 2020 & 2033
- Table 45: Spain Energy Storage in United Kingdom Market Revenue (million) Forecast, by Application 2020 & 2033
- Table 46: Spain Energy Storage in United Kingdom Market Volume (megawatt) Forecast, by Application 2020 & 2033
- Table 47: Russia Energy Storage in United Kingdom Market Revenue (million) Forecast, by Application 2020 & 2033
- Table 48: Russia Energy Storage in United Kingdom Market Volume (megawatt) Forecast, by Application 2020 & 2033
- Table 49: Benelux Energy Storage in United Kingdom Market Revenue (million) Forecast, by Application 2020 & 2033
- Table 50: Benelux Energy Storage in United Kingdom Market Volume (megawatt) Forecast, by Application 2020 & 2033
- Table 51: Nordics Energy Storage in United Kingdom Market Revenue (million) Forecast, by Application 2020 & 2033
- Table 52: Nordics Energy Storage in United Kingdom Market Volume (megawatt) Forecast, by Application 2020 & 2033
- Table 53: Rest of Europe Energy Storage in United Kingdom Market Revenue (million) Forecast, by Application 2020 & 2033
- Table 54: Rest of Europe Energy Storage in United Kingdom Market Volume (megawatt) Forecast, by Application 2020 & 2033
- Table 55: Global Energy Storage in United Kingdom Market Revenue million Forecast, by Type 2020 & 2033
- Table 56: Global Energy Storage in United Kingdom Market Volume megawatt Forecast, by Type 2020 & 2033
- Table 57: Global Energy Storage in United Kingdom Market Revenue million Forecast, by Application 2020 & 2033
- Table 58: Global Energy Storage in United Kingdom Market Volume megawatt Forecast, by Application 2020 & 2033
- Table 59: Global Energy Storage in United Kingdom Market Revenue million Forecast, by Country 2020 & 2033
- Table 60: Global Energy Storage in United Kingdom Market Volume megawatt Forecast, by Country 2020 & 2033
- Table 61: Turkey Energy Storage in United Kingdom Market Revenue (million) Forecast, by Application 2020 & 2033
- Table 62: Turkey Energy Storage in United Kingdom Market Volume (megawatt) Forecast, by Application 2020 & 2033
- Table 63: Israel Energy Storage in United Kingdom Market Revenue (million) Forecast, by Application 2020 & 2033
- Table 64: Israel Energy Storage in United Kingdom Market Volume (megawatt) Forecast, by Application 2020 & 2033
- Table 65: GCC Energy Storage in United Kingdom Market Revenue (million) Forecast, by Application 2020 & 2033
- Table 66: GCC Energy Storage in United Kingdom Market Volume (megawatt) Forecast, by Application 2020 & 2033
- Table 67: North Africa Energy Storage in United Kingdom Market Revenue (million) Forecast, by Application 2020 & 2033
- Table 68: North Africa Energy Storage in United Kingdom Market Volume (megawatt) Forecast, by Application 2020 & 2033
- Table 69: South Africa Energy Storage in United Kingdom Market Revenue (million) Forecast, by Application 2020 & 2033
- Table 70: South Africa Energy Storage in United Kingdom Market Volume (megawatt) Forecast, by Application 2020 & 2033
- Table 71: Rest of Middle East & Africa Energy Storage in United Kingdom Market Revenue (million) Forecast, by Application 2020 & 2033
- Table 72: Rest of Middle East & Africa Energy Storage in United Kingdom Market Volume (megawatt) Forecast, by Application 2020 & 2033
- Table 73: Global Energy Storage in United Kingdom Market Revenue million Forecast, by Type 2020 & 2033
- Table 74: Global Energy Storage in United Kingdom Market Volume megawatt Forecast, by Type 2020 & 2033
- Table 75: Global Energy Storage in United Kingdom Market Revenue million Forecast, by Application 2020 & 2033
- Table 76: Global Energy Storage in United Kingdom Market Volume megawatt Forecast, by Application 2020 & 2033
- Table 77: Global Energy Storage in United Kingdom Market Revenue million Forecast, by Country 2020 & 2033
- Table 78: Global Energy Storage in United Kingdom Market Volume megawatt Forecast, by Country 2020 & 2033
- Table 79: China Energy Storage in United Kingdom Market Revenue (million) Forecast, by Application 2020 & 2033
- Table 80: China Energy Storage in United Kingdom Market Volume (megawatt) Forecast, by Application 2020 & 2033
- Table 81: India Energy Storage in United Kingdom Market Revenue (million) Forecast, by Application 2020 & 2033
- Table 82: India Energy Storage in United Kingdom Market Volume (megawatt) Forecast, by Application 2020 & 2033
- Table 83: Japan Energy Storage in United Kingdom Market Revenue (million) Forecast, by Application 2020 & 2033
- Table 84: Japan Energy Storage in United Kingdom Market Volume (megawatt) Forecast, by Application 2020 & 2033
- Table 85: South Korea Energy Storage in United Kingdom Market Revenue (million) Forecast, by Application 2020 & 2033
- Table 86: South Korea Energy Storage in United Kingdom Market Volume (megawatt) Forecast, by Application 2020 & 2033
- Table 87: ASEAN Energy Storage in United Kingdom Market Revenue (million) Forecast, by Application 2020 & 2033
- Table 88: ASEAN Energy Storage in United Kingdom Market Volume (megawatt) Forecast, by Application 2020 & 2033
- Table 89: Oceania Energy Storage in United Kingdom Market Revenue (million) Forecast, by Application 2020 & 2033
- Table 90: Oceania Energy Storage in United Kingdom Market Volume (megawatt) Forecast, by Application 2020 & 2033
- Table 91: Rest of Asia Pacific Energy Storage in United Kingdom Market Revenue (million) Forecast, by Application 2020 & 2033
- Table 92: Rest of Asia Pacific Energy Storage in United Kingdom Market Volume (megawatt) Forecast, by Application 2020 & 2033
Frequently Asked Questions
1. What is the projected Compound Annual Growth Rate (CAGR) of the Energy Storage in United Kingdom Market?
The projected CAGR is approximately 19.57%.
2. Which companies are prominent players in the Energy Storage in United Kingdom Market?
Key companies in the market include ABB Ltd, Samsung SDI Co Ltd*List Not Exhaustive, LG Energy Solution Ltd, Contemporary Amperex Technology Co Ltd, NGK Insulators Ltd, Electricite de France SA (EDF), Wartsila Oyj Abp, Tesla Inc, Siemens Energy AG, General Electric Company.
3. What are the main segments of the Energy Storage in United Kingdom Market?
The market segments include Type, Application.
4. Can you provide details about the market size?
The market size is estimated to be USD 6872 million as of 2022.
5. What are some drivers contributing to market growth?
4.; The High Amount of Waste Generation in the Country4.; The growing Focus on Non-Fossil Fuel Sources.
6. What are the notable trends driving market growth?
Battery Energy Storage Systems Expected to Witness Significant Demand.
7. Are there any restraints impacting market growth?
4.; The Recycling Rate of Waste in Germany.
8. Can you provide examples of recent developments in the market?
Jun 2022: Quinbrook Infrastructure Partners acquired exclusive project development rights for the 230 MW/460 MWh battery energy storage project in Wales, United Kingdom. The battery energy storage system will be at the former Uskmouth coal-fired power station in South Wales, which closed in 2015. The project development rights were acquired from Simec Atlantis Energy, and the BESS is expected to be commissioned by the end of 2024.
9. What pricing options are available for accessing the report?
Pricing options include single-user, multi-user, and enterprise licenses priced at USD 3800, USD 4500, and USD 5800 respectively.
10. Is the market size provided in terms of value or volume?
The market size is provided in terms of value, measured in million and volume, measured in megawatt.
11. Are there any specific market keywords associated with the report?
Yes, the market keyword associated with the report is "Energy Storage in United Kingdom Market," which aids in identifying and referencing the specific market segment covered.
12. How do I determine which pricing option suits my needs best?
The pricing options vary based on user requirements and access needs. Individual users may opt for single-user licenses, while businesses requiring broader access may choose multi-user or enterprise licenses for cost-effective access to the report.
13. Are there any additional resources or data provided in the Energy Storage in United Kingdom Market report?
While the report offers comprehensive insights, it's advisable to review the specific contents or supplementary materials provided to ascertain if additional resources or data are available.
14. How can I stay updated on further developments or reports in the Energy Storage in United Kingdom Market?
To stay informed about further developments, trends, and reports in the Energy Storage in United Kingdom Market, consider subscribing to industry newsletters, following relevant companies and organizations, or regularly checking reputable industry news sources and publications.
Methodology
Step 1 - Identification of Relevant Samples Size from Population Database


Step 2 - Approaches for Defining Global Market Size (Value, Volume* & Price*)

Note*: In applicable scenarios
Step 3 - Data Sources
Primary Research
- Web Analytics
- Survey Reports
- Research Institute
- Latest Research Reports
- Opinion Leaders
Secondary Research
- Annual Reports
- White Paper
- Latest Press Release
- Industry Association
- Paid Database
- Investor Presentations

Step 4 - Data Triangulation
Involves using different sources of information in order to increase the validity of a study
These sources are likely to be stakeholders in a program - participants, other researchers, program staff, other community members, and so on.
Then we put all data in single framework & apply various statistical tools to find out the dynamic on the market.
During the analysis stage, feedback from the stakeholder groups would be compared to determine areas of agreement as well as areas of divergence