
Key Insights
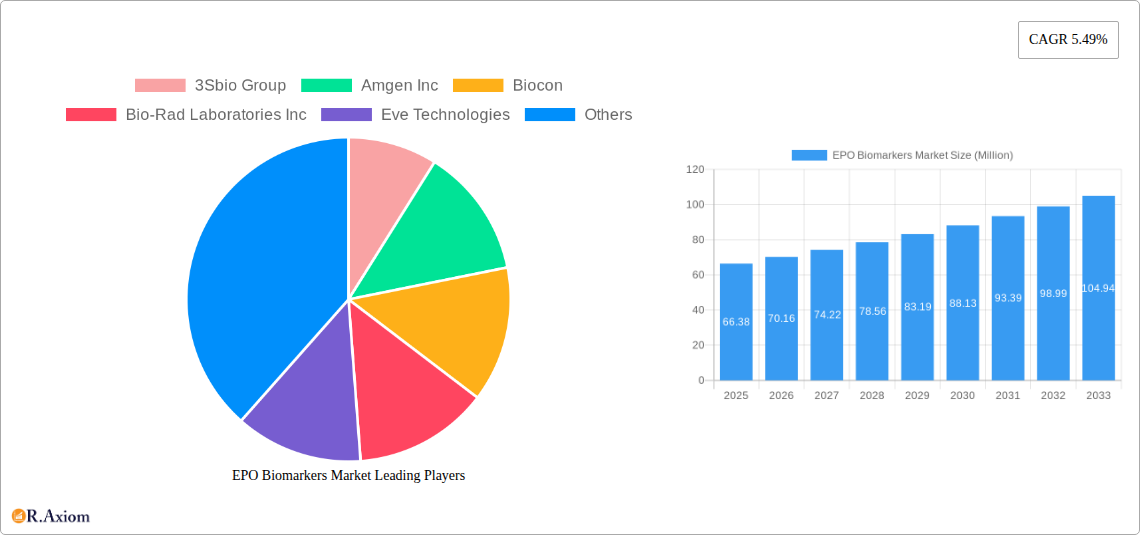
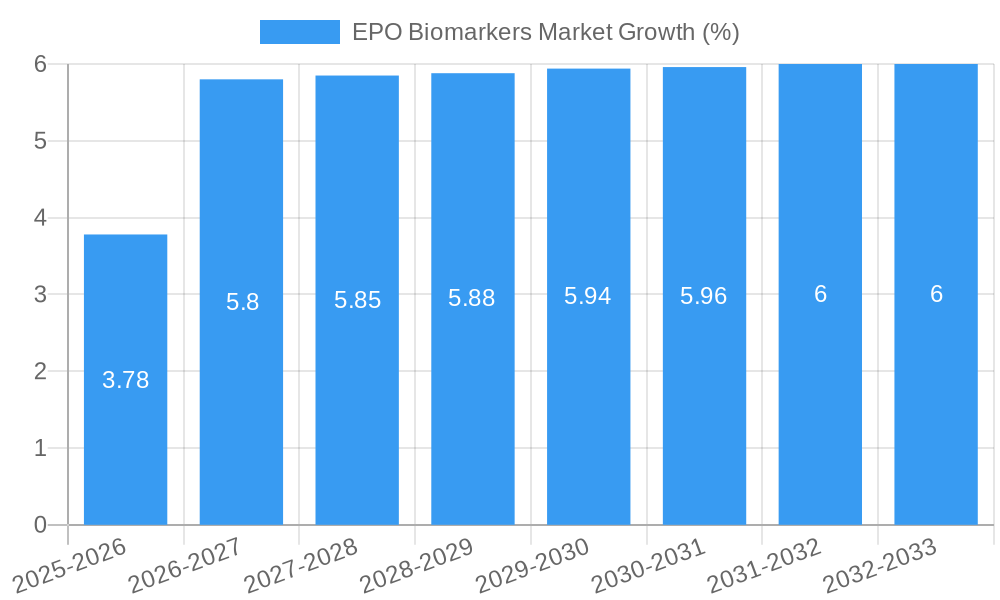
The EPO Biomarkers market, valued at $66.38 million in 2025, is projected to experience robust growth, driven by the increasing prevalence of anemia and kidney diseases, rising demand for accurate diagnostic tools, and advancements in biomarker technology. The market's Compound Annual Growth Rate (CAGR) of 5.49% from 2019 to 2024 suggests a consistent expansion, indicating a strong future outlook. Key drivers include the development of novel therapeutics targeting erythropoietin (EPO) pathways, the rising adoption of personalized medicine approaches necessitating precise biomarker assessments, and increasing investments in research and development within the biopharmaceutical sector. Growth is further fueled by the expanding geriatric population, which is more susceptible to EPO-related disorders. While regulatory hurdles and the high cost associated with developing and implementing these biomarkers might pose some challenges, the overall market trajectory points towards substantial expansion.
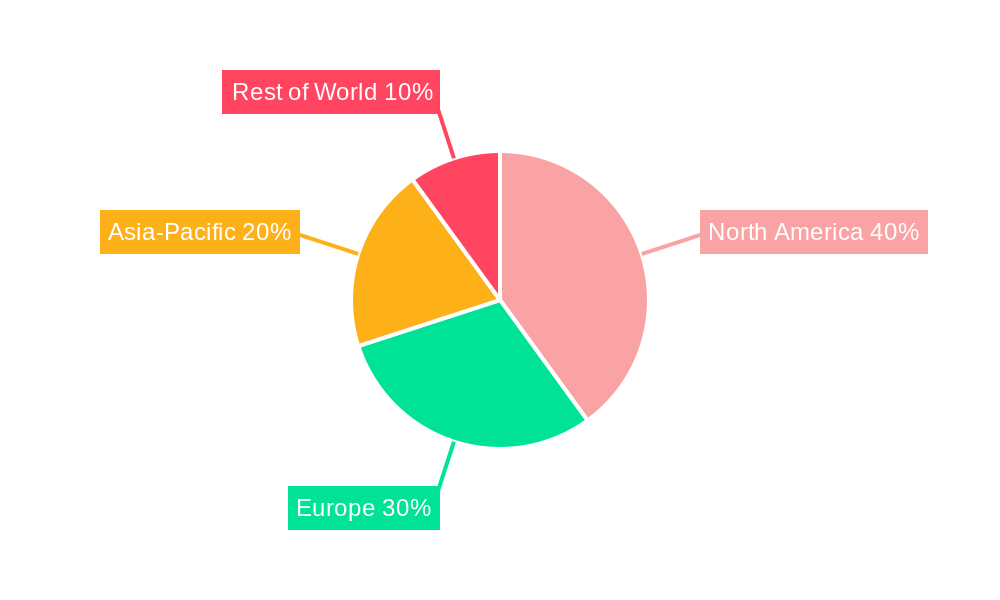
The competitive landscape is characterized by the presence of both large pharmaceutical companies and specialized biotechnology firms. Companies like Amgen, Roche, and Pfizer leverage their established market positions and extensive research capabilities to lead the innovation and commercialization efforts. Smaller biotech firms, however, contribute significantly through specialized expertise and niche product development. Regional market variations are likely influenced by factors such as healthcare infrastructure, regulatory frameworks, and disease prevalence rates. North America and Europe are expected to hold significant market shares, given the established healthcare systems and high adoption rates of advanced diagnostic technologies. Asia-Pacific is anticipated to demonstrate considerable growth potential, driven by increasing healthcare expenditure and expanding diagnostic capabilities. The forecast period (2025-2033) promises significant market expansion, primarily influenced by ongoing technological advancements and a growing awareness of the importance of early diagnosis and targeted treatment strategies for EPO-related conditions.
EPO Biomarkers Market: A Comprehensive Market Report (2019-2033)
This comprehensive report provides an in-depth analysis of the EPO Biomarkers Market, offering valuable insights for stakeholders across the pharmaceutical, biotechnology, and healthcare sectors. Covering the period from 2019 to 2033, with a base year of 2025 and a forecast period of 2025-2033, this report meticulously examines market dynamics, growth drivers, challenges, and opportunities. It includes detailed segmentation, competitive landscape analysis, and key industry developments, enabling informed strategic decision-making. The market is projected to reach xx Million by 2033, exhibiting a CAGR of xx% during the forecast period.
EPO Biomarkers Market Market Concentration & Innovation
The EPO Biomarkers market exhibits a moderately concentrated landscape, with a few key players holding significant market share. However, the market is characterized by continuous innovation, driven by advancements in biomarker discovery technologies, diagnostic tools, and therapeutic strategies. Regulatory frameworks, particularly those concerning drug approvals and reimbursement policies, significantly influence market growth. The presence of substitute therapies and evolving end-user preferences (e.g., personalized medicine) further shape market dynamics. Mergers and acquisitions (M&A) activity has been moderate in recent years, with deal values averaging xx Million. Several companies, such as Amgen Inc, F Hoffmann-La Roche Ltd, and Pfizer Inc, have made strategic investments to enhance their presence in the market.
- Market Concentration: The top 5 players account for approximately xx% of the market share in 2025.
- Innovation Drivers: Advancements in genomics, proteomics, and bioinformatics are fueling the development of novel biomarkers.
- Regulatory Landscape: Stringent regulatory approvals and reimbursement policies influence market entry and expansion.
- Product Substitutes: Alternative diagnostic and therapeutic approaches pose competitive challenges.
- M&A Activity: Strategic acquisitions and partnerships are reshaping the market landscape, with deal values ranging from xx Million to xx Million.
EPO Biomarkers Market Industry Trends & Insights
The EPO Biomarkers market is experiencing robust growth, driven by the increasing prevalence of chronic kidney disease (CKD), rising demand for effective anemia treatments, and the growing adoption of sophisticated diagnostic tools. Technological advancements, including the development of more sensitive and specific biomarkers, personalized medicine approaches, and improved diagnostic assays, are further accelerating market expansion. Consumer preference for minimally invasive diagnostic procedures and effective therapies is also driving growth. The competitive landscape is characterized by intense rivalry among established players and emerging companies, leading to product innovation and price competition. The market is expected to maintain a steady growth trajectory, with a projected CAGR of xx% from 2025 to 2033. Market penetration of novel biomarkers is expected to reach xx% by 2033.
Dominant Markets & Segments in EPO Biomarkers Market
The North American region currently dominates the EPO Biomarkers market, driven by high healthcare expenditure, advanced healthcare infrastructure, and a large patient pool. Within North America, the United States holds the largest market share. Key drivers for market dominance include:
- Strong healthcare infrastructure: Extensive network of hospitals, diagnostic centers, and research institutions.
- High healthcare expenditure: Significant investments in healthcare research and development.
- Favorable regulatory environment: Supportive policies for the development and adoption of novel biomarkers.
- Large patient pool: High prevalence of chronic kidney disease and related anemias.
Europe is expected to witness substantial growth, followed by the Asia-Pacific region. Japan and China are key markets within the Asia-Pacific region, exhibiting significant growth potential due to increasing healthcare awareness and rising disposable incomes.
EPO Biomarkers Market Product Developments
Recent product innovations focus on developing more sensitive, specific, and cost-effective biomarkers for the diagnosis and monitoring of EPO-related disorders. These advancements leverage cutting-edge technologies like liquid biopsies and advanced imaging techniques. The key competitive advantage lies in superior diagnostic accuracy, improved patient outcomes, and reduced healthcare costs. Technological trends are shifting towards point-of-care diagnostics and personalized medicine approaches, enhancing market fit and improving patient care.
Report Scope & Segmentation Analysis
This report segments the EPO Biomarkers market based on biomarker type (e.g., erythropoietin levels, hepcidin levels, transferrin receptor levels), application (diagnosis, prognosis, monitoring), end-user (hospitals, clinics, research institutions), and geography. Growth projections vary across segments, with the diagnosis segment projected to dominate due to the rising prevalence of CKD. Competitive dynamics are influenced by the level of innovation, regulatory approvals, and market access strategies. Market sizes and growth rates are further detailed for each segment within the full report.
Key Drivers of EPO Biomarkers Market Growth
The growth of the EPO Biomarkers market is primarily driven by the increasing prevalence of chronic kidney disease (CKD) globally, leading to a higher demand for accurate and timely diagnosis and monitoring. Technological advancements in biomarker discovery and diagnostic techniques enhance the sensitivity and specificity of testing, fueling market expansion. Favorable regulatory frameworks and increasing healthcare expenditure also contribute significantly to market growth. For instance, the recent FDA approval of new drugs for anemia treatment has expanded market opportunities.
Challenges in the EPO Biomarkers Market Sector
The EPO Biomarkers market faces challenges such as stringent regulatory approvals, high development costs, and intense competition. Supply chain disruptions can impact the availability of essential reagents and testing kits. Furthermore, the reimbursement policies for biomarker testing vary across regions, potentially hindering market penetration. These factors, collectively, could limit the market growth to some extent.
Emerging Opportunities in EPO Biomarkers Market
Emerging opportunities lie in the development of novel biomarkers for personalized medicine approaches, focusing on specific patient subgroups. The growing application of liquid biopsies for non-invasive diagnosis presents significant market potential. Expansion into underserved regions and the integration of artificial intelligence (AI) in diagnostic tools could also unlock new opportunities. The development of point-of-care diagnostics is expected to revolutionize the testing paradigm, driving market growth.
Leading Players in the EPO Biomarkers Market Market
- 3Sbio Group
- Amgen Inc
- Biocon
- Bio-Rad Laboratories Inc
- Eve Technologies
- F Hoffmann-La Roche Ltd
- Merck KGaA
- Pfizer Inc
- Siemens Healthineers AG
- Kyowa Kirin Co Ltd
- GenScript
- Bioagilytix Labs
- *List Not Exhaustive
Key Developments in EPO Biomarkers Market Industry
- October 2023: Genexine, in a joint venture with PT Kalbe Farma (KGbio), received Indonesian BPOM approval for a novel long-acting erythropoietin (Epoetin alfa) to treat CKD-induced anemia in non-dialysis patients. This expansion into new geographical markets signifies growth potential.
- March 2024: CSL Vifor and Akebia Therapeutics Inc. received FDA approval for Vafseo (vadadustat), an oral hypoxia-inducible factor prolyl hydroxylase inhibitor to treat anemia in dialysis-dependent CKD adults. This approval expands treatment options and potentially increases market demand for related biomarkers.
Strategic Outlook for EPO Biomarkers Market Market
The future of the EPO Biomarkers market appears promising, fueled by continuous technological advancements, rising healthcare expenditure, and a growing awareness of CKD and related anemias. The development of personalized medicine approaches and point-of-care diagnostics will drive further market expansion. Strategic collaborations and acquisitions will continue to reshape the competitive landscape, leading to innovative product offerings and improved patient outcomes. The market is poised for significant growth, driven by unmet clinical needs and the potential of innovative biomarkers.
EPO Biomarkers Market Segmentation
-
1. Type
- 1.1. Erythropoietin Alfa
- 1.2. Erythropoietin Beta
- 1.3. Erythropoietin Zeta
- 1.4. Erythropoietin Theta
- 1.5. Other Types
-
2. Application
- 2.1. Renal Disorder
- 2.2. Cancer
- 2.3. Acquired Immunodeficiency Sydnrome (AIDSs)
- 2.4. Anemia of Chronic Inflammatory Syndromes
- 2.5. Other Applications
EPO Biomarkers Market Segmentation By Geography
-
1. North America
- 1.1. United States
- 1.2. Canada
- 1.3. Mexico
-
2. Europe
- 2.1. Germany
- 2.2. United Kingdom
- 2.3. France
- 2.4. Italy
- 2.5. Spain
- 2.6. Rest of Europe
-
3. Asia Pacific
- 3.1. China
- 3.2. Japan
- 3.3. India
- 3.4. Australia
- 3.5. South Korea
- 3.6. Rest of Asia Pacific
-
4. Middle East and Africa
- 4.1. GCC
- 4.2. South Africa
- 4.3. Rest of Middle East and Africa
-
5. South America
- 5.1. Brazil
- 5.2. Argentina
- 5.3. Rest of South America
EPO Biomarkers Market REPORT HIGHLIGHTS
| Aspects | Details |
|---|---|
| Study Period | 2019-2033 |
| Base Year | 2024 |
| Estimated Year | 2025 |
| Forecast Period | 2025-2033 |
| Historical Period | 2019-2024 |
| Growth Rate | CAGR of 5.49% from 2019-2033 |
| Segmentation |
|
Table of Contents
- 1. Introduction
- 1.1. Research Scope
- 1.2. Market Segmentation
- 1.3. Research Methodology
- 1.4. Definitions and Assumptions
- 2. Executive Summary
- 2.1. Introduction
- 3. Market Dynamics
- 3.1. Introduction
- 3.2. Market Drivers
- 3.2.1. Increasing Prevalence of Cancer and End-Stage Renal Disease (ESRD); Favorable Healthcare Regulations In Developed Economies; Increasing Research and Development in EPO Biomarker Technology
- 3.3. Market Restrains
- 3.3.1. Increasing Prevalence of Cancer and End-Stage Renal Disease (ESRD); Favorable Healthcare Regulations In Developed Economies; Increasing Research and Development in EPO Biomarker Technology
- 3.4. Market Trends
- 3.4.1. The Cancer Segment by Application is Expected Witness Significant Growth During the Forecast Period
- 4. Market Factor Analysis
- 4.1. Porters Five Forces
- 4.2. Supply/Value Chain
- 4.3. PESTEL analysis
- 4.4. Market Entropy
- 4.5. Patent/Trademark Analysis
- 5. Global EPO Biomarkers Market Analysis, Insights and Forecast, 2019-2031
- 5.1. Market Analysis, Insights and Forecast - by Type
- 5.1.1. Erythropoietin Alfa
- 5.1.2. Erythropoietin Beta
- 5.1.3. Erythropoietin Zeta
- 5.1.4. Erythropoietin Theta
- 5.1.5. Other Types
- 5.2. Market Analysis, Insights and Forecast - by Application
- 5.2.1. Renal Disorder
- 5.2.2. Cancer
- 5.2.3. Acquired Immunodeficiency Sydnrome (AIDSs)
- 5.2.4. Anemia of Chronic Inflammatory Syndromes
- 5.2.5. Other Applications
- 5.3. Market Analysis, Insights and Forecast - by Region
- 5.3.1. North America
- 5.3.2. Europe
- 5.3.3. Asia Pacific
- 5.3.4. Middle East and Africa
- 5.3.5. South America
- 5.1. Market Analysis, Insights and Forecast - by Type
- 6. North America EPO Biomarkers Market Analysis, Insights and Forecast, 2019-2031
- 6.1. Market Analysis, Insights and Forecast - by Type
- 6.1.1. Erythropoietin Alfa
- 6.1.2. Erythropoietin Beta
- 6.1.3. Erythropoietin Zeta
- 6.1.4. Erythropoietin Theta
- 6.1.5. Other Types
- 6.2. Market Analysis, Insights and Forecast - by Application
- 6.2.1. Renal Disorder
- 6.2.2. Cancer
- 6.2.3. Acquired Immunodeficiency Sydnrome (AIDSs)
- 6.2.4. Anemia of Chronic Inflammatory Syndromes
- 6.2.5. Other Applications
- 6.1. Market Analysis, Insights and Forecast - by Type
- 7. Europe EPO Biomarkers Market Analysis, Insights and Forecast, 2019-2031
- 7.1. Market Analysis, Insights and Forecast - by Type
- 7.1.1. Erythropoietin Alfa
- 7.1.2. Erythropoietin Beta
- 7.1.3. Erythropoietin Zeta
- 7.1.4. Erythropoietin Theta
- 7.1.5. Other Types
- 7.2. Market Analysis, Insights and Forecast - by Application
- 7.2.1. Renal Disorder
- 7.2.2. Cancer
- 7.2.3. Acquired Immunodeficiency Sydnrome (AIDSs)
- 7.2.4. Anemia of Chronic Inflammatory Syndromes
- 7.2.5. Other Applications
- 7.1. Market Analysis, Insights and Forecast - by Type
- 8. Asia Pacific EPO Biomarkers Market Analysis, Insights and Forecast, 2019-2031
- 8.1. Market Analysis, Insights and Forecast - by Type
- 8.1.1. Erythropoietin Alfa
- 8.1.2. Erythropoietin Beta
- 8.1.3. Erythropoietin Zeta
- 8.1.4. Erythropoietin Theta
- 8.1.5. Other Types
- 8.2. Market Analysis, Insights and Forecast - by Application
- 8.2.1. Renal Disorder
- 8.2.2. Cancer
- 8.2.3. Acquired Immunodeficiency Sydnrome (AIDSs)
- 8.2.4. Anemia of Chronic Inflammatory Syndromes
- 8.2.5. Other Applications
- 8.1. Market Analysis, Insights and Forecast - by Type
- 9. Middle East and Africa EPO Biomarkers Market Analysis, Insights and Forecast, 2019-2031
- 9.1. Market Analysis, Insights and Forecast - by Type
- 9.1.1. Erythropoietin Alfa
- 9.1.2. Erythropoietin Beta
- 9.1.3. Erythropoietin Zeta
- 9.1.4. Erythropoietin Theta
- 9.1.5. Other Types
- 9.2. Market Analysis, Insights and Forecast - by Application
- 9.2.1. Renal Disorder
- 9.2.2. Cancer
- 9.2.3. Acquired Immunodeficiency Sydnrome (AIDSs)
- 9.2.4. Anemia of Chronic Inflammatory Syndromes
- 9.2.5. Other Applications
- 9.1. Market Analysis, Insights and Forecast - by Type
- 10. South America EPO Biomarkers Market Analysis, Insights and Forecast, 2019-2031
- 10.1. Market Analysis, Insights and Forecast - by Type
- 10.1.1. Erythropoietin Alfa
- 10.1.2. Erythropoietin Beta
- 10.1.3. Erythropoietin Zeta
- 10.1.4. Erythropoietin Theta
- 10.1.5. Other Types
- 10.2. Market Analysis, Insights and Forecast - by Application
- 10.2.1. Renal Disorder
- 10.2.2. Cancer
- 10.2.3. Acquired Immunodeficiency Sydnrome (AIDSs)
- 10.2.4. Anemia of Chronic Inflammatory Syndromes
- 10.2.5. Other Applications
- 10.1. Market Analysis, Insights and Forecast - by Type
- 11. Competitive Analysis
- 11.1. Global Market Share Analysis 2024
- 11.2. Company Profiles
- 11.2.1 3Sbio Group
- 11.2.1.1. Overview
- 11.2.1.2. Products
- 11.2.1.3. SWOT Analysis
- 11.2.1.4. Recent Developments
- 11.2.1.5. Financials (Based on Availability)
- 11.2.2 Amgen Inc
- 11.2.2.1. Overview
- 11.2.2.2. Products
- 11.2.2.3. SWOT Analysis
- 11.2.2.4. Recent Developments
- 11.2.2.5. Financials (Based on Availability)
- 11.2.3 Biocon
- 11.2.3.1. Overview
- 11.2.3.2. Products
- 11.2.3.3. SWOT Analysis
- 11.2.3.4. Recent Developments
- 11.2.3.5. Financials (Based on Availability)
- 11.2.4 Bio-Rad Laboratories Inc
- 11.2.4.1. Overview
- 11.2.4.2. Products
- 11.2.4.3. SWOT Analysis
- 11.2.4.4. Recent Developments
- 11.2.4.5. Financials (Based on Availability)
- 11.2.5 Eve Technologies
- 11.2.5.1. Overview
- 11.2.5.2. Products
- 11.2.5.3. SWOT Analysis
- 11.2.5.4. Recent Developments
- 11.2.5.5. Financials (Based on Availability)
- 11.2.6 F Hoffmann-La Roche Ltd
- 11.2.6.1. Overview
- 11.2.6.2. Products
- 11.2.6.3. SWOT Analysis
- 11.2.6.4. Recent Developments
- 11.2.6.5. Financials (Based on Availability)
- 11.2.7 Merck KGaA
- 11.2.7.1. Overview
- 11.2.7.2. Products
- 11.2.7.3. SWOT Analysis
- 11.2.7.4. Recent Developments
- 11.2.7.5. Financials (Based on Availability)
- 11.2.8 Pfizer Inc
- 11.2.8.1. Overview
- 11.2.8.2. Products
- 11.2.8.3. SWOT Analysis
- 11.2.8.4. Recent Developments
- 11.2.8.5. Financials (Based on Availability)
- 11.2.9 Siemens Healthineers AG
- 11.2.9.1. Overview
- 11.2.9.2. Products
- 11.2.9.3. SWOT Analysis
- 11.2.9.4. Recent Developments
- 11.2.9.5. Financials (Based on Availability)
- 11.2.10 Kyowa Kirin Co Ltd
- 11.2.10.1. Overview
- 11.2.10.2. Products
- 11.2.10.3. SWOT Analysis
- 11.2.10.4. Recent Developments
- 11.2.10.5. Financials (Based on Availability)
- 11.2.11 GenScript
- 11.2.11.1. Overview
- 11.2.11.2. Products
- 11.2.11.3. SWOT Analysis
- 11.2.11.4. Recent Developments
- 11.2.11.5. Financials (Based on Availability)
- 11.2.12 Bioagilytix Labs*List Not Exhaustive
- 11.2.12.1. Overview
- 11.2.12.2. Products
- 11.2.12.3. SWOT Analysis
- 11.2.12.4. Recent Developments
- 11.2.12.5. Financials (Based on Availability)
- 11.2.1 3Sbio Group
List of Figures
- Figure 1: Global EPO Biomarkers Market Revenue Breakdown (Million, %) by Region 2024 & 2032
- Figure 2: Global EPO Biomarkers Market Volume Breakdown (Billion, %) by Region 2024 & 2032
- Figure 3: North America EPO Biomarkers Market Revenue (Million), by Type 2024 & 2032
- Figure 4: North America EPO Biomarkers Market Volume (Billion), by Type 2024 & 2032
- Figure 5: North America EPO Biomarkers Market Revenue Share (%), by Type 2024 & 2032
- Figure 6: North America EPO Biomarkers Market Volume Share (%), by Type 2024 & 2032
- Figure 7: North America EPO Biomarkers Market Revenue (Million), by Application 2024 & 2032
- Figure 8: North America EPO Biomarkers Market Volume (Billion), by Application 2024 & 2032
- Figure 9: North America EPO Biomarkers Market Revenue Share (%), by Application 2024 & 2032
- Figure 10: North America EPO Biomarkers Market Volume Share (%), by Application 2024 & 2032
- Figure 11: North America EPO Biomarkers Market Revenue (Million), by Country 2024 & 2032
- Figure 12: North America EPO Biomarkers Market Volume (Billion), by Country 2024 & 2032
- Figure 13: North America EPO Biomarkers Market Revenue Share (%), by Country 2024 & 2032
- Figure 14: North America EPO Biomarkers Market Volume Share (%), by Country 2024 & 2032
- Figure 15: Europe EPO Biomarkers Market Revenue (Million), by Type 2024 & 2032
- Figure 16: Europe EPO Biomarkers Market Volume (Billion), by Type 2024 & 2032
- Figure 17: Europe EPO Biomarkers Market Revenue Share (%), by Type 2024 & 2032
- Figure 18: Europe EPO Biomarkers Market Volume Share (%), by Type 2024 & 2032
- Figure 19: Europe EPO Biomarkers Market Revenue (Million), by Application 2024 & 2032
- Figure 20: Europe EPO Biomarkers Market Volume (Billion), by Application 2024 & 2032
- Figure 21: Europe EPO Biomarkers Market Revenue Share (%), by Application 2024 & 2032
- Figure 22: Europe EPO Biomarkers Market Volume Share (%), by Application 2024 & 2032
- Figure 23: Europe EPO Biomarkers Market Revenue (Million), by Country 2024 & 2032
- Figure 24: Europe EPO Biomarkers Market Volume (Billion), by Country 2024 & 2032
- Figure 25: Europe EPO Biomarkers Market Revenue Share (%), by Country 2024 & 2032
- Figure 26: Europe EPO Biomarkers Market Volume Share (%), by Country 2024 & 2032
- Figure 27: Asia Pacific EPO Biomarkers Market Revenue (Million), by Type 2024 & 2032
- Figure 28: Asia Pacific EPO Biomarkers Market Volume (Billion), by Type 2024 & 2032
- Figure 29: Asia Pacific EPO Biomarkers Market Revenue Share (%), by Type 2024 & 2032
- Figure 30: Asia Pacific EPO Biomarkers Market Volume Share (%), by Type 2024 & 2032
- Figure 31: Asia Pacific EPO Biomarkers Market Revenue (Million), by Application 2024 & 2032
- Figure 32: Asia Pacific EPO Biomarkers Market Volume (Billion), by Application 2024 & 2032
- Figure 33: Asia Pacific EPO Biomarkers Market Revenue Share (%), by Application 2024 & 2032
- Figure 34: Asia Pacific EPO Biomarkers Market Volume Share (%), by Application 2024 & 2032
- Figure 35: Asia Pacific EPO Biomarkers Market Revenue (Million), by Country 2024 & 2032
- Figure 36: Asia Pacific EPO Biomarkers Market Volume (Billion), by Country 2024 & 2032
- Figure 37: Asia Pacific EPO Biomarkers Market Revenue Share (%), by Country 2024 & 2032
- Figure 38: Asia Pacific EPO Biomarkers Market Volume Share (%), by Country 2024 & 2032
- Figure 39: Middle East and Africa EPO Biomarkers Market Revenue (Million), by Type 2024 & 2032
- Figure 40: Middle East and Africa EPO Biomarkers Market Volume (Billion), by Type 2024 & 2032
- Figure 41: Middle East and Africa EPO Biomarkers Market Revenue Share (%), by Type 2024 & 2032
- Figure 42: Middle East and Africa EPO Biomarkers Market Volume Share (%), by Type 2024 & 2032
- Figure 43: Middle East and Africa EPO Biomarkers Market Revenue (Million), by Application 2024 & 2032
- Figure 44: Middle East and Africa EPO Biomarkers Market Volume (Billion), by Application 2024 & 2032
- Figure 45: Middle East and Africa EPO Biomarkers Market Revenue Share (%), by Application 2024 & 2032
- Figure 46: Middle East and Africa EPO Biomarkers Market Volume Share (%), by Application 2024 & 2032
- Figure 47: Middle East and Africa EPO Biomarkers Market Revenue (Million), by Country 2024 & 2032
- Figure 48: Middle East and Africa EPO Biomarkers Market Volume (Billion), by Country 2024 & 2032
- Figure 49: Middle East and Africa EPO Biomarkers Market Revenue Share (%), by Country 2024 & 2032
- Figure 50: Middle East and Africa EPO Biomarkers Market Volume Share (%), by Country 2024 & 2032
- Figure 51: South America EPO Biomarkers Market Revenue (Million), by Type 2024 & 2032
- Figure 52: South America EPO Biomarkers Market Volume (Billion), by Type 2024 & 2032
- Figure 53: South America EPO Biomarkers Market Revenue Share (%), by Type 2024 & 2032
- Figure 54: South America EPO Biomarkers Market Volume Share (%), by Type 2024 & 2032
- Figure 55: South America EPO Biomarkers Market Revenue (Million), by Application 2024 & 2032
- Figure 56: South America EPO Biomarkers Market Volume (Billion), by Application 2024 & 2032
- Figure 57: South America EPO Biomarkers Market Revenue Share (%), by Application 2024 & 2032
- Figure 58: South America EPO Biomarkers Market Volume Share (%), by Application 2024 & 2032
- Figure 59: South America EPO Biomarkers Market Revenue (Million), by Country 2024 & 2032
- Figure 60: South America EPO Biomarkers Market Volume (Billion), by Country 2024 & 2032
- Figure 61: South America EPO Biomarkers Market Revenue Share (%), by Country 2024 & 2032
- Figure 62: South America EPO Biomarkers Market Volume Share (%), by Country 2024 & 2032
List of Tables
- Table 1: Global EPO Biomarkers Market Revenue Million Forecast, by Region 2019 & 2032
- Table 2: Global EPO Biomarkers Market Volume Billion Forecast, by Region 2019 & 2032
- Table 3: Global EPO Biomarkers Market Revenue Million Forecast, by Type 2019 & 2032
- Table 4: Global EPO Biomarkers Market Volume Billion Forecast, by Type 2019 & 2032
- Table 5: Global EPO Biomarkers Market Revenue Million Forecast, by Application 2019 & 2032
- Table 6: Global EPO Biomarkers Market Volume Billion Forecast, by Application 2019 & 2032
- Table 7: Global EPO Biomarkers Market Revenue Million Forecast, by Region 2019 & 2032
- Table 8: Global EPO Biomarkers Market Volume Billion Forecast, by Region 2019 & 2032
- Table 9: Global EPO Biomarkers Market Revenue Million Forecast, by Type 2019 & 2032
- Table 10: Global EPO Biomarkers Market Volume Billion Forecast, by Type 2019 & 2032
- Table 11: Global EPO Biomarkers Market Revenue Million Forecast, by Application 2019 & 2032
- Table 12: Global EPO Biomarkers Market Volume Billion Forecast, by Application 2019 & 2032
- Table 13: Global EPO Biomarkers Market Revenue Million Forecast, by Country 2019 & 2032
- Table 14: Global EPO Biomarkers Market Volume Billion Forecast, by Country 2019 & 2032
- Table 15: United States EPO Biomarkers Market Revenue (Million) Forecast, by Application 2019 & 2032
- Table 16: United States EPO Biomarkers Market Volume (Billion) Forecast, by Application 2019 & 2032
- Table 17: Canada EPO Biomarkers Market Revenue (Million) Forecast, by Application 2019 & 2032
- Table 18: Canada EPO Biomarkers Market Volume (Billion) Forecast, by Application 2019 & 2032
- Table 19: Mexico EPO Biomarkers Market Revenue (Million) Forecast, by Application 2019 & 2032
- Table 20: Mexico EPO Biomarkers Market Volume (Billion) Forecast, by Application 2019 & 2032
- Table 21: Global EPO Biomarkers Market Revenue Million Forecast, by Type 2019 & 2032
- Table 22: Global EPO Biomarkers Market Volume Billion Forecast, by Type 2019 & 2032
- Table 23: Global EPO Biomarkers Market Revenue Million Forecast, by Application 2019 & 2032
- Table 24: Global EPO Biomarkers Market Volume Billion Forecast, by Application 2019 & 2032
- Table 25: Global EPO Biomarkers Market Revenue Million Forecast, by Country 2019 & 2032
- Table 26: Global EPO Biomarkers Market Volume Billion Forecast, by Country 2019 & 2032
- Table 27: Germany EPO Biomarkers Market Revenue (Million) Forecast, by Application 2019 & 2032
- Table 28: Germany EPO Biomarkers Market Volume (Billion) Forecast, by Application 2019 & 2032
- Table 29: United Kingdom EPO Biomarkers Market Revenue (Million) Forecast, by Application 2019 & 2032
- Table 30: United Kingdom EPO Biomarkers Market Volume (Billion) Forecast, by Application 2019 & 2032
- Table 31: France EPO Biomarkers Market Revenue (Million) Forecast, by Application 2019 & 2032
- Table 32: France EPO Biomarkers Market Volume (Billion) Forecast, by Application 2019 & 2032
- Table 33: Italy EPO Biomarkers Market Revenue (Million) Forecast, by Application 2019 & 2032
- Table 34: Italy EPO Biomarkers Market Volume (Billion) Forecast, by Application 2019 & 2032
- Table 35: Spain EPO Biomarkers Market Revenue (Million) Forecast, by Application 2019 & 2032
- Table 36: Spain EPO Biomarkers Market Volume (Billion) Forecast, by Application 2019 & 2032
- Table 37: Rest of Europe EPO Biomarkers Market Revenue (Million) Forecast, by Application 2019 & 2032
- Table 38: Rest of Europe EPO Biomarkers Market Volume (Billion) Forecast, by Application 2019 & 2032
- Table 39: Global EPO Biomarkers Market Revenue Million Forecast, by Type 2019 & 2032
- Table 40: Global EPO Biomarkers Market Volume Billion Forecast, by Type 2019 & 2032
- Table 41: Global EPO Biomarkers Market Revenue Million Forecast, by Application 2019 & 2032
- Table 42: Global EPO Biomarkers Market Volume Billion Forecast, by Application 2019 & 2032
- Table 43: Global EPO Biomarkers Market Revenue Million Forecast, by Country 2019 & 2032
- Table 44: Global EPO Biomarkers Market Volume Billion Forecast, by Country 2019 & 2032
- Table 45: China EPO Biomarkers Market Revenue (Million) Forecast, by Application 2019 & 2032
- Table 46: China EPO Biomarkers Market Volume (Billion) Forecast, by Application 2019 & 2032
- Table 47: Japan EPO Biomarkers Market Revenue (Million) Forecast, by Application 2019 & 2032
- Table 48: Japan EPO Biomarkers Market Volume (Billion) Forecast, by Application 2019 & 2032
- Table 49: India EPO Biomarkers Market Revenue (Million) Forecast, by Application 2019 & 2032
- Table 50: India EPO Biomarkers Market Volume (Billion) Forecast, by Application 2019 & 2032
- Table 51: Australia EPO Biomarkers Market Revenue (Million) Forecast, by Application 2019 & 2032
- Table 52: Australia EPO Biomarkers Market Volume (Billion) Forecast, by Application 2019 & 2032
- Table 53: South Korea EPO Biomarkers Market Revenue (Million) Forecast, by Application 2019 & 2032
- Table 54: South Korea EPO Biomarkers Market Volume (Billion) Forecast, by Application 2019 & 2032
- Table 55: Rest of Asia Pacific EPO Biomarkers Market Revenue (Million) Forecast, by Application 2019 & 2032
- Table 56: Rest of Asia Pacific EPO Biomarkers Market Volume (Billion) Forecast, by Application 2019 & 2032
- Table 57: Global EPO Biomarkers Market Revenue Million Forecast, by Type 2019 & 2032
- Table 58: Global EPO Biomarkers Market Volume Billion Forecast, by Type 2019 & 2032
- Table 59: Global EPO Biomarkers Market Revenue Million Forecast, by Application 2019 & 2032
- Table 60: Global EPO Biomarkers Market Volume Billion Forecast, by Application 2019 & 2032
- Table 61: Global EPO Biomarkers Market Revenue Million Forecast, by Country 2019 & 2032
- Table 62: Global EPO Biomarkers Market Volume Billion Forecast, by Country 2019 & 2032
- Table 63: GCC EPO Biomarkers Market Revenue (Million) Forecast, by Application 2019 & 2032
- Table 64: GCC EPO Biomarkers Market Volume (Billion) Forecast, by Application 2019 & 2032
- Table 65: South Africa EPO Biomarkers Market Revenue (Million) Forecast, by Application 2019 & 2032
- Table 66: South Africa EPO Biomarkers Market Volume (Billion) Forecast, by Application 2019 & 2032
- Table 67: Rest of Middle East and Africa EPO Biomarkers Market Revenue (Million) Forecast, by Application 2019 & 2032
- Table 68: Rest of Middle East and Africa EPO Biomarkers Market Volume (Billion) Forecast, by Application 2019 & 2032
- Table 69: Global EPO Biomarkers Market Revenue Million Forecast, by Type 2019 & 2032
- Table 70: Global EPO Biomarkers Market Volume Billion Forecast, by Type 2019 & 2032
- Table 71: Global EPO Biomarkers Market Revenue Million Forecast, by Application 2019 & 2032
- Table 72: Global EPO Biomarkers Market Volume Billion Forecast, by Application 2019 & 2032
- Table 73: Global EPO Biomarkers Market Revenue Million Forecast, by Country 2019 & 2032
- Table 74: Global EPO Biomarkers Market Volume Billion Forecast, by Country 2019 & 2032
- Table 75: Brazil EPO Biomarkers Market Revenue (Million) Forecast, by Application 2019 & 2032
- Table 76: Brazil EPO Biomarkers Market Volume (Billion) Forecast, by Application 2019 & 2032
- Table 77: Argentina EPO Biomarkers Market Revenue (Million) Forecast, by Application 2019 & 2032
- Table 78: Argentina EPO Biomarkers Market Volume (Billion) Forecast, by Application 2019 & 2032
- Table 79: Rest of South America EPO Biomarkers Market Revenue (Million) Forecast, by Application 2019 & 2032
- Table 80: Rest of South America EPO Biomarkers Market Volume (Billion) Forecast, by Application 2019 & 2032
Frequently Asked Questions
1. What is the projected Compound Annual Growth Rate (CAGR) of the EPO Biomarkers Market?
The projected CAGR is approximately 5.49%.
2. Which companies are prominent players in the EPO Biomarkers Market?
Key companies in the market include 3Sbio Group, Amgen Inc, Biocon, Bio-Rad Laboratories Inc, Eve Technologies, F Hoffmann-La Roche Ltd, Merck KGaA, Pfizer Inc, Siemens Healthineers AG, Kyowa Kirin Co Ltd, GenScript, Bioagilytix Labs*List Not Exhaustive.
3. What are the main segments of the EPO Biomarkers Market?
The market segments include Type, Application.
4. Can you provide details about the market size?
The market size is estimated to be USD 66.38 Million as of 2022.
5. What are some drivers contributing to market growth?
Increasing Prevalence of Cancer and End-Stage Renal Disease (ESRD); Favorable Healthcare Regulations In Developed Economies; Increasing Research and Development in EPO Biomarker Technology.
6. What are the notable trends driving market growth?
The Cancer Segment by Application is Expected Witness Significant Growth During the Forecast Period.
7. Are there any restraints impacting market growth?
Increasing Prevalence of Cancer and End-Stage Renal Disease (ESRD); Favorable Healthcare Regulations In Developed Economies; Increasing Research and Development in EPO Biomarker Technology.
8. Can you provide examples of recent developments in the market?
March 2024: CSL Vifor, in partnership with Akebia Therapeutics Inc., received the United States Food and Drug Administration (FDA) approval for Vafseo (vadadustat), developed by Akebia. It is an oral hypoxia-inducible factor prolyl hydroxylase inhibitor indicated to treat anemia caused by chronic kidney disease in adults who receive dialysis for at least three months.
9. What pricing options are available for accessing the report?
Pricing options include single-user, multi-user, and enterprise licenses priced at USD 4750, USD 5250, and USD 8750 respectively.
10. Is the market size provided in terms of value or volume?
The market size is provided in terms of value, measured in Million and volume, measured in Billion.
11. Are there any specific market keywords associated with the report?
Yes, the market keyword associated with the report is "EPO Biomarkers Market," which aids in identifying and referencing the specific market segment covered.
12. How do I determine which pricing option suits my needs best?
The pricing options vary based on user requirements and access needs. Individual users may opt for single-user licenses, while businesses requiring broader access may choose multi-user or enterprise licenses for cost-effective access to the report.
13. Are there any additional resources or data provided in the EPO Biomarkers Market report?
While the report offers comprehensive insights, it's advisable to review the specific contents or supplementary materials provided to ascertain if additional resources or data are available.
14. How can I stay updated on further developments or reports in the EPO Biomarkers Market?
To stay informed about further developments, trends, and reports in the EPO Biomarkers Market, consider subscribing to industry newsletters, following relevant companies and organizations, or regularly checking reputable industry news sources and publications.
Methodology
Step 1 - Identification of Relevant Samples Size from Population Database


Step 2 - Approaches for Defining Global Market Size (Value, Volume* & Price*)

Note*: In applicable scenarios
Step 3 - Data Sources
Primary Research
- Web Analytics
- Survey Reports
- Research Institute
- Latest Research Reports
- Opinion Leaders
Secondary Research
- Annual Reports
- White Paper
- Latest Press Release
- Industry Association
- Paid Database
- Investor Presentations

Step 4 - Data Triangulation
Involves using different sources of information in order to increase the validity of a study
These sources are likely to be stakeholders in a program - participants, other researchers, program staff, other community members, and so on.
Then we put all data in single framework & apply various statistical tools to find out the dynamic on the market.
During the analysis stage, feedback from the stakeholder groups would be compared to determine areas of agreement as well as areas of divergence


