Key Insights
The European natural gas market, currently valued at €401.9 billion (2025), is projected to grow at a Compound Annual Growth Rate (CAGR) of 1.4% through 2033. This growth is underpinned by increasing industrialization and urbanization driving energy demand, alongside natural gas's role as a transitional fuel in the clean energy transition. Enhanced energy security concerns also necessitate diversification of supply and investment in infrastructure. Key challenges include environmental considerations regarding methane emissions, the rapid expansion of renewable energy sources, and price volatility influenced by global markets and competition from other energy alternatives like renewables and nuclear power. Market segmentation reveals varying growth rates across European nations, with countries advanced in renewable integration experiencing slower gas consumption growth compared to those with a greater reliance on traditional energy sources. Major energy corporations such as Chevron, BP, Shell, and TotalEnergies are strategically navigating this complex environment by investing in both gas production and renewable energy initiatives.
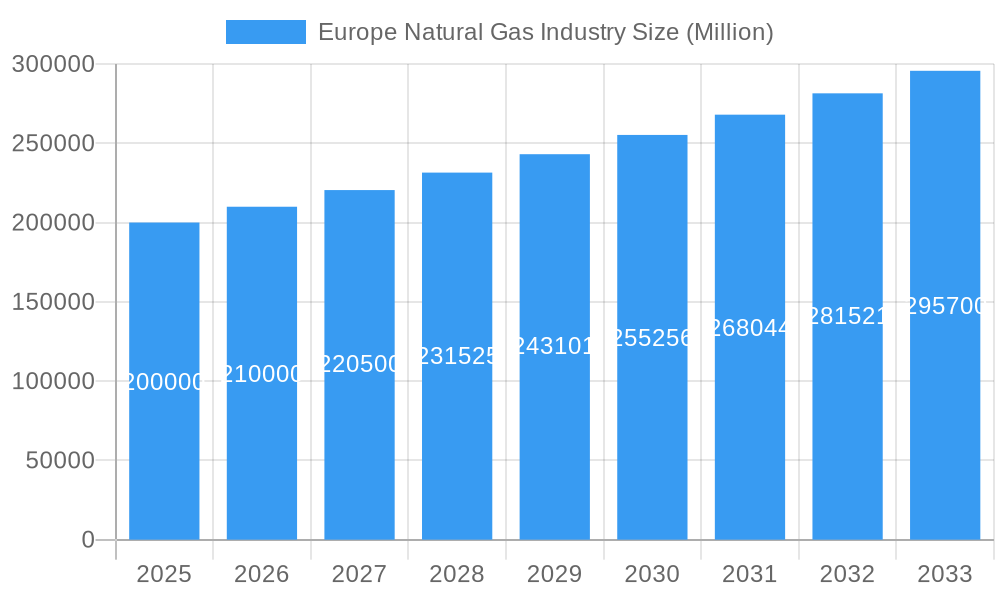
Europe Natural Gas Industry Market Size (In Billion)
The competitive landscape features a blend of established international energy firms and regional players. Anticipated trends include market consolidation and strategic alliances to optimize portfolios. Significant regional disparities in market dynamics are evident, influenced by the pace of renewable energy adoption, regulatory frameworks, and the availability of domestic gas resources. For instance, Eastern European countries may exhibit distinct growth patterns compared to Western European nations due to differing energy mixes and geopolitical contexts. Over the forecast period (2025-2033), market share dynamics are expected to evolve, with companies focusing on technological advancements and strategic collaborations to boost efficiency and minimize environmental impact. Success in this evolving market will depend on adaptability to changing regulations, securing resilient supply chains, and proactively managing environmental and social risks.
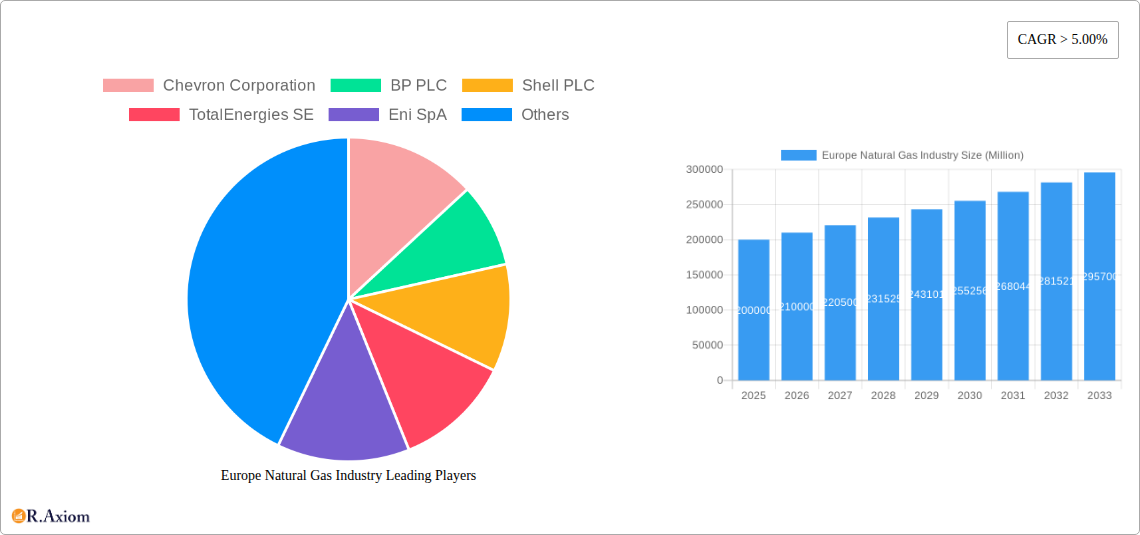
Europe Natural Gas Industry Company Market Share
This comprehensive report offers an in-depth analysis of the Europe Natural Gas Industry, examining market dynamics, the competitive landscape, and future growth projections for the period 2019-2033. The historical analysis covers 2019-2024, with 2025 serving as the base year, and forecasts extend to 2033. The report provides actionable intelligence derived from robust data analysis and expert insights, catering to industry stakeholders, investors, and policymakers.
Europe Natural Gas Industry Market Concentration & Innovation
This section analyzes the market concentration, identifying key players and their market shares. It also explores innovation drivers, regulatory landscapes, substitute products, end-user trends, and merger and acquisition (M&A) activities within the European natural gas sector. The analysis encompasses the historical period (2019-2024) and projects into the future (2025-2033).
Market Concentration: The European natural gas market exhibits moderate concentration, with a few major players holding significant shares. Precise market share data for each company requires detailed proprietary data not available at this time. However, preliminary estimates suggest that the top five companies (Chevron Corporation, BP PLC, Shell PLC, TotalEnergies SE, and Eni SpA) collectively control approximately xx% of the market in 2024. This concentration is expected to xx% by 2033.
Innovation Drivers: Key innovation drivers include technological advancements in exploration and production, improved efficiency in transportation and storage, and the development of cleaner gas technologies (e.g., carbon capture and storage).
Regulatory Frameworks: EU regulations concerning emissions standards, energy security, and market liberalization significantly influence industry operations and investment decisions. Upcoming regulations will likely further shape the market landscape.
Product Substitutes: The increasing penetration of renewable energy sources (solar, wind) and the potential for wider hydrogen adoption pose a challenge to natural gas as a primary energy source. However, natural gas is expected to remain a significant energy source, particularly in power generation and industrial processes for the foreseeable future.
End-User Trends: The industrial sector remains the largest consumer of natural gas in Europe. However, growing emphasis on energy efficiency and decarbonization will influence future demand patterns.
M&A Activities: The European natural gas industry has witnessed significant M&A activity in recent years, driven by consolidation efforts, strategic expansions, and the pursuit of enhanced market positions. The total value of M&A deals during the historical period (2019-2024) is estimated at USD xx billion. Future M&A activity is anticipated to increase, driven by consolidation and a changing regulatory environment.
Europe Natural Gas Industry Industry Trends & Insights
This section delves into the key trends shaping the European natural gas market, including market growth drivers, technological disruptions, evolving consumer preferences, and the competitive dynamics at play. The analysis is based on rigorous market research and incorporates data from various sources, resulting in a comprehensive understanding of the industry. Growth is projected based on historical trends, technological developments, and regulatory policies.
The CAGR (Compound Annual Growth Rate) for the European natural gas market is projected to be xx% during the forecast period (2025-2033), driven by increasing energy demand in some sectors, despite the increasing penetration of renewable energy sources. Market penetration of natural gas in various sectors is expected to remain high during the projection period, although this may shift as countries transition to alternative energy sources. Technological disruptions, such as the increased adoption of liquefied natural gas (LNG) and the development of innovative gas technologies, are likely to increase in the coming years and shape the industry’s growth trajectory. Competition remains intense, with key players focusing on cost optimization, operational efficiency, and strategic alliances to maintain their market positions. The evolving regulatory framework, particularly concerning carbon emissions and energy security, will influence growth patterns in the coming years. The projected market size in 2033 is anticipated to reach USD xx billion.
Dominant Markets & Segments in Europe Natural Gas Industry
This section identifies the leading regions, countries, and market segments within the European natural gas industry, analyzing the factors underpinning their dominance.
- Key Drivers of Dominance:
- Germany: Strong industrial base, robust infrastructure, and significant gas consumption drive Germany's dominance.
- United Kingdom: Established gas production and infrastructure.
- Norway: Large reserves and growing LNG exports.
- Netherlands: Significant gas production and strategic location.
The detailed analysis of dominance points to strong industrial activity, access to existing gas infrastructure, and governmental policy as key elements for regional supremacy. Germany remains the leading market due to its enormous industrial sector and ongoing energy needs, with its total natural gas market reaching USD xx billion in 2024. This leadership is expected to continue, though at a potentially slower pace given increased investment in renewable sources.
Europe Natural Gas Industry Product Developments
The European natural gas industry is witnessing continuous product development and innovation, primarily driven by a focus on efficiency, safety, and environmental considerations. These innovations include advancements in exploration and extraction technologies, improved pipeline infrastructure, optimized storage facilities, and the development of LNG technologies, enabling efficient transportation and distribution of natural gas. Furthermore, research and development are underway to explore cleaner natural gas utilization and carbon capture technologies, addressing growing environmental concerns. The market fit of these developments is driven by the continuing need for reliable and efficient energy sources, coupled with growing pressures to reduce environmental impact.
Report Scope & Segmentation Analysis
This report offers a comprehensive segmentation analysis of the European natural gas market. The key segments include:
By Source: Domestic production, imports (pipeline and LNG). The import segment is expected to experience xx% growth over the forecast period, driven by increasing energy demand and domestic production constraints.
By Application: Power generation, industrial, residential, and commercial. The power generation segment dominates the market and is projected to continue its leadership with a market share of xx% in 2033.
By Region: Germany, United Kingdom, Netherlands, Norway, France, Italy, and others. Regional segmentation shows varied market dynamics, influenced by local regulatory landscapes, energy policies, and infrastructure development.
Key Drivers of Europe Natural Gas Industry Growth
The growth of the European natural gas industry is driven by a complex interplay of factors:
- Increasing Energy Demand: Growing industrial activity and expanding populations fuel demand.
- Reliable and Efficient Energy Source: Natural gas provides a reliable energy source for power generation and various industrial applications.
- Governmental Policies: Government support for gas infrastructure development and energy security initiatives boost the sector.
- Technological Advancements: Innovations in exploration, production, and transportation enhance efficiency and reduce costs.
Challenges in the Europe Natural Gas Industry Sector
The European natural gas industry faces significant challenges:
- Geopolitical Instability: Dependence on gas imports creates vulnerability to geopolitical events. The disruptions in Russian gas supply in 2022 demonstrated this vulnerability resulting in an estimated economic loss of USD xx billion.
- Environmental Concerns: Greenhouse gas emissions associated with natural gas production and consumption necessitate cleaner energy technologies.
- Price Volatility: Fluctuating natural gas prices negatively impact consumers and industries. The price volatility has increased the cost of operations and decreased profitability for several companies.
Emerging Opportunities in Europe Natural Gas Industry
The European natural gas market presents several emerging opportunities:
- LNG Imports: Diversification of gas sources through increased LNG imports enhances energy security.
- Renewable Gas Integration: Blending biomethane with natural gas to reduce carbon emissions.
- Hydrogen Production: Natural gas can be used as feedstock for hydrogen production.
Leading Players in the Europe Natural Gas Industry Market
Key Developments in Europe Natural Gas Industry Industry
- September 2022: The German government announced a USD 65 billion plan to mitigate soaring energy prices, significantly impacting market dynamics.
- March 2022: Equinor's increased gas supply to Europe in response to the disruption of Russian supplies significantly affected market stability. The increased production permits from the Ministry of Petroleum and Energy allowed for increased exports from the Oseberg and Troll fields (around 1 bcm) and Heidrun (0.4 bcm) during 2022.
Strategic Outlook for Europe Natural Gas Industry Market
The future of the European natural gas market hinges on a delicate balance between energy security, affordability, and environmental sustainability. While natural gas will likely remain a significant energy source for the foreseeable future, the increasing adoption of renewable energy sources and the ongoing pressure to reduce greenhouse gas emissions will shape market evolution. Strategic investments in gas infrastructure modernization, coupled with initiatives to promote cleaner gas technologies, will be crucial for long-term market growth and stability. The industry needs to adapt to a changing regulatory environment and technological advancements to secure its position in a rapidly evolving energy landscape. The market presents attractive opportunities for companies that can successfully navigate these challenges and embrace sustainable practices.
Europe Natural Gas Industry Segmentation
- 1. Production Analysis
- 2. Consumption Analysis
- 3. Import Market Analysis (Value & Volume)
- 4. Export Market Analysis (Value & Volume)
- 5. Price Trend Analysis
Europe Natural Gas Industry Segmentation By Geography
-
1. Europe
- 1.1. United Kingdom
- 1.2. Germany
- 1.3. France
- 1.4. Italy
- 1.5. Spain
- 1.6. Netherlands
- 1.7. Belgium
- 1.8. Sweden
- 1.9. Norway
- 1.10. Poland
- 1.11. Denmark
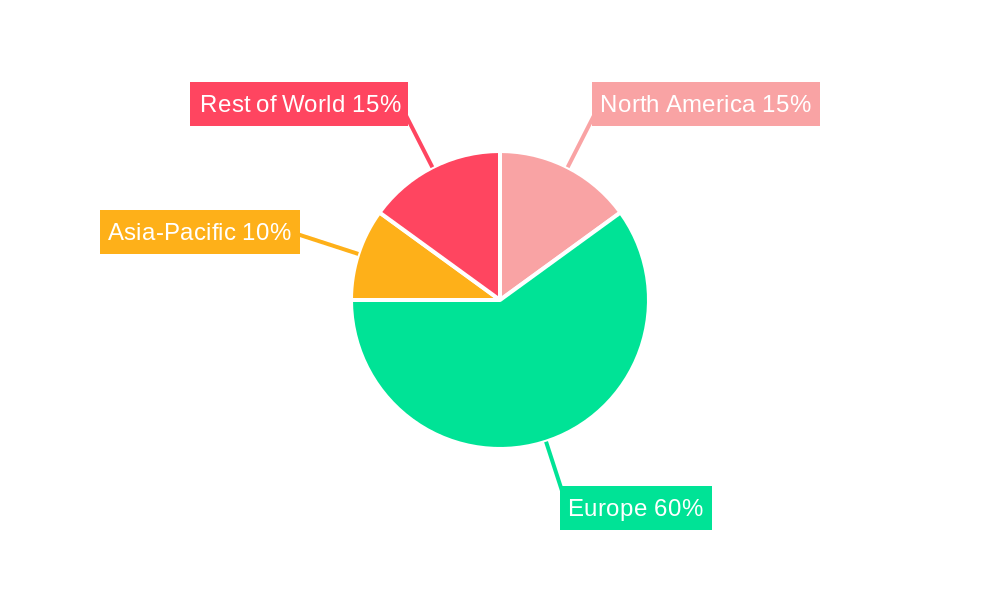
Europe Natural Gas Industry Regional Market Share
Geographic Coverage of Europe Natural Gas Industry
Europe Natural Gas Industry REPORT HIGHLIGHTS
| Aspects | Details |
|---|---|
| Study Period | 2020-2034 |
| Base Year | 2025 |
| Estimated Year | 2026 |
| Forecast Period | 2026-2034 |
| Historical Period | 2020-2025 |
| Growth Rate | CAGR of 1.4% from 2020-2034 |
| Segmentation |
|
Table of Contents
- 1. Introduction
- 1.1. Research Scope
- 1.2. Market Segmentation
- 1.3. Research Objective
- 1.4. Definitions and Assumptions
- 2. Executive Summary
- 2.1. Market Snapshot
- 3. Market Dynamics
- 3.1. Market Drivers
- 3.2. Market Restrains
- 3.3. Market Trends
- 3.4. Market Opportunities
- 4. Market Factor Analysis
- 4.1. Porters Five Forces
- 4.1.1. Bargaining Power of Suppliers
- 4.1.2. Bargaining Power of Buyers
- 4.1.3. Threat of New Entrants
- 4.1.4. Threat of Substitutes
- 4.1.5. Competitive Rivalry
- 4.2. PESTEL analysis
- 4.3. BCG Analysis
- 4.3.1. Stars (High Growth, High Market Share)
- 4.3.2. Cash Cows (Low Growth, High Market Share)
- 4.3.3. Question Mark (High Growth, Low Market Share)
- 4.3.4. Dogs (Low Growth, Low Market Share)
- 4.4. Ansoff Matrix Analysis
- 4.5. Supply Chain Analysis
- 4.6. Regulatory Landscape
- 4.7. Current Market Potential and Opportunity Assessment (TAM–SAM–SOM Framework)
- 4.8. RAX Analyst Note
- 4.1. Porters Five Forces
- 5. Market Analysis, Insights and Forecast 2021-2033
- 5.1. Market Analysis, Insights and Forecast - by Production Analysis
- 5.2. Market Analysis, Insights and Forecast - by Consumption Analysis
- 5.3. Market Analysis, Insights and Forecast - by Import Market Analysis (Value & Volume)
- 5.4. Market Analysis, Insights and Forecast - by Export Market Analysis (Value & Volume)
- 5.5. Market Analysis, Insights and Forecast - by Price Trend Analysis
- 5.6. Market Analysis, Insights and Forecast - by Region
- 5.6.1. Europe
- 6. Europe Natural Gas Industry Analysis, Insights and Forecast, 2021-2033
- 6.1. Market Analysis, Insights and Forecast - by Production Analysis
- 6.2. Market Analysis, Insights and Forecast - by Consumption Analysis
- 6.3. Market Analysis, Insights and Forecast - by Import Market Analysis (Value & Volume)
- 6.4. Market Analysis, Insights and Forecast - by Export Market Analysis (Value & Volume)
- 6.5. Market Analysis, Insights and Forecast - by Price Trend Analysis
- 7. Competitive Analysis
- 7.1. Company Profiles
- 7.1.1 Chevron Corporation
- 7.1.1.1. Company Overview
- 7.1.1.2. Products
- 7.1.1.3. Company Financials
- 7.1.1.4. SWOT Analysis
- 7.1.2 BP PLC
- 7.1.2.1. Company Overview
- 7.1.2.2. Products
- 7.1.2.3. Company Financials
- 7.1.2.4. SWOT Analysis
- 7.1.3 Shell PLC
- 7.1.3.1. Company Overview
- 7.1.3.2. Products
- 7.1.3.3. Company Financials
- 7.1.3.4. SWOT Analysis
- 7.1.4 TotalEnergies SE
- 7.1.4.1. Company Overview
- 7.1.4.2. Products
- 7.1.4.3. Company Financials
- 7.1.4.4. SWOT Analysis
- 7.1.5 Eni SpA
- 7.1.5.1. Company Overview
- 7.1.5.2. Products
- 7.1.5.3. Company Financials
- 7.1.5.4. SWOT Analysis
- 7.1.6 ConocoPhillips
- 7.1.6.1. Company Overview
- 7.1.6.2. Products
- 7.1.6.3. Company Financials
- 7.1.6.4. SWOT Analysis
- 7.1.7 Exxon Mobil Corporation
- 7.1.7.1. Company Overview
- 7.1.7.2. Products
- 7.1.7.3. Company Financials
- 7.1.7.4. SWOT Analysis
- 7.1.8 Norwegian Energy Company ASA
- 7.1.8.1. Company Overview
- 7.1.8.2. Products
- 7.1.8.3. Company Financials
- 7.1.8.4. SWOT Analysis
- 7.1.9 Engie SA
- 7.1.9.1. Company Overview
- 7.1.9.2. Products
- 7.1.9.3. Company Financials
- 7.1.9.4. SWOT Analysis
- 7.1.10 Electricite de France SA*List Not Exhaustive
- 7.1.10.1. Company Overview
- 7.1.10.2. Products
- 7.1.10.3. Company Financials
- 7.1.10.4. SWOT Analysis
- 7.1.1 Chevron Corporation
- 7.2. Market Entropy
- 7.2.1 Company's Key Areas Served
- 7.2.2 Recent Developments
- 7.3. Company Market Share Analysis 2025
- 7.3.1 Top 5 Companies Market Share Analysis
- 7.3.2 Top 3 Companies Market Share Analysis
- 7.4. List of Potential Customers
- 8. Research Methodology
List of Figures
- Figure 1: Europe Natural Gas Industry Revenue Breakdown (billion, %) by Product 2025 & 2033
- Figure 2: Europe Natural Gas Industry Share (%) by Company 2025
List of Tables
- Table 1: Europe Natural Gas Industry Revenue billion Forecast, by Production Analysis 2020 & 2033
- Table 2: Europe Natural Gas Industry Revenue billion Forecast, by Consumption Analysis 2020 & 2033
- Table 3: Europe Natural Gas Industry Revenue billion Forecast, by Import Market Analysis (Value & Volume) 2020 & 2033
- Table 4: Europe Natural Gas Industry Revenue billion Forecast, by Export Market Analysis (Value & Volume) 2020 & 2033
- Table 5: Europe Natural Gas Industry Revenue billion Forecast, by Price Trend Analysis 2020 & 2033
- Table 6: Europe Natural Gas Industry Revenue billion Forecast, by Region 2020 & 2033
- Table 7: Europe Natural Gas Industry Revenue billion Forecast, by Production Analysis 2020 & 2033
- Table 8: Europe Natural Gas Industry Revenue billion Forecast, by Consumption Analysis 2020 & 2033
- Table 9: Europe Natural Gas Industry Revenue billion Forecast, by Import Market Analysis (Value & Volume) 2020 & 2033
- Table 10: Europe Natural Gas Industry Revenue billion Forecast, by Export Market Analysis (Value & Volume) 2020 & 2033
- Table 11: Europe Natural Gas Industry Revenue billion Forecast, by Price Trend Analysis 2020 & 2033
- Table 12: Europe Natural Gas Industry Revenue billion Forecast, by Country 2020 & 2033
- Table 13: United Kingdom Europe Natural Gas Industry Revenue (billion) Forecast, by Application 2020 & 2033
- Table 14: Germany Europe Natural Gas Industry Revenue (billion) Forecast, by Application 2020 & 2033
- Table 15: France Europe Natural Gas Industry Revenue (billion) Forecast, by Application 2020 & 2033
- Table 16: Italy Europe Natural Gas Industry Revenue (billion) Forecast, by Application 2020 & 2033
- Table 17: Spain Europe Natural Gas Industry Revenue (billion) Forecast, by Application 2020 & 2033
- Table 18: Netherlands Europe Natural Gas Industry Revenue (billion) Forecast, by Application 2020 & 2033
- Table 19: Belgium Europe Natural Gas Industry Revenue (billion) Forecast, by Application 2020 & 2033
- Table 20: Sweden Europe Natural Gas Industry Revenue (billion) Forecast, by Application 2020 & 2033
- Table 21: Norway Europe Natural Gas Industry Revenue (billion) Forecast, by Application 2020 & 2033
- Table 22: Poland Europe Natural Gas Industry Revenue (billion) Forecast, by Application 2020 & 2033
- Table 23: Denmark Europe Natural Gas Industry Revenue (billion) Forecast, by Application 2020 & 2033
Frequently Asked Questions
1. What is the projected Compound Annual Growth Rate (CAGR) of the Europe Natural Gas Industry?
The projected CAGR is approximately 1.4%.
2. Which companies are prominent players in the Europe Natural Gas Industry?
Key companies in the market include Chevron Corporation, BP PLC, Shell PLC, TotalEnergies SE, Eni SpA, ConocoPhillips, Exxon Mobil Corporation, Norwegian Energy Company ASA, Engie SA, Electricite de France SA*List Not Exhaustive.
3. What are the main segments of the Europe Natural Gas Industry?
The market segments include Production Analysis, Consumption Analysis, Import Market Analysis (Value & Volume), Export Market Analysis (Value & Volume), Price Trend Analysis.
4. Can you provide details about the market size?
The market size is estimated to be USD 401.9 billion as of 2022.
5. What are some drivers contributing to market growth?
N/A
6. What are the notable trends driving market growth?
Upstream Sector to Witness Significant Growth.
7. Are there any restraints impacting market growth?
N/A
8. Can you provide examples of recent developments in the market?
In September 2022, the German government announced a USD 65 billion plan to help people and businesses cope with soaring prices. Several European nations introduce emergency measures to prepare for a long winter in the wake of disruption in Russian gas supplies to Europe following the Ukraine war.
9. What pricing options are available for accessing the report?
Pricing options include single-user, multi-user, and enterprise licenses priced at USD 4750, USD 5250, and USD 8750 respectively.
10. Is the market size provided in terms of value or volume?
The market size is provided in terms of value, measured in billion.
11. Are there any specific market keywords associated with the report?
Yes, the market keyword associated with the report is "Europe Natural Gas Industry," which aids in identifying and referencing the specific market segment covered.
12. How do I determine which pricing option suits my needs best?
The pricing options vary based on user requirements and access needs. Individual users may opt for single-user licenses, while businesses requiring broader access may choose multi-user or enterprise licenses for cost-effective access to the report.
13. Are there any additional resources or data provided in the Europe Natural Gas Industry report?
While the report offers comprehensive insights, it's advisable to review the specific contents or supplementary materials provided to ascertain if additional resources or data are available.
14. How can I stay updated on further developments or reports in the Europe Natural Gas Industry?
To stay informed about further developments, trends, and reports in the Europe Natural Gas Industry, consider subscribing to industry newsletters, following relevant companies and organizations, or regularly checking reputable industry news sources and publications.
Methodology
Step 1 - Identification of Relevant Samples Size from Population Database


Step 2 - Approaches for Defining Global Market Size (Value, Volume* & Price*)

Note*: In applicable scenarios
Step 3 - Data Sources
Primary Research
- Web Analytics
- Survey Reports
- Research Institute
- Latest Research Reports
- Opinion Leaders
Secondary Research
- Annual Reports
- White Paper
- Latest Press Release
- Industry Association
- Paid Database
- Investor Presentations

Step 4 - Data Triangulation
Involves using different sources of information in order to increase the validity of a study
These sources are likely to be stakeholders in a program - participants, other researchers, program staff, other community members, and so on.
Then we put all data in single framework & apply various statistical tools to find out the dynamic on the market.
During the analysis stage, feedback from the stakeholder groups would be compared to determine areas of agreement as well as areas of divergence

