
Key Insights
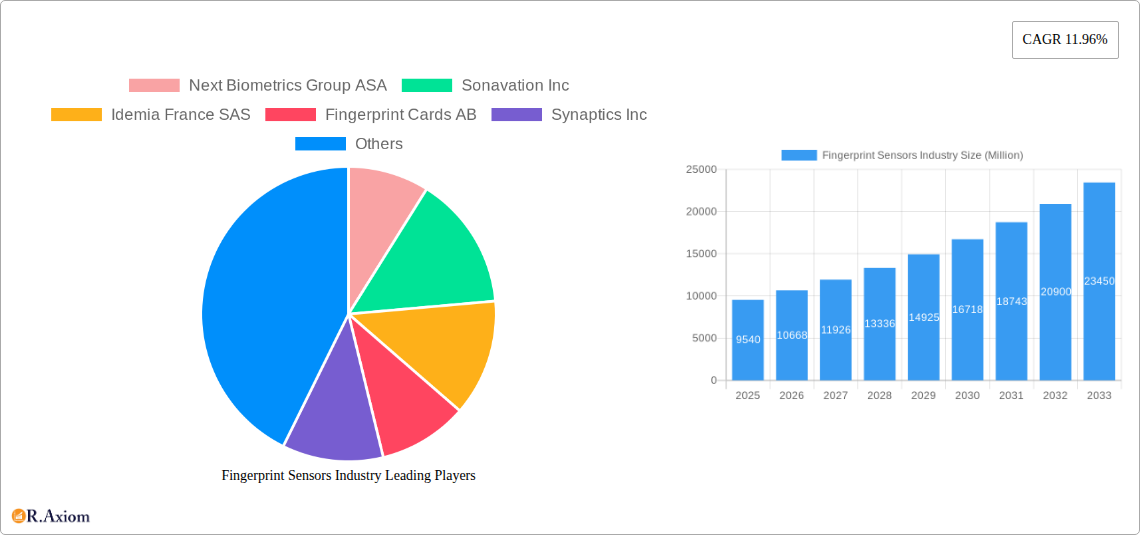
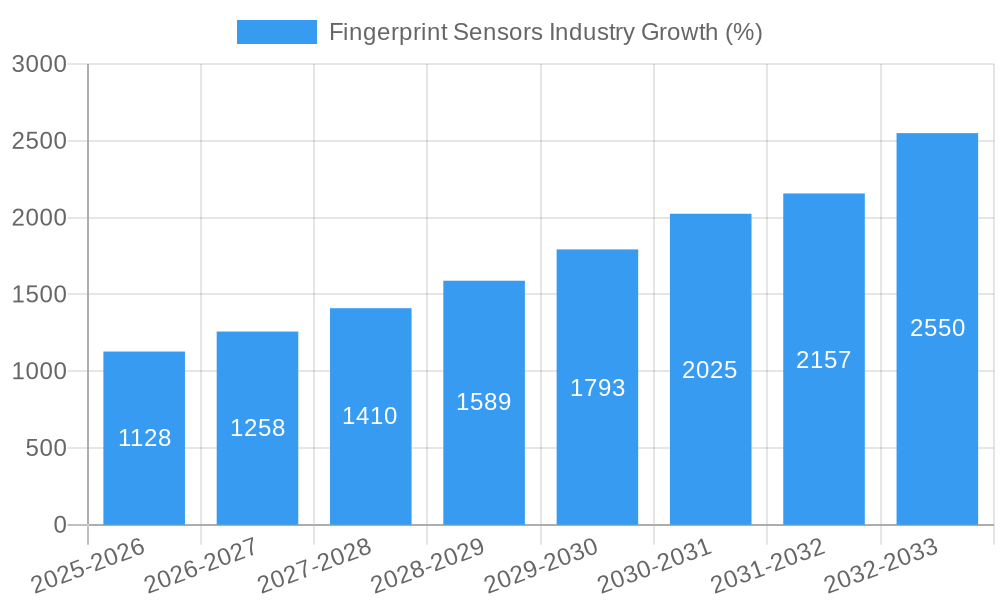
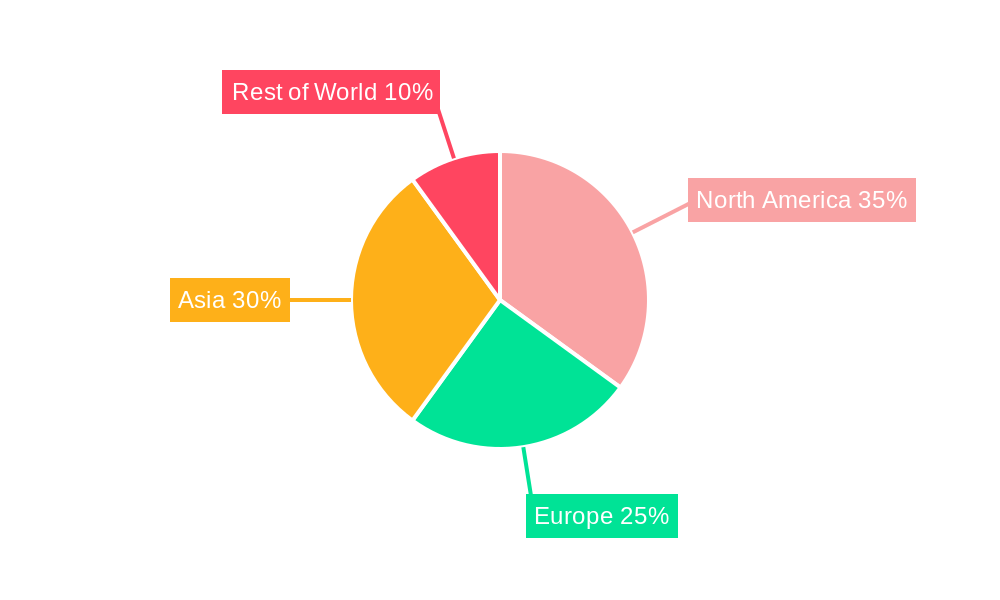
The global fingerprint sensor market is experiencing robust growth, projected to reach a market size of $9.54 billion in 2025 and maintain a Compound Annual Growth Rate (CAGR) of 11.96% from 2025 to 2033. This expansion is driven by several key factors. The increasing adoption of smartphones and other consumer electronics featuring biometric authentication is a significant contributor. Furthermore, the growing demand for secure access control in various sectors, including BFSI (Banking, Financial Services, and Insurance), government, and military & defense, fuels market growth. The rising integration of fingerprint sensors into Internet of Things (IoT) devices, such as smart locks and wearables, further propels market expansion. Technological advancements in sensor types, such as improved capacitive and optical sensors offering enhanced accuracy and speed, are also key drivers. Market segmentation reveals that smartphones and tablets currently dominate application-based revenue, though the IoT segment exhibits strong growth potential. Geographically, North America and Asia are leading regional markets, with China and the United States representing significant consumer bases and manufacturing hubs. However, emerging economies in regions like Asia-Pacific and Latin America are expected to witness substantial growth due to increasing smartphone penetration and government initiatives supporting digitalization.
While the market exhibits significant growth potential, certain restraints exist. The relatively high cost of advanced fingerprint sensor technology, particularly for high-security applications, can limit adoption in price-sensitive markets. Concerns regarding data privacy and security, though continually addressed through improved encryption and authentication protocols, still present a challenge. Furthermore, the development and deployment of alternative biometric technologies like facial recognition and iris scanning pose competitive threats. Nevertheless, the increasing emphasis on user convenience and enhanced security across diverse applications strongly suggests that fingerprint sensors will retain their dominant position in the biometric authentication market for the foreseeable future, with continuous innovation shaping the market landscape.
Fingerprint Sensors Industry: A Comprehensive Market Report (2019-2033)
This detailed report provides a comprehensive analysis of the global fingerprint sensors industry, covering market size, segmentation, growth drivers, challenges, key players, and future outlook. The study period spans from 2019 to 2033, with 2025 serving as the base and estimated year. This report is an invaluable resource for industry stakeholders, investors, and businesses seeking to understand and capitalize on opportunities within this rapidly evolving market.
Fingerprint Sensors Industry Market Concentration & Innovation
The fingerprint sensors market is characterized by a moderately concentrated landscape with several key players vying for market share. While a few dominant companies hold significant portions, numerous smaller players contribute to innovation and competition. Market share dynamics are influenced by factors such as technological advancements, pricing strategies, and strategic partnerships. The estimated market share for the top 5 players in 2025 is approximately 60%, with the remaining share distributed across various other companies. Mergers and acquisitions (M&A) play a significant role in shaping market concentration, with several high-value deals concluded in recent years. For instance, the total value of M&A deals in the fingerprint sensors industry between 2021 and 2023 is estimated at $xx Million. This consolidation trend is expected to continue, driven by companies seeking to expand their product portfolios and geographical reach.
Key innovation drivers include the ongoing development of more accurate, reliable, and secure fingerprint sensors. Advances in sensor technology, such as improved image processing algorithms and the integration of artificial intelligence (AI), are enhancing the overall user experience and expanding application possibilities. Regulatory frameworks, such as data privacy regulations, also influence the market, driving the development of more secure authentication solutions. Product substitutes, such as facial recognition and iris scanning technologies, present competitive challenges, forcing companies to innovate and differentiate their offerings. End-user trends, like the increasing demand for biometric authentication in mobile devices and IoT applications, are further fueling innovation within the industry.
Fingerprint Sensors Industry Industry Trends & Insights
The global fingerprint sensors market is witnessing robust growth, driven by several key factors. The rising adoption of smartphones and other consumer electronics, the increasing demand for secure authentication solutions in various industries, and ongoing technological advancements are major contributors to this growth. The market is projected to register a CAGR of xx% during the forecast period (2025-2033), reaching a market value of $xx Million by 2033. This significant growth is attributed to several factors. Firstly, the ever-increasing integration of biometric authentication into various applications, such as mobile payments, access control, and identity verification, is driving demand. Secondly, the miniaturization and cost reduction of fingerprint sensors are making them accessible to a wider range of applications and consumers. Thirdly, technological improvements, particularly in the accuracy and speed of fingerprint recognition, are enhancing user experience and expanding market penetration.
However, the market also faces challenges. Competition among established players and emerging companies is intense, leading to price pressures. Additionally, concerns around data privacy and security are impacting consumer adoption in certain markets. Despite these challenges, the long-term outlook for the fingerprint sensors market remains positive, driven by the increasing demand for secure and convenient biometric authentication solutions across various sectors. Market penetration is gradually increasing in diverse applications, with significant growth seen in the smartphone and IoT sectors.
Dominant Markets & Segments in Fingerprint Sensors Industry
Dominant Regions/Countries: The Asia-Pacific region dominates the global fingerprint sensors market, driven primarily by strong demand from countries such as China and India, which have large and rapidly growing consumer electronics markets. North America also represents a significant market, fueled by high adoption in sectors such as government and BFSI.
Dominant Segments:
- By Application: Smartphones/Tablets remains the largest segment, owing to the widespread adoption of biometric authentication features in mobile devices. The IoT segment is experiencing rapid growth, driven by the increasing deployment of connected devices in diverse applications such as home security, access control, and healthcare.
- By End-user Industries: The consumer electronics segment dominates, closely followed by the BFSI and Government sectors. Military and defense applications are also a growing segment, albeit smaller compared to consumer electronics.
- By Type: Capacitive fingerprint sensors currently hold the largest market share, driven by their cost-effectiveness and wide compatibility. However, optical and ultrasonic sensors are gaining traction due to their enhanced performance and ability to function with varying surface conditions.
Key Drivers:
- Asia-Pacific: Strong consumer electronics market growth, supportive government policies, and a large population base.
- North America: High adoption of biometric technologies in sectors such as BFSI and government, coupled with strong technological advancements.
- Europe: Stringent data privacy regulations are driving innovation in secure fingerprint authentication technology.
Fingerprint Sensors Industry Product Developments
Recent years have witnessed significant advancements in fingerprint sensor technology, including the development of in-display fingerprint sensors, which offer improved aesthetics and user experience. Other innovations include smaller, more energy-efficient sensors, enhanced algorithms for improved accuracy and speed, and multi-modal biometric systems that combine fingerprint recognition with other biometric methods for enhanced security. These technological advancements are expanding the market reach of fingerprint sensors to a wider range of applications, broadening their applicability from simple unlock mechanisms to more intricate security measures. The market fit of these new technologies is high due to increased demand for enhanced security and user convenience.
Report Scope & Segmentation Analysis
This report comprehensively segments the fingerprint sensors market across various parameters:
By Application: Smartphones/Tablets (projected growth of xx% from 2025-2033, market size of $xx Million in 2025); Laptops (xx% growth, $xx Million in 2025); Smartcards (xx% growth, $xx Million in 2025); IoT and Other Applications (xx% growth, $xx Million in 2025).
By End-user Industries: Military and Defense (xx% growth, $xx Million in 2025); Consumer Electronics (xx% growth, $xx Million in 2025); BFSI (xx% growth, $xx Million in 2025); Government (xx% growth, $xx Million in 2025); Other End-user Industries (xx% growth, $xx Million in 2025).
By Type: Optical (xx% growth, $xx Million in 2025); Capacitive (xx% growth, $xx Million in 2025); Thermal (xx% growth, $xx Million in 2025); Ultrasonic (xx% growth, $xx Million in 2025).
Each segment is analyzed considering market size, growth projections, competitive dynamics, and key trends.
Key Drivers of Fingerprint Sensors Industry Growth
The fingerprint sensors industry’s growth is propelled by several factors: the increasing demand for secure authentication in mobile devices and IoT applications, technological advancements leading to more accurate and reliable sensors, and the rising adoption of biometric authentication across various industries, including BFSI and government. Government initiatives promoting digitalization and strong consumer preference for convenience and security further fuel market expansion. Cost reductions in manufacturing and increasing availability of advanced sensors are also significant drivers.
Challenges in the Fingerprint Sensors Industry Sector
The fingerprint sensors market faces several challenges, including intense competition, concerns over data privacy and security, and the potential for technological disruptions from alternative biometric methods. Supply chain vulnerabilities, particularly regarding the sourcing of key components, and regulatory hurdles in certain regions also impact market growth. The estimated impact of these challenges on market growth is a reduction of xx% in the CAGR.
Emerging Opportunities in Fingerprint Sensors Industry
Emerging opportunities exist in areas such as the integration of fingerprint sensors into next-generation wearable devices, the expansion into new application areas such as healthcare and automotive, and the development of advanced algorithms for enhanced accuracy and security. The rising adoption of AI and machine learning for fraud detection is further boosting market prospects. The development of more robust and secure authentication systems that address concerns regarding data privacy is creating significant opportunities for innovation.
Leading Players in the Fingerprint Sensors Industry Market
- Next Biometrics Group ASA
- Sonavation Inc
- Idemia France SAS
- Fingerprint Cards AB
- Synaptics Inc
- Qualcomm Technologies Inc
- NEC Corporation
- Thales Group (Gemalto NV)
- TDK Corporation
- Shenzhen Goodix Technology Co Ltd
- Idex Biometrics ASA
- Vkansee Technology Inc
- Crucialtec Co Ltd
- Egis Technology Inc
Key Developments in Fingerprint Sensors Industry Industry
- September 2023: Mastercard launched an in-car payment partnership with Mercedes in Germany, enabling fingerprint-based digital payments at service stations. This significantly expands the application of fingerprint sensors beyond mobile devices.
- May 2023: Samsung Display showcased its Sensor OLED Display, embedding fingerprint sensors directly into the display panel, eliminating the need for separate modules. This development significantly enhances the aesthetic appeal and user experience of fingerprint authentication.
Strategic Outlook for Fingerprint Sensors Industry Market
The future of the fingerprint sensors market appears bright. Continuous technological advancements, increasing demand for secure authentication, and expansion into new applications across diverse industries will drive significant growth in the coming years. The market is poised to benefit from the increasing adoption of biometric authentication across various sectors, particularly in emerging economies. Strategic partnerships and collaborations among industry players will further accelerate market expansion and technological advancements. The focus on enhanced security, improved user experience, and cost reduction will remain key factors influencing the market trajectory.
Fingerprint Sensors Industry Segmentation
-
1. Type
- 1.1. Optical
- 1.2. Capacitive
- 1.3. Thermal
- 1.4. Ultrasonic
-
2. Application
- 2.1. Smartphones/Tablets
- 2.2. Laptops
- 2.3. Smartcards
- 2.4. IoT and Other Applications
-
3. End-user Industries
- 3.1. Military and Defense
- 3.2. Consumer Electronics
- 3.3. BFSI
- 3.4. Government
- 3.5. Other End-user Industries
Fingerprint Sensors Industry Segmentation By Geography
-
1. North America
- 1.1. United States
- 1.2. Canada
-
2. Europe
- 2.1. Germany
- 2.2. United Kingdom
- 2.3. France
-
3. Asia
- 3.1. China
- 3.2. Japan
- 3.3. India
- 3.4. South Korea
- 4. Australia and New Zealand
- 5. Latin America
- 6. Middle East and Africa
Fingerprint Sensors Industry REPORT HIGHLIGHTS
| Aspects | Details |
|---|---|
| Study Period | 2019-2033 |
| Base Year | 2024 |
| Estimated Year | 2025 |
| Forecast Period | 2025-2033 |
| Historical Period | 2019-2024 |
| Growth Rate | CAGR of 11.96% from 2019-2033 |
| Segmentation |
|
Table of Contents
- 1. Introduction
- 1.1. Research Scope
- 1.2. Market Segmentation
- 1.3. Research Methodology
- 1.4. Definitions and Assumptions
- 2. Executive Summary
- 2.1. Introduction
- 3. Market Dynamics
- 3.1. Introduction
- 3.2. Market Drivers
- 3.2.1. Increasing Usage of Fingerprint Sensors for Smart Wearable Devices and Smartphones; Need for Secured Security and Business Applications; Government Initiatives to Adopt Biometrics in Various Fields
- 3.3. Market Restrains
- 3.3.1 Increase in Adoption of Substitute Technologies
- 3.3.2 such as Face and Iris Scanning
- 3.4. Market Trends
- 3.4.1. Smartphones Under the Application Segment is Expected to Hold a Major Share
- 4. Market Factor Analysis
- 4.1. Porters Five Forces
- 4.2. Supply/Value Chain
- 4.3. PESTEL analysis
- 4.4. Market Entropy
- 4.5. Patent/Trademark Analysis
- 5. Global Fingerprint Sensors Industry Analysis, Insights and Forecast, 2019-2031
- 5.1. Market Analysis, Insights and Forecast - by Type
- 5.1.1. Optical
- 5.1.2. Capacitive
- 5.1.3. Thermal
- 5.1.4. Ultrasonic
- 5.2. Market Analysis, Insights and Forecast - by Application
- 5.2.1. Smartphones/Tablets
- 5.2.2. Laptops
- 5.2.3. Smartcards
- 5.2.4. IoT and Other Applications
- 5.3. Market Analysis, Insights and Forecast - by End-user Industries
- 5.3.1. Military and Defense
- 5.3.2. Consumer Electronics
- 5.3.3. BFSI
- 5.3.4. Government
- 5.3.5. Other End-user Industries
- 5.4. Market Analysis, Insights and Forecast - by Region
- 5.4.1. North America
- 5.4.2. Europe
- 5.4.3. Asia
- 5.4.4. Australia and New Zealand
- 5.4.5. Latin America
- 5.4.6. Middle East and Africa
- 5.1. Market Analysis, Insights and Forecast - by Type
- 6. North America Fingerprint Sensors Industry Analysis, Insights and Forecast, 2019-2031
- 6.1. Market Analysis, Insights and Forecast - by Type
- 6.1.1. Optical
- 6.1.2. Capacitive
- 6.1.3. Thermal
- 6.1.4. Ultrasonic
- 6.2. Market Analysis, Insights and Forecast - by Application
- 6.2.1. Smartphones/Tablets
- 6.2.2. Laptops
- 6.2.3. Smartcards
- 6.2.4. IoT and Other Applications
- 6.3. Market Analysis, Insights and Forecast - by End-user Industries
- 6.3.1. Military and Defense
- 6.3.2. Consumer Electronics
- 6.3.3. BFSI
- 6.3.4. Government
- 6.3.5. Other End-user Industries
- 6.1. Market Analysis, Insights and Forecast - by Type
- 7. Europe Fingerprint Sensors Industry Analysis, Insights and Forecast, 2019-2031
- 7.1. Market Analysis, Insights and Forecast - by Type
- 7.1.1. Optical
- 7.1.2. Capacitive
- 7.1.3. Thermal
- 7.1.4. Ultrasonic
- 7.2. Market Analysis, Insights and Forecast - by Application
- 7.2.1. Smartphones/Tablets
- 7.2.2. Laptops
- 7.2.3. Smartcards
- 7.2.4. IoT and Other Applications
- 7.3. Market Analysis, Insights and Forecast - by End-user Industries
- 7.3.1. Military and Defense
- 7.3.2. Consumer Electronics
- 7.3.3. BFSI
- 7.3.4. Government
- 7.3.5. Other End-user Industries
- 7.1. Market Analysis, Insights and Forecast - by Type
- 8. Asia Fingerprint Sensors Industry Analysis, Insights and Forecast, 2019-2031
- 8.1. Market Analysis, Insights and Forecast - by Type
- 8.1.1. Optical
- 8.1.2. Capacitive
- 8.1.3. Thermal
- 8.1.4. Ultrasonic
- 8.2. Market Analysis, Insights and Forecast - by Application
- 8.2.1. Smartphones/Tablets
- 8.2.2. Laptops
- 8.2.3. Smartcards
- 8.2.4. IoT and Other Applications
- 8.3. Market Analysis, Insights and Forecast - by End-user Industries
- 8.3.1. Military and Defense
- 8.3.2. Consumer Electronics
- 8.3.3. BFSI
- 8.3.4. Government
- 8.3.5. Other End-user Industries
- 8.1. Market Analysis, Insights and Forecast - by Type
- 9. Australia and New Zealand Fingerprint Sensors Industry Analysis, Insights and Forecast, 2019-2031
- 9.1. Market Analysis, Insights and Forecast - by Type
- 9.1.1. Optical
- 9.1.2. Capacitive
- 9.1.3. Thermal
- 9.1.4. Ultrasonic
- 9.2. Market Analysis, Insights and Forecast - by Application
- 9.2.1. Smartphones/Tablets
- 9.2.2. Laptops
- 9.2.3. Smartcards
- 9.2.4. IoT and Other Applications
- 9.3. Market Analysis, Insights and Forecast - by End-user Industries
- 9.3.1. Military and Defense
- 9.3.2. Consumer Electronics
- 9.3.3. BFSI
- 9.3.4. Government
- 9.3.5. Other End-user Industries
- 9.1. Market Analysis, Insights and Forecast - by Type
- 10. Latin America Fingerprint Sensors Industry Analysis, Insights and Forecast, 2019-2031
- 10.1. Market Analysis, Insights and Forecast - by Type
- 10.1.1. Optical
- 10.1.2. Capacitive
- 10.1.3. Thermal
- 10.1.4. Ultrasonic
- 10.2. Market Analysis, Insights and Forecast - by Application
- 10.2.1. Smartphones/Tablets
- 10.2.2. Laptops
- 10.2.3. Smartcards
- 10.2.4. IoT and Other Applications
- 10.3. Market Analysis, Insights and Forecast - by End-user Industries
- 10.3.1. Military and Defense
- 10.3.2. Consumer Electronics
- 10.3.3. BFSI
- 10.3.4. Government
- 10.3.5. Other End-user Industries
- 10.1. Market Analysis, Insights and Forecast - by Type
- 11. Middle East and Africa Fingerprint Sensors Industry Analysis, Insights and Forecast, 2019-2031
- 11.1. Market Analysis, Insights and Forecast - by Type
- 11.1.1. Optical
- 11.1.2. Capacitive
- 11.1.3. Thermal
- 11.1.4. Ultrasonic
- 11.2. Market Analysis, Insights and Forecast - by Application
- 11.2.1. Smartphones/Tablets
- 11.2.2. Laptops
- 11.2.3. Smartcards
- 11.2.4. IoT and Other Applications
- 11.3. Market Analysis, Insights and Forecast - by End-user Industries
- 11.3.1. Military and Defense
- 11.3.2. Consumer Electronics
- 11.3.3. BFSI
- 11.3.4. Government
- 11.3.5. Other End-user Industries
- 11.1. Market Analysis, Insights and Forecast - by Type
- 12. North America Fingerprint Sensors Industry Analysis, Insights and Forecast, 2019-2031
- 12.1. Market Analysis, Insights and Forecast - By Country/Sub-region
- 12.1.1 United States
- 12.1.2 Canada
- 13. Europe Fingerprint Sensors Industry Analysis, Insights and Forecast, 2019-2031
- 13.1. Market Analysis, Insights and Forecast - By Country/Sub-region
- 13.1.1 Germany
- 13.1.2 United Kingdom
- 13.1.3 France
- 14. Asia Fingerprint Sensors Industry Analysis, Insights and Forecast, 2019-2031
- 14.1. Market Analysis, Insights and Forecast - By Country/Sub-region
- 14.1.1 China
- 14.1.2 Japan
- 14.1.3 India
- 14.1.4 South Korea
- 15. Australia and New Zealand Fingerprint Sensors Industry Analysis, Insights and Forecast, 2019-2031
- 15.1. Market Analysis, Insights and Forecast - By Country/Sub-region
- 15.1.1.
- 16. Latin America Fingerprint Sensors Industry Analysis, Insights and Forecast, 2019-2031
- 16.1. Market Analysis, Insights and Forecast - By Country/Sub-region
- 16.1.1.
- 17. Middle East and Africa Fingerprint Sensors Industry Analysis, Insights and Forecast, 2019-2031
- 17.1. Market Analysis, Insights and Forecast - By Country/Sub-region
- 17.1.1.
- 18. Competitive Analysis
- 18.1. Global Market Share Analysis 2024
- 18.2. Company Profiles
- 18.2.1 Next Biometrics Group ASA
- 18.2.1.1. Overview
- 18.2.1.2. Products
- 18.2.1.3. SWOT Analysis
- 18.2.1.4. Recent Developments
- 18.2.1.5. Financials (Based on Availability)
- 18.2.2 Sonavation Inc
- 18.2.2.1. Overview
- 18.2.2.2. Products
- 18.2.2.3. SWOT Analysis
- 18.2.2.4. Recent Developments
- 18.2.2.5. Financials (Based on Availability)
- 18.2.3 Idemia France SAS
- 18.2.3.1. Overview
- 18.2.3.2. Products
- 18.2.3.3. SWOT Analysis
- 18.2.3.4. Recent Developments
- 18.2.3.5. Financials (Based on Availability)
- 18.2.4 Fingerprint Cards AB
- 18.2.4.1. Overview
- 18.2.4.2. Products
- 18.2.4.3. SWOT Analysis
- 18.2.4.4. Recent Developments
- 18.2.4.5. Financials (Based on Availability)
- 18.2.5 Synaptics Inc
- 18.2.5.1. Overview
- 18.2.5.2. Products
- 18.2.5.3. SWOT Analysis
- 18.2.5.4. Recent Developments
- 18.2.5.5. Financials (Based on Availability)
- 18.2.6 Qualcomm Technologies Inc
- 18.2.6.1. Overview
- 18.2.6.2. Products
- 18.2.6.3. SWOT Analysis
- 18.2.6.4. Recent Developments
- 18.2.6.5. Financials (Based on Availability)
- 18.2.7 NEC Corporation
- 18.2.7.1. Overview
- 18.2.7.2. Products
- 18.2.7.3. SWOT Analysis
- 18.2.7.4. Recent Developments
- 18.2.7.5. Financials (Based on Availability)
- 18.2.8 Thales Group (Gemalto NV)
- 18.2.8.1. Overview
- 18.2.8.2. Products
- 18.2.8.3. SWOT Analysis
- 18.2.8.4. Recent Developments
- 18.2.8.5. Financials (Based on Availability)
- 18.2.9 TDK Corporation
- 18.2.9.1. Overview
- 18.2.9.2. Products
- 18.2.9.3. SWOT Analysis
- 18.2.9.4. Recent Developments
- 18.2.9.5. Financials (Based on Availability)
- 18.2.10 Shenzhen Goodix Technology Co Ltd
- 18.2.10.1. Overview
- 18.2.10.2. Products
- 18.2.10.3. SWOT Analysis
- 18.2.10.4. Recent Developments
- 18.2.10.5. Financials (Based on Availability)
- 18.2.11 Idex Biometrics ASA
- 18.2.11.1. Overview
- 18.2.11.2. Products
- 18.2.11.3. SWOT Analysis
- 18.2.11.4. Recent Developments
- 18.2.11.5. Financials (Based on Availability)
- 18.2.12 Vkansee Technology Inc
- 18.2.12.1. Overview
- 18.2.12.2. Products
- 18.2.12.3. SWOT Analysis
- 18.2.12.4. Recent Developments
- 18.2.12.5. Financials (Based on Availability)
- 18.2.13 Crucialtec Co Ltd
- 18.2.13.1. Overview
- 18.2.13.2. Products
- 18.2.13.3. SWOT Analysis
- 18.2.13.4. Recent Developments
- 18.2.13.5. Financials (Based on Availability)
- 18.2.14 Egis Technology Inc
- 18.2.14.1. Overview
- 18.2.14.2. Products
- 18.2.14.3. SWOT Analysis
- 18.2.14.4. Recent Developments
- 18.2.14.5. Financials (Based on Availability)
- 18.2.1 Next Biometrics Group ASA
List of Figures
- Figure 1: Global Fingerprint Sensors Industry Revenue Breakdown (Million, %) by Region 2024 & 2032
- Figure 2: North America Fingerprint Sensors Industry Revenue (Million), by Country 2024 & 2032
- Figure 3: North America Fingerprint Sensors Industry Revenue Share (%), by Country 2024 & 2032
- Figure 4: Europe Fingerprint Sensors Industry Revenue (Million), by Country 2024 & 2032
- Figure 5: Europe Fingerprint Sensors Industry Revenue Share (%), by Country 2024 & 2032
- Figure 6: Asia Fingerprint Sensors Industry Revenue (Million), by Country 2024 & 2032
- Figure 7: Asia Fingerprint Sensors Industry Revenue Share (%), by Country 2024 & 2032
- Figure 8: Australia and New Zealand Fingerprint Sensors Industry Revenue (Million), by Country 2024 & 2032
- Figure 9: Australia and New Zealand Fingerprint Sensors Industry Revenue Share (%), by Country 2024 & 2032
- Figure 10: Latin America Fingerprint Sensors Industry Revenue (Million), by Country 2024 & 2032
- Figure 11: Latin America Fingerprint Sensors Industry Revenue Share (%), by Country 2024 & 2032
- Figure 12: Middle East and Africa Fingerprint Sensors Industry Revenue (Million), by Country 2024 & 2032
- Figure 13: Middle East and Africa Fingerprint Sensors Industry Revenue Share (%), by Country 2024 & 2032
- Figure 14: North America Fingerprint Sensors Industry Revenue (Million), by Type 2024 & 2032
- Figure 15: North America Fingerprint Sensors Industry Revenue Share (%), by Type 2024 & 2032
- Figure 16: North America Fingerprint Sensors Industry Revenue (Million), by Application 2024 & 2032
- Figure 17: North America Fingerprint Sensors Industry Revenue Share (%), by Application 2024 & 2032
- Figure 18: North America Fingerprint Sensors Industry Revenue (Million), by End-user Industries 2024 & 2032
- Figure 19: North America Fingerprint Sensors Industry Revenue Share (%), by End-user Industries 2024 & 2032
- Figure 20: North America Fingerprint Sensors Industry Revenue (Million), by Country 2024 & 2032
- Figure 21: North America Fingerprint Sensors Industry Revenue Share (%), by Country 2024 & 2032
- Figure 22: Europe Fingerprint Sensors Industry Revenue (Million), by Type 2024 & 2032
- Figure 23: Europe Fingerprint Sensors Industry Revenue Share (%), by Type 2024 & 2032
- Figure 24: Europe Fingerprint Sensors Industry Revenue (Million), by Application 2024 & 2032
- Figure 25: Europe Fingerprint Sensors Industry Revenue Share (%), by Application 2024 & 2032
- Figure 26: Europe Fingerprint Sensors Industry Revenue (Million), by End-user Industries 2024 & 2032
- Figure 27: Europe Fingerprint Sensors Industry Revenue Share (%), by End-user Industries 2024 & 2032
- Figure 28: Europe Fingerprint Sensors Industry Revenue (Million), by Country 2024 & 2032
- Figure 29: Europe Fingerprint Sensors Industry Revenue Share (%), by Country 2024 & 2032
- Figure 30: Asia Fingerprint Sensors Industry Revenue (Million), by Type 2024 & 2032
- Figure 31: Asia Fingerprint Sensors Industry Revenue Share (%), by Type 2024 & 2032
- Figure 32: Asia Fingerprint Sensors Industry Revenue (Million), by Application 2024 & 2032
- Figure 33: Asia Fingerprint Sensors Industry Revenue Share (%), by Application 2024 & 2032
- Figure 34: Asia Fingerprint Sensors Industry Revenue (Million), by End-user Industries 2024 & 2032
- Figure 35: Asia Fingerprint Sensors Industry Revenue Share (%), by End-user Industries 2024 & 2032
- Figure 36: Asia Fingerprint Sensors Industry Revenue (Million), by Country 2024 & 2032
- Figure 37: Asia Fingerprint Sensors Industry Revenue Share (%), by Country 2024 & 2032
- Figure 38: Australia and New Zealand Fingerprint Sensors Industry Revenue (Million), by Type 2024 & 2032
- Figure 39: Australia and New Zealand Fingerprint Sensors Industry Revenue Share (%), by Type 2024 & 2032
- Figure 40: Australia and New Zealand Fingerprint Sensors Industry Revenue (Million), by Application 2024 & 2032
- Figure 41: Australia and New Zealand Fingerprint Sensors Industry Revenue Share (%), by Application 2024 & 2032
- Figure 42: Australia and New Zealand Fingerprint Sensors Industry Revenue (Million), by End-user Industries 2024 & 2032
- Figure 43: Australia and New Zealand Fingerprint Sensors Industry Revenue Share (%), by End-user Industries 2024 & 2032
- Figure 44: Australia and New Zealand Fingerprint Sensors Industry Revenue (Million), by Country 2024 & 2032
- Figure 45: Australia and New Zealand Fingerprint Sensors Industry Revenue Share (%), by Country 2024 & 2032
- Figure 46: Latin America Fingerprint Sensors Industry Revenue (Million), by Type 2024 & 2032
- Figure 47: Latin America Fingerprint Sensors Industry Revenue Share (%), by Type 2024 & 2032
- Figure 48: Latin America Fingerprint Sensors Industry Revenue (Million), by Application 2024 & 2032
- Figure 49: Latin America Fingerprint Sensors Industry Revenue Share (%), by Application 2024 & 2032
- Figure 50: Latin America Fingerprint Sensors Industry Revenue (Million), by End-user Industries 2024 & 2032
- Figure 51: Latin America Fingerprint Sensors Industry Revenue Share (%), by End-user Industries 2024 & 2032
- Figure 52: Latin America Fingerprint Sensors Industry Revenue (Million), by Country 2024 & 2032
- Figure 53: Latin America Fingerprint Sensors Industry Revenue Share (%), by Country 2024 & 2032
- Figure 54: Middle East and Africa Fingerprint Sensors Industry Revenue (Million), by Type 2024 & 2032
- Figure 55: Middle East and Africa Fingerprint Sensors Industry Revenue Share (%), by Type 2024 & 2032
- Figure 56: Middle East and Africa Fingerprint Sensors Industry Revenue (Million), by Application 2024 & 2032
- Figure 57: Middle East and Africa Fingerprint Sensors Industry Revenue Share (%), by Application 2024 & 2032
- Figure 58: Middle East and Africa Fingerprint Sensors Industry Revenue (Million), by End-user Industries 2024 & 2032
- Figure 59: Middle East and Africa Fingerprint Sensors Industry Revenue Share (%), by End-user Industries 2024 & 2032
- Figure 60: Middle East and Africa Fingerprint Sensors Industry Revenue (Million), by Country 2024 & 2032
- Figure 61: Middle East and Africa Fingerprint Sensors Industry Revenue Share (%), by Country 2024 & 2032
List of Tables
- Table 1: Global Fingerprint Sensors Industry Revenue Million Forecast, by Region 2019 & 2032
- Table 2: Global Fingerprint Sensors Industry Revenue Million Forecast, by Type 2019 & 2032
- Table 3: Global Fingerprint Sensors Industry Revenue Million Forecast, by Application 2019 & 2032
- Table 4: Global Fingerprint Sensors Industry Revenue Million Forecast, by End-user Industries 2019 & 2032
- Table 5: Global Fingerprint Sensors Industry Revenue Million Forecast, by Region 2019 & 2032
- Table 6: Global Fingerprint Sensors Industry Revenue Million Forecast, by Country 2019 & 2032
- Table 7: United States Fingerprint Sensors Industry Revenue (Million) Forecast, by Application 2019 & 2032
- Table 8: Canada Fingerprint Sensors Industry Revenue (Million) Forecast, by Application 2019 & 2032
- Table 9: Global Fingerprint Sensors Industry Revenue Million Forecast, by Country 2019 & 2032
- Table 10: Germany Fingerprint Sensors Industry Revenue (Million) Forecast, by Application 2019 & 2032
- Table 11: United Kingdom Fingerprint Sensors Industry Revenue (Million) Forecast, by Application 2019 & 2032
- Table 12: France Fingerprint Sensors Industry Revenue (Million) Forecast, by Application 2019 & 2032
- Table 13: Global Fingerprint Sensors Industry Revenue Million Forecast, by Country 2019 & 2032
- Table 14: China Fingerprint Sensors Industry Revenue (Million) Forecast, by Application 2019 & 2032
- Table 15: Japan Fingerprint Sensors Industry Revenue (Million) Forecast, by Application 2019 & 2032
- Table 16: India Fingerprint Sensors Industry Revenue (Million) Forecast, by Application 2019 & 2032
- Table 17: South Korea Fingerprint Sensors Industry Revenue (Million) Forecast, by Application 2019 & 2032
- Table 18: Global Fingerprint Sensors Industry Revenue Million Forecast, by Country 2019 & 2032
- Table 19: Fingerprint Sensors Industry Revenue (Million) Forecast, by Application 2019 & 2032
- Table 20: Global Fingerprint Sensors Industry Revenue Million Forecast, by Country 2019 & 2032
- Table 21: Fingerprint Sensors Industry Revenue (Million) Forecast, by Application 2019 & 2032
- Table 22: Global Fingerprint Sensors Industry Revenue Million Forecast, by Country 2019 & 2032
- Table 23: Fingerprint Sensors Industry Revenue (Million) Forecast, by Application 2019 & 2032
- Table 24: Global Fingerprint Sensors Industry Revenue Million Forecast, by Type 2019 & 2032
- Table 25: Global Fingerprint Sensors Industry Revenue Million Forecast, by Application 2019 & 2032
- Table 26: Global Fingerprint Sensors Industry Revenue Million Forecast, by End-user Industries 2019 & 2032
- Table 27: Global Fingerprint Sensors Industry Revenue Million Forecast, by Country 2019 & 2032
- Table 28: United States Fingerprint Sensors Industry Revenue (Million) Forecast, by Application 2019 & 2032
- Table 29: Canada Fingerprint Sensors Industry Revenue (Million) Forecast, by Application 2019 & 2032
- Table 30: Global Fingerprint Sensors Industry Revenue Million Forecast, by Type 2019 & 2032
- Table 31: Global Fingerprint Sensors Industry Revenue Million Forecast, by Application 2019 & 2032
- Table 32: Global Fingerprint Sensors Industry Revenue Million Forecast, by End-user Industries 2019 & 2032
- Table 33: Global Fingerprint Sensors Industry Revenue Million Forecast, by Country 2019 & 2032
- Table 34: Germany Fingerprint Sensors Industry Revenue (Million) Forecast, by Application 2019 & 2032
- Table 35: United Kingdom Fingerprint Sensors Industry Revenue (Million) Forecast, by Application 2019 & 2032
- Table 36: France Fingerprint Sensors Industry Revenue (Million) Forecast, by Application 2019 & 2032
- Table 37: Global Fingerprint Sensors Industry Revenue Million Forecast, by Type 2019 & 2032
- Table 38: Global Fingerprint Sensors Industry Revenue Million Forecast, by Application 2019 & 2032
- Table 39: Global Fingerprint Sensors Industry Revenue Million Forecast, by End-user Industries 2019 & 2032
- Table 40: Global Fingerprint Sensors Industry Revenue Million Forecast, by Country 2019 & 2032
- Table 41: China Fingerprint Sensors Industry Revenue (Million) Forecast, by Application 2019 & 2032
- Table 42: Japan Fingerprint Sensors Industry Revenue (Million) Forecast, by Application 2019 & 2032
- Table 43: India Fingerprint Sensors Industry Revenue (Million) Forecast, by Application 2019 & 2032
- Table 44: South Korea Fingerprint Sensors Industry Revenue (Million) Forecast, by Application 2019 & 2032
- Table 45: Global Fingerprint Sensors Industry Revenue Million Forecast, by Type 2019 & 2032
- Table 46: Global Fingerprint Sensors Industry Revenue Million Forecast, by Application 2019 & 2032
- Table 47: Global Fingerprint Sensors Industry Revenue Million Forecast, by End-user Industries 2019 & 2032
- Table 48: Global Fingerprint Sensors Industry Revenue Million Forecast, by Country 2019 & 2032
- Table 49: Global Fingerprint Sensors Industry Revenue Million Forecast, by Type 2019 & 2032
- Table 50: Global Fingerprint Sensors Industry Revenue Million Forecast, by Application 2019 & 2032
- Table 51: Global Fingerprint Sensors Industry Revenue Million Forecast, by End-user Industries 2019 & 2032
- Table 52: Global Fingerprint Sensors Industry Revenue Million Forecast, by Country 2019 & 2032
- Table 53: Global Fingerprint Sensors Industry Revenue Million Forecast, by Type 2019 & 2032
- Table 54: Global Fingerprint Sensors Industry Revenue Million Forecast, by Application 2019 & 2032
- Table 55: Global Fingerprint Sensors Industry Revenue Million Forecast, by End-user Industries 2019 & 2032
- Table 56: Global Fingerprint Sensors Industry Revenue Million Forecast, by Country 2019 & 2032
Frequently Asked Questions
1. What is the projected Compound Annual Growth Rate (CAGR) of the Fingerprint Sensors Industry?
The projected CAGR is approximately 11.96%.
2. Which companies are prominent players in the Fingerprint Sensors Industry?
Key companies in the market include Next Biometrics Group ASA, Sonavation Inc, Idemia France SAS, Fingerprint Cards AB, Synaptics Inc, Qualcomm Technologies Inc, NEC Corporation, Thales Group (Gemalto NV), TDK Corporation, Shenzhen Goodix Technology Co Ltd, Idex Biometrics ASA, Vkansee Technology Inc, Crucialtec Co Ltd, Egis Technology Inc.
3. What are the main segments of the Fingerprint Sensors Industry?
The market segments include Type, Application, End-user Industries.
4. Can you provide details about the market size?
The market size is estimated to be USD 9.54 Million as of 2022.
5. What are some drivers contributing to market growth?
Increasing Usage of Fingerprint Sensors for Smart Wearable Devices and Smartphones; Need for Secured Security and Business Applications; Government Initiatives to Adopt Biometrics in Various Fields.
6. What are the notable trends driving market growth?
Smartphones Under the Application Segment is Expected to Hold a Major Share.
7. Are there any restraints impacting market growth?
Increase in Adoption of Substitute Technologies. such as Face and Iris Scanning.
8. Can you provide examples of recent developments in the market?
September 2023 - Mastercard launched an in-car payment partnership aimed at Mercedes drivers in Germany. The collaboration will allow customers to use a fingerprint sensor in their car to make digital payments at more than 3,600 service stations in Germany.
9. What pricing options are available for accessing the report?
Pricing options include single-user, multi-user, and enterprise licenses priced at USD 4750, USD 5250, and USD 8750 respectively.
10. Is the market size provided in terms of value or volume?
The market size is provided in terms of value, measured in Million.
11. Are there any specific market keywords associated with the report?
Yes, the market keyword associated with the report is "Fingerprint Sensors Industry," which aids in identifying and referencing the specific market segment covered.
12. How do I determine which pricing option suits my needs best?
The pricing options vary based on user requirements and access needs. Individual users may opt for single-user licenses, while businesses requiring broader access may choose multi-user or enterprise licenses for cost-effective access to the report.
13. Are there any additional resources or data provided in the Fingerprint Sensors Industry report?
While the report offers comprehensive insights, it's advisable to review the specific contents or supplementary materials provided to ascertain if additional resources or data are available.
14. How can I stay updated on further developments or reports in the Fingerprint Sensors Industry?
To stay informed about further developments, trends, and reports in the Fingerprint Sensors Industry, consider subscribing to industry newsletters, following relevant companies and organizations, or regularly checking reputable industry news sources and publications.
Methodology
Step 1 - Identification of Relevant Samples Size from Population Database


Step 2 - Approaches for Defining Global Market Size (Value, Volume* & Price*)

Note*: In applicable scenarios
Step 3 - Data Sources
Primary Research
- Web Analytics
- Survey Reports
- Research Institute
- Latest Research Reports
- Opinion Leaders
Secondary Research
- Annual Reports
- White Paper
- Latest Press Release
- Industry Association
- Paid Database
- Investor Presentations

Step 4 - Data Triangulation
Involves using different sources of information in order to increase the validity of a study
These sources are likely to be stakeholders in a program - participants, other researchers, program staff, other community members, and so on.
Then we put all data in single framework & apply various statistical tools to find out the dynamic on the market.
During the analysis stage, feedback from the stakeholder groups would be compared to determine areas of agreement as well as areas of divergence


