
Key Insights
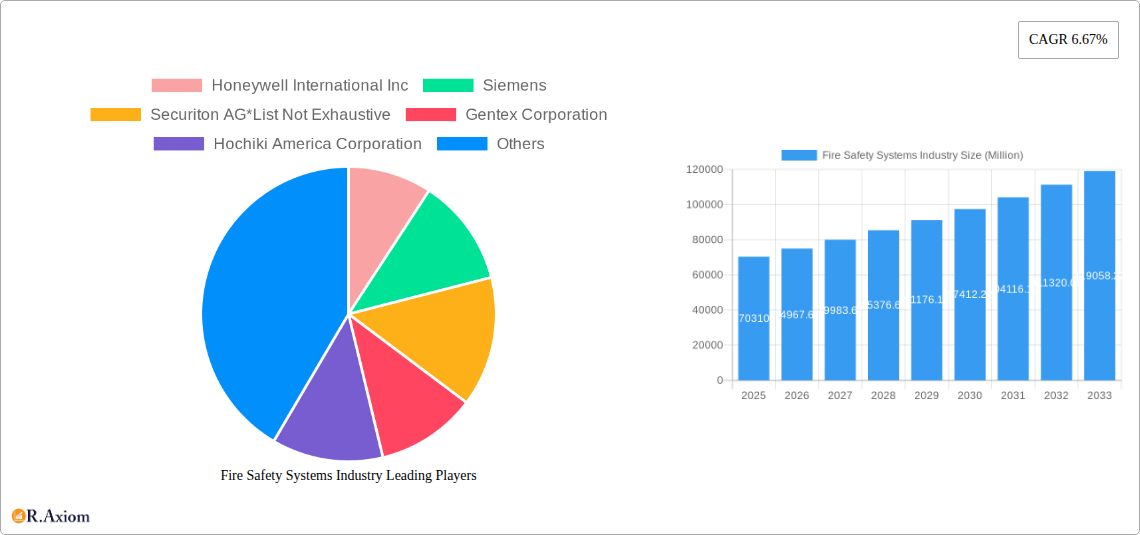
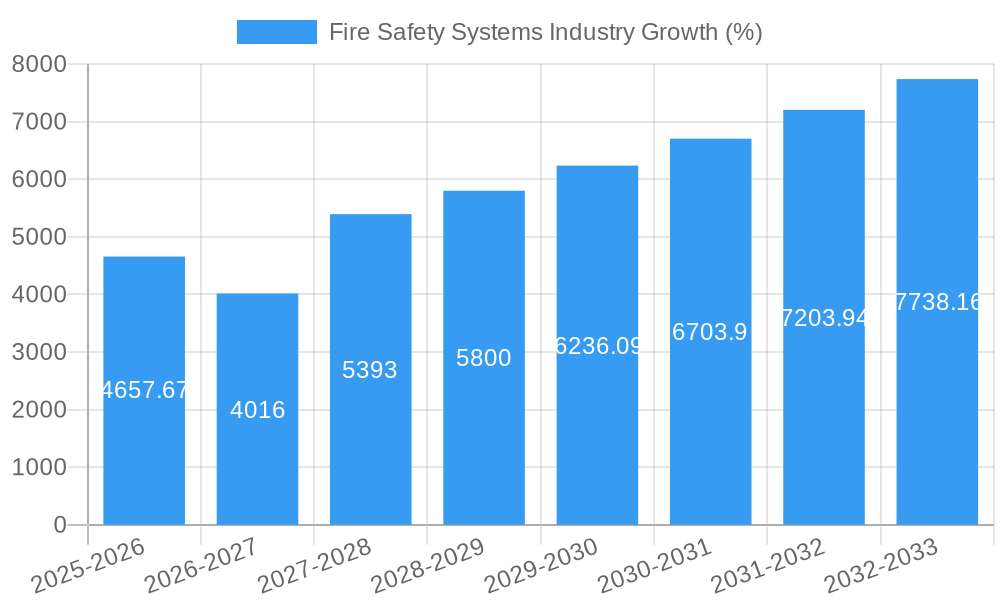
The global fire safety systems market, valued at $70.31 billion in 2025, is projected to experience robust growth, driven by a compound annual growth rate (CAGR) of 6.67% from 2025 to 2033. This expansion is fueled by several key factors. Increasing urbanization and industrialization lead to a higher density of buildings and infrastructure, necessitating comprehensive fire safety measures. Stringent government regulations and building codes worldwide mandate the adoption of advanced fire safety systems, creating significant demand. Furthermore, rising awareness about fire safety and its economic implications, coupled with advancements in technology leading to the development of sophisticated and interconnected systems, are contributing to market growth. The increasing adoption of smart fire safety solutions integrated with IoT (Internet of Things) technologies for proactive monitoring and remote management further fuels this expansion. Specific growth drivers include the demand for intelligent fire detection and suppression systems, particularly in commercial and industrial sectors, and the increasing adoption of cloud-based fire safety management platforms.
The market segmentation reveals significant opportunities across various sectors. The commercial sector, driven by the need for safety in high-traffic areas like shopping malls and office buildings, holds a substantial market share. Industrial sectors, with their potential for hazardous materials and complex operations, represent another key segment. Technological advancements are shaping the market, with active fire safety systems, encompassing sophisticated sprinkler systems and suppression technologies, experiencing strong growth due to their enhanced effectiveness in mitigating fire incidents. Similarly, the fire detector segment is poised for continued expansion, fueled by technological innovations leading to early detection and improved accuracy. Geographic expansion is primarily observed in rapidly developing economies in Asia Pacific, specifically China and India, where significant infrastructural development and industrialization are creating a surge in demand. However, challenges exist, including the high initial investment cost of advanced systems, particularly for smaller businesses or in developing regions, and potential limitations in adoption rates due to technological complexities.
Fire Safety Systems Industry Market Report: 2019-2033
This comprehensive report provides a detailed analysis of the global Fire Safety Systems market, covering the period 2019-2033. Valued at $XX Million in 2024, the market is projected to reach $XX Million by 2033, exhibiting a CAGR of XX% during the forecast period (2025-2033). The report offers actionable insights for industry stakeholders, including manufacturers, investors, and regulatory bodies. Key players analyzed include Honeywell International Inc, Siemens, Securiton AG, Gentex Corporation, Hochiki America Corporation, Johnson Controls, Victaulic Company, Halma Plc, Viking Group Inc, Bosch Security Systems GmbH, and Fike Corporation.
Fire Safety Systems Industry Market Concentration & Innovation
The Fire Safety Systems market exhibits a moderately concentrated structure, with a few major players holding significant market share. However, the presence of numerous smaller, specialized companies fosters innovation and competition. Market share data for 2024 suggests that Honeywell International Inc. and Siemens collectively hold approximately xx% of the market, while other key players such as Johnson Controls and Bosch Security Systems GmbH each possess around xx% respectively. The remaining share is distributed amongst smaller players and niche providers.
Several factors drive innovation within this sector:
- Stringent Safety Regulations: Governments worldwide are imposing stricter fire safety codes, pushing companies to develop advanced and compliant systems.
- Technological Advancements: The integration of IoT, AI, and cloud computing is leading to the development of intelligent fire safety systems with enhanced detection and response capabilities.
- Demand for Integrated Solutions: The market is shifting towards integrated solutions combining multiple fire safety technologies for comprehensive protection.
Mergers and acquisitions (M&A) play a crucial role in market consolidation and expansion. In recent years, M&A activity has totalled approximately $XX Million, with deals focused on expanding product portfolios, acquiring technological expertise, and accessing new markets. For example, the acquisition of [Company A] by [Company B] in [Year] significantly altered the competitive landscape.
Fire Safety Systems Industry Industry Trends & Insights
The Fire Safety Systems market is experiencing robust growth, driven by several key factors. Increasing urbanization and industrialization lead to a higher demand for advanced fire safety solutions. The construction of large-scale infrastructure projects, such as high-rise buildings and industrial complexes, further fuels market expansion. The rising awareness of fire safety risks, coupled with stringent regulatory requirements, also contributes to market growth. Furthermore, technological advancements are transforming the industry with the incorporation of intelligent features and cloud connectivity.
Consumer preferences are leaning towards integrated systems and user-friendly interfaces, demanding ease of use and integration with existing building management systems. Competitive dynamics are intensifying with major players focusing on innovation, strategic partnerships, and acquisitions to maintain their market positions. The market's overall growth is expected to be influenced by factors such as economic growth, government spending, and technological advancements. For example, the adoption of IoT-enabled fire detection systems is growing at a CAGR of approximately XX%, demonstrating significant market penetration.
Dominant Markets & Segments in Fire Safety Systems Industry
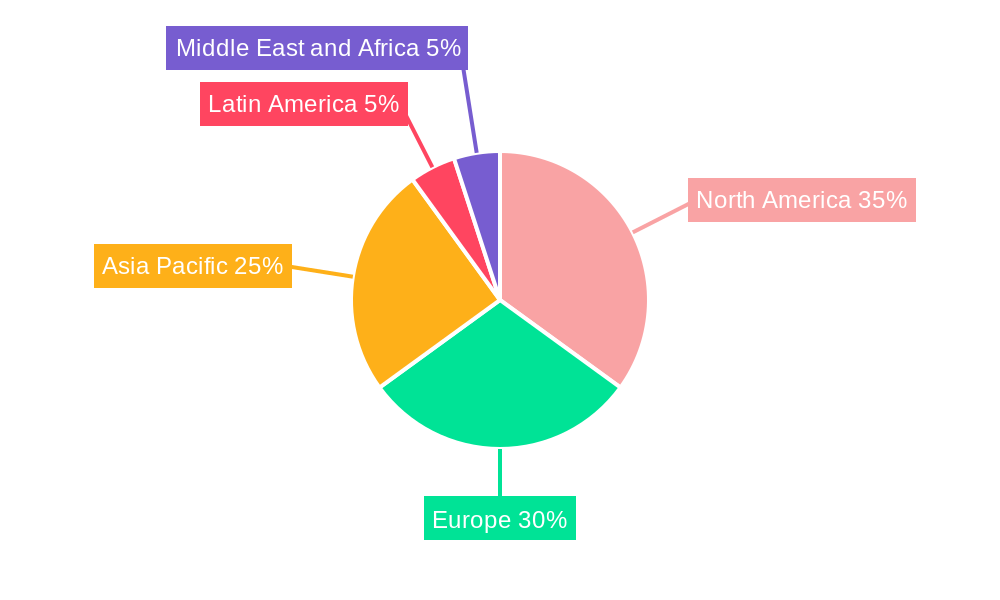
The global Fire Safety Systems market is geographically diverse, with North America and Europe currently dominating. However, the Asia-Pacific region is witnessing rapid growth due to its high construction activity and increasing infrastructural development.
By End-User:
- Commercial: This segment dominates due to the high concentration of buildings with complex fire safety requirements. Key drivers include increasing construction of commercial spaces and stringent fire safety regulations.
- Industrial: This segment exhibits strong growth driven by the rising demand for safety in manufacturing facilities and industrial complexes. Stringent safety standards and potential liability concerns are major factors.
- Government: Government expenditure on public safety and infrastructure projects significantly impacts the growth in this segment.
By Technology:
- Active Fire Safety Systems: This segment holds a larger market share due to the increasing preference for automated fire suppression systems for enhanced safety and efficiency.
- Passive Fire Safety Systems: While slower growing, this segment remains essential for providing structural fire protection in buildings.
By Product:
- Fire Detectors: High demand is driven by stringent safety regulations and the need for reliable early warning systems.
- Fire Suppression Systems: Growth is primarily influenced by factors like enhanced safety measures in commercial buildings and industrial complexes.
Fire Safety Systems Industry Product Developments
Recent advancements focus on integrating IoT, AI, and cloud computing into fire safety systems. This results in intelligent systems capable of real-time monitoring, predictive maintenance, and enhanced response capabilities. New products offer improved accuracy, ease of installation, and user-friendly interfaces. The market is witnessing a shift towards open-protocol systems to improve interoperability and system integration.
Report Scope & Segmentation Analysis
This report provides a comprehensive segmentation analysis of the Fire Safety Systems market based on end-user (Commercial, Industrial, Government, Other), technology (Passive, Active), and product type (Fire Detectors, Fire Alarms, Fire Suppression Systems). Each segment's growth projection, market size, and competitive dynamics are extensively analyzed, providing detailed insights into market potential and opportunities. Growth projections vary across segments, influenced by factors such as technological advancements, regulatory changes, and economic conditions.
Key Drivers of Fire Safety Systems Industry Growth
The Fire Safety Systems market's growth is propelled by several key factors. Stringent government regulations and building codes mandating the adoption of fire safety systems are major drivers. Technological advancements, such as IoT and AI integration, lead to more efficient and intelligent systems. Increasing urbanization and industrialization also result in a higher demand for fire safety solutions. Finally, rising awareness of fire safety risks amongst both individuals and organizations contributes to overall market growth.
Challenges in the Fire Safety Systems Industry Sector
The Fire Safety Systems market faces several challenges. High initial investment costs for advanced systems can deter adoption, especially in developing economies. Supply chain disruptions and fluctuations in raw material prices impact manufacturing costs and profitability. Intense competition among established and emerging players creates pricing pressures. Regulatory complexities and compliance requirements can also pose hurdles for manufacturers.
Emerging Opportunities in Fire Safety Systems Industry
The integration of smart technologies like AI and IoT creates opportunities for advanced fire detection and response systems. The rising demand for sustainable and eco-friendly fire suppression agents presents new opportunities for manufacturers. Emerging markets in developing countries offer significant untapped potential for growth. The increasing focus on proactive safety measures is also leading to demand for integrated security and fire safety solutions.
Leading Players in the Fire Safety Systems Industry Market
- Honeywell International Inc
- Siemens
- Securiton AG
- Gentex Corporation
- Hochiki America Corporation
- Johnson Controls
- Victaulic Company
- Halma Plc
- Viking Group Inc
- Bosch Security Systems GmbH
- Fike Corporation
Key Developments in Fire Safety Systems Industry Industry
- September 2022: Johnson Controls launched its FireClass range of open-protocol fire detection products, expanding its product portfolio and addressing a wider range of market needs.
- September 2022: Siemens introduced its Fire Safety Digital Services portfolio, offering cloud-connected fire safety systems for enhanced monitoring and proactive protection.
Strategic Outlook for Fire Safety Systems Industry Market
The Fire Safety Systems market presents significant growth potential driven by technological innovation, stringent regulations, and increasing awareness of fire safety risks. The integration of IoT, AI, and cloud computing will lead to more intelligent and efficient fire safety solutions. Expanding into emerging markets and focusing on sustainable solutions will be key strategies for success. The market is poised for continued growth, presenting lucrative opportunities for companies that can adapt to evolving market demands.
Fire Safety Systems Industry Segmentation
-
1. Technology
- 1.1. Passive Fire Safety Systems
- 1.2. Active Fire Safety Systems
-
2. Product
-
2.1. Fire Detector
- 2.1.1. Detectors
- 2.1.2. Alarms
-
2.2. Fire Suppression
- 2.2.1. Gas
- 2.2.2. Foam
- 2.2.3. Other Fire Suppression Products
-
2.1. Fire Detector
-
3. End-User
- 3.1. Commercial
- 3.2. Industrial
- 3.3. Government
- 3.4. Other End-Users
Fire Safety Systems Industry Segmentation By Geography
-
1. North America
- 1.1. United States
- 1.2. Canada
-
2. Europe
- 2.1. United Kingdom
- 2.2. Germany
- 2.3. France
- 2.4. Rest of Europe
-
3. Asia Pacific
- 3.1. China
- 3.2. Japan
- 3.3. India
- 3.4. Rest of Asia Pacific
- 4. Latin America
- 5. Middle East and Africa
Fire Safety Systems Industry REPORT HIGHLIGHTS
| Aspects | Details |
|---|---|
| Study Period | 2019-2033 |
| Base Year | 2024 |
| Estimated Year | 2025 |
| Forecast Period | 2025-2033 |
| Historical Period | 2019-2024 |
| Growth Rate | CAGR of 6.67% from 2019-2033 |
| Segmentation |
|
Table of Contents
- 1. Introduction
- 1.1. Research Scope
- 1.2. Market Segmentation
- 1.3. Research Methodology
- 1.4. Definitions and Assumptions
- 2. Executive Summary
- 2.1. Introduction
- 3. Market Dynamics
- 3.1. Introduction
- 3.2. Market Drivers
- 3.2.1. Stringent Government Regulations and Mandates
- 3.3. Market Restrains
- 3.3.1. Complexity of Installation and Maintenance; Rising Security Concerns; Compatability Issues with Existing Infrastructure and Systems
- 3.4. Market Trends
- 3.4.1. Commercial Segment To Hold Significant Market Share
- 4. Market Factor Analysis
- 4.1. Porters Five Forces
- 4.2. Supply/Value Chain
- 4.3. PESTEL analysis
- 4.4. Market Entropy
- 4.5. Patent/Trademark Analysis
- 5. Global Fire Safety Systems Industry Analysis, Insights and Forecast, 2019-2031
- 5.1. Market Analysis, Insights and Forecast - by Technology
- 5.1.1. Passive Fire Safety Systems
- 5.1.2. Active Fire Safety Systems
- 5.2. Market Analysis, Insights and Forecast - by Product
- 5.2.1. Fire Detector
- 5.2.1.1. Detectors
- 5.2.1.2. Alarms
- 5.2.2. Fire Suppression
- 5.2.2.1. Gas
- 5.2.2.2. Foam
- 5.2.2.3. Other Fire Suppression Products
- 5.2.1. Fire Detector
- 5.3. Market Analysis, Insights and Forecast - by End-User
- 5.3.1. Commercial
- 5.3.2. Industrial
- 5.3.3. Government
- 5.3.4. Other End-Users
- 5.4. Market Analysis, Insights and Forecast - by Region
- 5.4.1. North America
- 5.4.2. Europe
- 5.4.3. Asia Pacific
- 5.4.4. Latin America
- 5.4.5. Middle East and Africa
- 5.1. Market Analysis, Insights and Forecast - by Technology
- 6. North America Fire Safety Systems Industry Analysis, Insights and Forecast, 2019-2031
- 6.1. Market Analysis, Insights and Forecast - by Technology
- 6.1.1. Passive Fire Safety Systems
- 6.1.2. Active Fire Safety Systems
- 6.2. Market Analysis, Insights and Forecast - by Product
- 6.2.1. Fire Detector
- 6.2.1.1. Detectors
- 6.2.1.2. Alarms
- 6.2.2. Fire Suppression
- 6.2.2.1. Gas
- 6.2.2.2. Foam
- 6.2.2.3. Other Fire Suppression Products
- 6.2.1. Fire Detector
- 6.3. Market Analysis, Insights and Forecast - by End-User
- 6.3.1. Commercial
- 6.3.2. Industrial
- 6.3.3. Government
- 6.3.4. Other End-Users
- 6.1. Market Analysis, Insights and Forecast - by Technology
- 7. Europe Fire Safety Systems Industry Analysis, Insights and Forecast, 2019-2031
- 7.1. Market Analysis, Insights and Forecast - by Technology
- 7.1.1. Passive Fire Safety Systems
- 7.1.2. Active Fire Safety Systems
- 7.2. Market Analysis, Insights and Forecast - by Product
- 7.2.1. Fire Detector
- 7.2.1.1. Detectors
- 7.2.1.2. Alarms
- 7.2.2. Fire Suppression
- 7.2.2.1. Gas
- 7.2.2.2. Foam
- 7.2.2.3. Other Fire Suppression Products
- 7.2.1. Fire Detector
- 7.3. Market Analysis, Insights and Forecast - by End-User
- 7.3.1. Commercial
- 7.3.2. Industrial
- 7.3.3. Government
- 7.3.4. Other End-Users
- 7.1. Market Analysis, Insights and Forecast - by Technology
- 8. Asia Pacific Fire Safety Systems Industry Analysis, Insights and Forecast, 2019-2031
- 8.1. Market Analysis, Insights and Forecast - by Technology
- 8.1.1. Passive Fire Safety Systems
- 8.1.2. Active Fire Safety Systems
- 8.2. Market Analysis, Insights and Forecast - by Product
- 8.2.1. Fire Detector
- 8.2.1.1. Detectors
- 8.2.1.2. Alarms
- 8.2.2. Fire Suppression
- 8.2.2.1. Gas
- 8.2.2.2. Foam
- 8.2.2.3. Other Fire Suppression Products
- 8.2.1. Fire Detector
- 8.3. Market Analysis, Insights and Forecast - by End-User
- 8.3.1. Commercial
- 8.3.2. Industrial
- 8.3.3. Government
- 8.3.4. Other End-Users
- 8.1. Market Analysis, Insights and Forecast - by Technology
- 9. Latin America Fire Safety Systems Industry Analysis, Insights and Forecast, 2019-2031
- 9.1. Market Analysis, Insights and Forecast - by Technology
- 9.1.1. Passive Fire Safety Systems
- 9.1.2. Active Fire Safety Systems
- 9.2. Market Analysis, Insights and Forecast - by Product
- 9.2.1. Fire Detector
- 9.2.1.1. Detectors
- 9.2.1.2. Alarms
- 9.2.2. Fire Suppression
- 9.2.2.1. Gas
- 9.2.2.2. Foam
- 9.2.2.3. Other Fire Suppression Products
- 9.2.1. Fire Detector
- 9.3. Market Analysis, Insights and Forecast - by End-User
- 9.3.1. Commercial
- 9.3.2. Industrial
- 9.3.3. Government
- 9.3.4. Other End-Users
- 9.1. Market Analysis, Insights and Forecast - by Technology
- 10. Middle East and Africa Fire Safety Systems Industry Analysis, Insights and Forecast, 2019-2031
- 10.1. Market Analysis, Insights and Forecast - by Technology
- 10.1.1. Passive Fire Safety Systems
- 10.1.2. Active Fire Safety Systems
- 10.2. Market Analysis, Insights and Forecast - by Product
- 10.2.1. Fire Detector
- 10.2.1.1. Detectors
- 10.2.1.2. Alarms
- 10.2.2. Fire Suppression
- 10.2.2.1. Gas
- 10.2.2.2. Foam
- 10.2.2.3. Other Fire Suppression Products
- 10.2.1. Fire Detector
- 10.3. Market Analysis, Insights and Forecast - by End-User
- 10.3.1. Commercial
- 10.3.2. Industrial
- 10.3.3. Government
- 10.3.4. Other End-Users
- 10.1. Market Analysis, Insights and Forecast - by Technology
- 11. North America Fire Safety Systems Industry Analysis, Insights and Forecast, 2019-2031
- 11.1. Market Analysis, Insights and Forecast - By Country/Sub-region
- 11.1.1 United States
- 11.1.2 Canada
- 12. Europe Fire Safety Systems Industry Analysis, Insights and Forecast, 2019-2031
- 12.1. Market Analysis, Insights and Forecast - By Country/Sub-region
- 12.1.1 United Kingdom
- 12.1.2 Germany
- 12.1.3 France
- 12.1.4 Rest of Europe
- 13. Asia Pacific Fire Safety Systems Industry Analysis, Insights and Forecast, 2019-2031
- 13.1. Market Analysis, Insights and Forecast - By Country/Sub-region
- 13.1.1 China
- 13.1.2 Japan
- 13.1.3 India
- 13.1.4 Rest of Asia Pacific
- 14. Latin America Fire Safety Systems Industry Analysis, Insights and Forecast, 2019-2031
- 14.1. Market Analysis, Insights and Forecast - By Country/Sub-region
- 14.1.1.
- 15. Middle East and Africa Fire Safety Systems Industry Analysis, Insights and Forecast, 2019-2031
- 15.1. Market Analysis, Insights and Forecast - By Country/Sub-region
- 15.1.1.
- 16. Competitive Analysis
- 16.1. Global Market Share Analysis 2024
- 16.2. Company Profiles
- 16.2.1 Honeywell International Inc
- 16.2.1.1. Overview
- 16.2.1.2. Products
- 16.2.1.3. SWOT Analysis
- 16.2.1.4. Recent Developments
- 16.2.1.5. Financials (Based on Availability)
- 16.2.2 Siemens
- 16.2.2.1. Overview
- 16.2.2.2. Products
- 16.2.2.3. SWOT Analysis
- 16.2.2.4. Recent Developments
- 16.2.2.5. Financials (Based on Availability)
- 16.2.3 Securiton AG*List Not Exhaustive
- 16.2.3.1. Overview
- 16.2.3.2. Products
- 16.2.3.3. SWOT Analysis
- 16.2.3.4. Recent Developments
- 16.2.3.5. Financials (Based on Availability)
- 16.2.4 Gentex Corporation
- 16.2.4.1. Overview
- 16.2.4.2. Products
- 16.2.4.3. SWOT Analysis
- 16.2.4.4. Recent Developments
- 16.2.4.5. Financials (Based on Availability)
- 16.2.5 Hochiki America Corporation
- 16.2.5.1. Overview
- 16.2.5.2. Products
- 16.2.5.3. SWOT Analysis
- 16.2.5.4. Recent Developments
- 16.2.5.5. Financials (Based on Availability)
- 16.2.6 Johnson Controls
- 16.2.6.1. Overview
- 16.2.6.2. Products
- 16.2.6.3. SWOT Analysis
- 16.2.6.4. Recent Developments
- 16.2.6.5. Financials (Based on Availability)
- 16.2.7 Victaulic Company
- 16.2.7.1. Overview
- 16.2.7.2. Products
- 16.2.7.3. SWOT Analysis
- 16.2.7.4. Recent Developments
- 16.2.7.5. Financials (Based on Availability)
- 16.2.8 Halma Plc
- 16.2.8.1. Overview
- 16.2.8.2. Products
- 16.2.8.3. SWOT Analysis
- 16.2.8.4. Recent Developments
- 16.2.8.5. Financials (Based on Availability)
- 16.2.9 Viking Group Inc
- 16.2.9.1. Overview
- 16.2.9.2. Products
- 16.2.9.3. SWOT Analysis
- 16.2.9.4. Recent Developments
- 16.2.9.5. Financials (Based on Availability)
- 16.2.10 Bosch Security Systems GmbH
- 16.2.10.1. Overview
- 16.2.10.2. Products
- 16.2.10.3. SWOT Analysis
- 16.2.10.4. Recent Developments
- 16.2.10.5. Financials (Based on Availability)
- 16.2.11 Fike Corporation
- 16.2.11.1. Overview
- 16.2.11.2. Products
- 16.2.11.3. SWOT Analysis
- 16.2.11.4. Recent Developments
- 16.2.11.5. Financials (Based on Availability)
- 16.2.1 Honeywell International Inc
List of Figures
- Figure 1: Global Fire Safety Systems Industry Revenue Breakdown (Million, %) by Region 2024 & 2032
- Figure 2: North America Fire Safety Systems Industry Revenue (Million), by Country 2024 & 2032
- Figure 3: North America Fire Safety Systems Industry Revenue Share (%), by Country 2024 & 2032
- Figure 4: Europe Fire Safety Systems Industry Revenue (Million), by Country 2024 & 2032
- Figure 5: Europe Fire Safety Systems Industry Revenue Share (%), by Country 2024 & 2032
- Figure 6: Asia Pacific Fire Safety Systems Industry Revenue (Million), by Country 2024 & 2032
- Figure 7: Asia Pacific Fire Safety Systems Industry Revenue Share (%), by Country 2024 & 2032
- Figure 8: Latin America Fire Safety Systems Industry Revenue (Million), by Country 2024 & 2032
- Figure 9: Latin America Fire Safety Systems Industry Revenue Share (%), by Country 2024 & 2032
- Figure 10: Middle East and Africa Fire Safety Systems Industry Revenue (Million), by Country 2024 & 2032
- Figure 11: Middle East and Africa Fire Safety Systems Industry Revenue Share (%), by Country 2024 & 2032
- Figure 12: North America Fire Safety Systems Industry Revenue (Million), by Technology 2024 & 2032
- Figure 13: North America Fire Safety Systems Industry Revenue Share (%), by Technology 2024 & 2032
- Figure 14: North America Fire Safety Systems Industry Revenue (Million), by Product 2024 & 2032
- Figure 15: North America Fire Safety Systems Industry Revenue Share (%), by Product 2024 & 2032
- Figure 16: North America Fire Safety Systems Industry Revenue (Million), by End-User 2024 & 2032
- Figure 17: North America Fire Safety Systems Industry Revenue Share (%), by End-User 2024 & 2032
- Figure 18: North America Fire Safety Systems Industry Revenue (Million), by Country 2024 & 2032
- Figure 19: North America Fire Safety Systems Industry Revenue Share (%), by Country 2024 & 2032
- Figure 20: Europe Fire Safety Systems Industry Revenue (Million), by Technology 2024 & 2032
- Figure 21: Europe Fire Safety Systems Industry Revenue Share (%), by Technology 2024 & 2032
- Figure 22: Europe Fire Safety Systems Industry Revenue (Million), by Product 2024 & 2032
- Figure 23: Europe Fire Safety Systems Industry Revenue Share (%), by Product 2024 & 2032
- Figure 24: Europe Fire Safety Systems Industry Revenue (Million), by End-User 2024 & 2032
- Figure 25: Europe Fire Safety Systems Industry Revenue Share (%), by End-User 2024 & 2032
- Figure 26: Europe Fire Safety Systems Industry Revenue (Million), by Country 2024 & 2032
- Figure 27: Europe Fire Safety Systems Industry Revenue Share (%), by Country 2024 & 2032
- Figure 28: Asia Pacific Fire Safety Systems Industry Revenue (Million), by Technology 2024 & 2032
- Figure 29: Asia Pacific Fire Safety Systems Industry Revenue Share (%), by Technology 2024 & 2032
- Figure 30: Asia Pacific Fire Safety Systems Industry Revenue (Million), by Product 2024 & 2032
- Figure 31: Asia Pacific Fire Safety Systems Industry Revenue Share (%), by Product 2024 & 2032
- Figure 32: Asia Pacific Fire Safety Systems Industry Revenue (Million), by End-User 2024 & 2032
- Figure 33: Asia Pacific Fire Safety Systems Industry Revenue Share (%), by End-User 2024 & 2032
- Figure 34: Asia Pacific Fire Safety Systems Industry Revenue (Million), by Country 2024 & 2032
- Figure 35: Asia Pacific Fire Safety Systems Industry Revenue Share (%), by Country 2024 & 2032
- Figure 36: Latin America Fire Safety Systems Industry Revenue (Million), by Technology 2024 & 2032
- Figure 37: Latin America Fire Safety Systems Industry Revenue Share (%), by Technology 2024 & 2032
- Figure 38: Latin America Fire Safety Systems Industry Revenue (Million), by Product 2024 & 2032
- Figure 39: Latin America Fire Safety Systems Industry Revenue Share (%), by Product 2024 & 2032
- Figure 40: Latin America Fire Safety Systems Industry Revenue (Million), by End-User 2024 & 2032
- Figure 41: Latin America Fire Safety Systems Industry Revenue Share (%), by End-User 2024 & 2032
- Figure 42: Latin America Fire Safety Systems Industry Revenue (Million), by Country 2024 & 2032
- Figure 43: Latin America Fire Safety Systems Industry Revenue Share (%), by Country 2024 & 2032
- Figure 44: Middle East and Africa Fire Safety Systems Industry Revenue (Million), by Technology 2024 & 2032
- Figure 45: Middle East and Africa Fire Safety Systems Industry Revenue Share (%), by Technology 2024 & 2032
- Figure 46: Middle East and Africa Fire Safety Systems Industry Revenue (Million), by Product 2024 & 2032
- Figure 47: Middle East and Africa Fire Safety Systems Industry Revenue Share (%), by Product 2024 & 2032
- Figure 48: Middle East and Africa Fire Safety Systems Industry Revenue (Million), by End-User 2024 & 2032
- Figure 49: Middle East and Africa Fire Safety Systems Industry Revenue Share (%), by End-User 2024 & 2032
- Figure 50: Middle East and Africa Fire Safety Systems Industry Revenue (Million), by Country 2024 & 2032
- Figure 51: Middle East and Africa Fire Safety Systems Industry Revenue Share (%), by Country 2024 & 2032
List of Tables
- Table 1: Global Fire Safety Systems Industry Revenue Million Forecast, by Region 2019 & 2032
- Table 2: Global Fire Safety Systems Industry Revenue Million Forecast, by Technology 2019 & 2032
- Table 3: Global Fire Safety Systems Industry Revenue Million Forecast, by Product 2019 & 2032
- Table 4: Global Fire Safety Systems Industry Revenue Million Forecast, by End-User 2019 & 2032
- Table 5: Global Fire Safety Systems Industry Revenue Million Forecast, by Region 2019 & 2032
- Table 6: Global Fire Safety Systems Industry Revenue Million Forecast, by Country 2019 & 2032
- Table 7: United States Fire Safety Systems Industry Revenue (Million) Forecast, by Application 2019 & 2032
- Table 8: Canada Fire Safety Systems Industry Revenue (Million) Forecast, by Application 2019 & 2032
- Table 9: Global Fire Safety Systems Industry Revenue Million Forecast, by Country 2019 & 2032
- Table 10: United Kingdom Fire Safety Systems Industry Revenue (Million) Forecast, by Application 2019 & 2032
- Table 11: Germany Fire Safety Systems Industry Revenue (Million) Forecast, by Application 2019 & 2032
- Table 12: France Fire Safety Systems Industry Revenue (Million) Forecast, by Application 2019 & 2032
- Table 13: Rest of Europe Fire Safety Systems Industry Revenue (Million) Forecast, by Application 2019 & 2032
- Table 14: Global Fire Safety Systems Industry Revenue Million Forecast, by Country 2019 & 2032
- Table 15: China Fire Safety Systems Industry Revenue (Million) Forecast, by Application 2019 & 2032
- Table 16: Japan Fire Safety Systems Industry Revenue (Million) Forecast, by Application 2019 & 2032
- Table 17: India Fire Safety Systems Industry Revenue (Million) Forecast, by Application 2019 & 2032
- Table 18: Rest of Asia Pacific Fire Safety Systems Industry Revenue (Million) Forecast, by Application 2019 & 2032
- Table 19: Global Fire Safety Systems Industry Revenue Million Forecast, by Country 2019 & 2032
- Table 20: Fire Safety Systems Industry Revenue (Million) Forecast, by Application 2019 & 2032
- Table 21: Global Fire Safety Systems Industry Revenue Million Forecast, by Country 2019 & 2032
- Table 22: Fire Safety Systems Industry Revenue (Million) Forecast, by Application 2019 & 2032
- Table 23: Global Fire Safety Systems Industry Revenue Million Forecast, by Technology 2019 & 2032
- Table 24: Global Fire Safety Systems Industry Revenue Million Forecast, by Product 2019 & 2032
- Table 25: Global Fire Safety Systems Industry Revenue Million Forecast, by End-User 2019 & 2032
- Table 26: Global Fire Safety Systems Industry Revenue Million Forecast, by Country 2019 & 2032
- Table 27: United States Fire Safety Systems Industry Revenue (Million) Forecast, by Application 2019 & 2032
- Table 28: Canada Fire Safety Systems Industry Revenue (Million) Forecast, by Application 2019 & 2032
- Table 29: Global Fire Safety Systems Industry Revenue Million Forecast, by Technology 2019 & 2032
- Table 30: Global Fire Safety Systems Industry Revenue Million Forecast, by Product 2019 & 2032
- Table 31: Global Fire Safety Systems Industry Revenue Million Forecast, by End-User 2019 & 2032
- Table 32: Global Fire Safety Systems Industry Revenue Million Forecast, by Country 2019 & 2032
- Table 33: United Kingdom Fire Safety Systems Industry Revenue (Million) Forecast, by Application 2019 & 2032
- Table 34: Germany Fire Safety Systems Industry Revenue (Million) Forecast, by Application 2019 & 2032
- Table 35: France Fire Safety Systems Industry Revenue (Million) Forecast, by Application 2019 & 2032
- Table 36: Rest of Europe Fire Safety Systems Industry Revenue (Million) Forecast, by Application 2019 & 2032
- Table 37: Global Fire Safety Systems Industry Revenue Million Forecast, by Technology 2019 & 2032
- Table 38: Global Fire Safety Systems Industry Revenue Million Forecast, by Product 2019 & 2032
- Table 39: Global Fire Safety Systems Industry Revenue Million Forecast, by End-User 2019 & 2032
- Table 40: Global Fire Safety Systems Industry Revenue Million Forecast, by Country 2019 & 2032
- Table 41: China Fire Safety Systems Industry Revenue (Million) Forecast, by Application 2019 & 2032
- Table 42: Japan Fire Safety Systems Industry Revenue (Million) Forecast, by Application 2019 & 2032
- Table 43: India Fire Safety Systems Industry Revenue (Million) Forecast, by Application 2019 & 2032
- Table 44: Rest of Asia Pacific Fire Safety Systems Industry Revenue (Million) Forecast, by Application 2019 & 2032
- Table 45: Global Fire Safety Systems Industry Revenue Million Forecast, by Technology 2019 & 2032
- Table 46: Global Fire Safety Systems Industry Revenue Million Forecast, by Product 2019 & 2032
- Table 47: Global Fire Safety Systems Industry Revenue Million Forecast, by End-User 2019 & 2032
- Table 48: Global Fire Safety Systems Industry Revenue Million Forecast, by Country 2019 & 2032
- Table 49: Global Fire Safety Systems Industry Revenue Million Forecast, by Technology 2019 & 2032
- Table 50: Global Fire Safety Systems Industry Revenue Million Forecast, by Product 2019 & 2032
- Table 51: Global Fire Safety Systems Industry Revenue Million Forecast, by End-User 2019 & 2032
- Table 52: Global Fire Safety Systems Industry Revenue Million Forecast, by Country 2019 & 2032
Frequently Asked Questions
1. What is the projected Compound Annual Growth Rate (CAGR) of the Fire Safety Systems Industry?
The projected CAGR is approximately 6.67%.
2. Which companies are prominent players in the Fire Safety Systems Industry?
Key companies in the market include Honeywell International Inc, Siemens, Securiton AG*List Not Exhaustive, Gentex Corporation, Hochiki America Corporation, Johnson Controls, Victaulic Company, Halma Plc, Viking Group Inc, Bosch Security Systems GmbH, Fike Corporation.
3. What are the main segments of the Fire Safety Systems Industry?
The market segments include Technology, Product, End-User.
4. Can you provide details about the market size?
The market size is estimated to be USD 70.31 Million as of 2022.
5. What are some drivers contributing to market growth?
Stringent Government Regulations and Mandates.
6. What are the notable trends driving market growth?
Commercial Segment To Hold Significant Market Share.
7. Are there any restraints impacting market growth?
Complexity of Installation and Maintenance; Rising Security Concerns; Compatability Issues with Existing Infrastructure and Systems.
8. Can you provide examples of recent developments in the market?
September 2022 - Johnson Controls, the pioneer for healthy, innovative, and sustainable buildings, offered an alternative approach to fire detection through its FireClass range, a class of open-protocol fire detection products. FireClass comprises a comprehensive range of industry-approved products for use in commercial, residential, corporate, retail, leisure, care home, manufacturing, and warehouse environments, to make spaces safer and more secure in the event of a fire.
9. What pricing options are available for accessing the report?
Pricing options include single-user, multi-user, and enterprise licenses priced at USD 4750, USD 5250, and USD 8750 respectively.
10. Is the market size provided in terms of value or volume?
The market size is provided in terms of value, measured in Million.
11. Are there any specific market keywords associated with the report?
Yes, the market keyword associated with the report is "Fire Safety Systems Industry," which aids in identifying and referencing the specific market segment covered.
12. How do I determine which pricing option suits my needs best?
The pricing options vary based on user requirements and access needs. Individual users may opt for single-user licenses, while businesses requiring broader access may choose multi-user or enterprise licenses for cost-effective access to the report.
13. Are there any additional resources or data provided in the Fire Safety Systems Industry report?
While the report offers comprehensive insights, it's advisable to review the specific contents or supplementary materials provided to ascertain if additional resources or data are available.
14. How can I stay updated on further developments or reports in the Fire Safety Systems Industry?
To stay informed about further developments, trends, and reports in the Fire Safety Systems Industry, consider subscribing to industry newsletters, following relevant companies and organizations, or regularly checking reputable industry news sources and publications.
Methodology
Step 1 - Identification of Relevant Samples Size from Population Database


Step 2 - Approaches for Defining Global Market Size (Value, Volume* & Price*)

Note*: In applicable scenarios
Step 3 - Data Sources
Primary Research
- Web Analytics
- Survey Reports
- Research Institute
- Latest Research Reports
- Opinion Leaders
Secondary Research
- Annual Reports
- White Paper
- Latest Press Release
- Industry Association
- Paid Database
- Investor Presentations

Step 4 - Data Triangulation
Involves using different sources of information in order to increase the validity of a study
These sources are likely to be stakeholders in a program - participants, other researchers, program staff, other community members, and so on.
Then we put all data in single framework & apply various statistical tools to find out the dynamic on the market.
During the analysis stage, feedback from the stakeholder groups would be compared to determine areas of agreement as well as areas of divergence


