
Key Insights
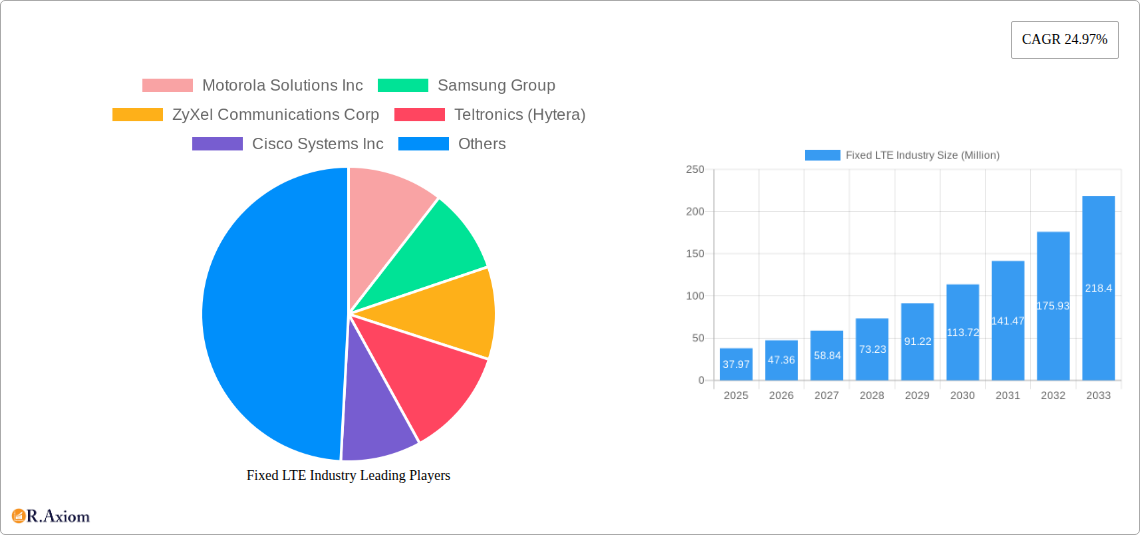
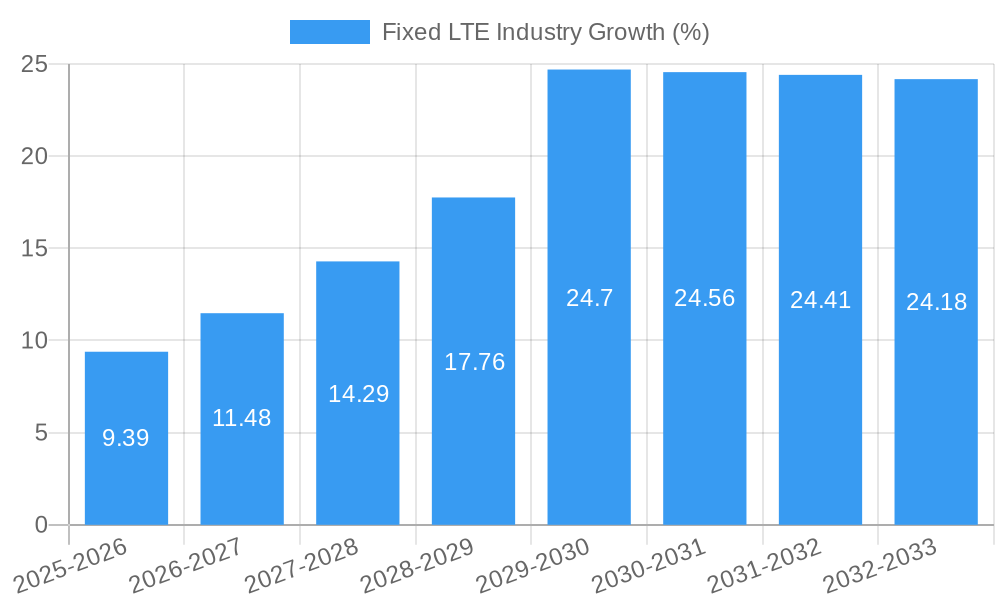
The Fixed LTE market, valued at $37.97 million in 2025, is projected to experience robust growth, exhibiting a Compound Annual Growth Rate (CAGR) of 24.97% from 2025 to 2033. This expansion is driven by several key factors. Increasing demand for high-speed broadband access, particularly in underserved rural areas and regions with limited fiber optic infrastructure, fuels the adoption of Fixed LTE solutions. The cost-effectiveness and relatively faster deployment compared to traditional fiber networks make Fixed LTE a compelling alternative for both residential and commercial users. Furthermore, technological advancements leading to improved network performance, wider coverage, and enhanced security are contributing to market growth. The market segmentation reveals a significant demand across both residential and commercial sectors, with LTE infrastructure representing the dominant solution type. However, the "Other Solution Types" segment, encompassing indoor and outdoor CPE (Customer Premises Equipment), is poised for considerable growth, driven by the need for seamless connectivity and diverse user requirements. Competitive dynamics are shaping the market landscape, with key players like Motorola Solutions, Samsung, and Huawei actively investing in R&D and expanding their product portfolios to capture market share.
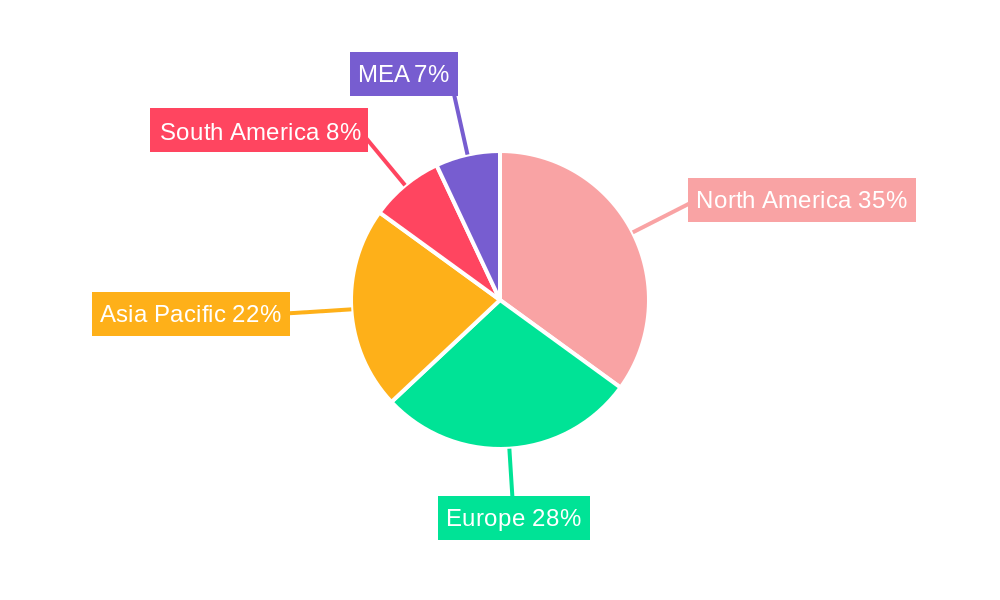
The geographical distribution of the market reveals significant growth opportunities across various regions. North America and Europe currently hold considerable market shares, driven by high broadband penetration and advanced infrastructure. However, the Asia-Pacific region is anticipated to witness the fastest growth, fueled by increasing internet usage and infrastructure development initiatives. This regional disparity underscores the need for targeted strategies, focusing on specific market needs and regulatory environments to maximize penetration and capitalize on regional growth potentials. The continuous innovation in LTE technology, coupled with strategic partnerships and mergers & acquisitions within the industry, will likely further intensify competition and fuel market expansion throughout the forecast period. Potential restraints include competition from emerging technologies like 5G fixed wireless access and the potential for regulatory hurdles related to spectrum allocation.
Fixed LTE Industry Market Report: 2019-2033
This comprehensive report provides a detailed analysis of the Fixed LTE industry, encompassing market trends, competitive landscape, technological advancements, and future growth projections from 2019 to 2033. The report leverages a robust methodology, incorporating both historical data (2019-2024) and future estimations (2025-2033), with 2025 serving as the base year. The report is crucial for industry stakeholders, investors, and businesses seeking to understand and capitalize on the evolving Fixed LTE market. With a focus on key segments (Residential and Commercial users, LTE Infrastructure and other solutions like Indoor/Outdoor CPE), this report offers actionable insights into the multi-billion-dollar Fixed LTE market.
Fixed LTE Industry Market Concentration & Innovation
The Fixed LTE market exhibits a moderately concentrated landscape, with key players like Huawei Technologies Co Ltd, ZTE Corporation, and Motorola Solutions Inc. holding significant market share. However, the presence of numerous smaller players and emerging technologies fosters a dynamic competitive environment. Market share estimates for 2025 indicate Huawei and ZTE hold approximately xx% and xx% respectively, with Motorola Solutions holding xx%. The total market value in 2025 is estimated at $xx Million. Innovation is driven by increasing demand for high-speed internet, coupled with advancements in LTE technology, particularly in areas like 5G integration and improved energy efficiency.
Several factors influence market dynamics:
- Regulatory Frameworks: Government policies regarding spectrum allocation and infrastructure development play a crucial role.
- Product Substitutes: Competition from other broadband technologies like fiber optics and satellite internet influences market growth.
- End-User Trends: Shifting consumer preferences towards higher bandwidth and lower latency drive technological advancements.
- M&A Activities: Consolidation through mergers and acquisitions (M&A) is a notable trend. While precise deal values are proprietary information, notable M&A activity in recent years (estimated total value of $xx Million) has shaped the market landscape.
Fixed LTE Industry Industry Trends & Insights
The Fixed LTE industry is experiencing robust growth, driven by several factors. The Compound Annual Growth Rate (CAGR) for the forecast period (2025-2033) is projected at xx%, indicating substantial market expansion. This growth is fueled by:
- Rising Demand for High-Speed Internet: The increasing reliance on internet-connected devices and services in both residential and commercial sectors is a key driver.
- Technological Disruptions: Advancements in LTE technology, including 5G integration and the development of more efficient CPE devices, are significantly impacting market dynamics. Market penetration of LTE-based Fixed Wireless Access (FWA) solutions is estimated to reach xx% by 2033.
- Consumer Preferences: Consumers are increasingly prioritizing speed, reliability, and affordability in their internet services.
- Competitive Dynamics: Intense competition among vendors is driving innovation and price reductions, making Fixed LTE solutions more accessible.
Dominant Markets & Segments in Fixed LTE Industry
The North American region is currently the dominant market for Fixed LTE, driven by strong infrastructure investments and high consumer demand. However, Asia-Pacific is expected to witness substantial growth in the coming years due to increasing urbanization and rising internet penetration.
Key Drivers by Segment:
- Residential: Growing demand for high-speed internet at home fuels growth.
- Commercial: Businesses are increasingly adopting Fixed LTE for reliable connectivity to support operations.
- LTE Infrastructure: Expansion of LTE networks is a major driver, facilitated by government initiatives and private investments.
- Other Solutions (Indoor/Outdoor CPE): The development of advanced CPE devices that improve performance and user experience is fueling market growth.
Dominance Analysis: The dominance of North America in the Fixed LTE market stems from established infrastructure, high disposable income, and a strong regulatory environment. While Asia-Pacific is poised for significant expansion, North America's early adoption and robust market share makes it currently the dominant segment. This is expected to change over the next decade, with Asia-Pacific's growth rate potentially surpassing North America's.
Fixed LTE Industry Product Developments
Recent product innovations focus on enhanced performance, improved energy efficiency, and seamless integration with other technologies. This includes advancements in antenna designs, improved power management in CPE devices, and the integration of 5G capabilities. The market is increasingly witnessing the introduction of cost-effective, user-friendly solutions that meet a wider range of needs, extending Fixed LTE accessibility to previously underserved communities. This adaptability and focus on user experience are critical competitive advantages.
Report Scope & Segmentation Analysis
This report segments the Fixed LTE market by:
By Type of User:
Residential: This segment encompasses consumers using Fixed LTE for home internet access. Growth is projected at xx% CAGR during 2025-2033, driven by rising demand for high-speed broadband. Competition within this segment is intense, with pricing playing a key role.
Commercial: This segment includes businesses using Fixed LTE for various applications, such as office connectivity, retail operations, and industrial IoT. Growth is expected at xx% CAGR during 2025-2033.
By Type of Solution:
LTE Infrastructure: This includes base stations, antennas, and related equipment. Market size for 2025 is estimated at $xx Million.
Other Solution Types (Indoor CPE, Outdoor CPE): This segment includes customer premise equipment (CPE) for indoor and outdoor usage. This is anticipated to have a significant market share of xx% in 2025.
Key Drivers of Fixed LTE Industry Growth
Several factors drive growth in the Fixed LTE industry:
- Technological Advancements: 5G integration enhances speed and capacity.
- Government Initiatives: Investments in infrastructure development facilitate market expansion.
- Economic Growth: Increased disposable income leads to higher demand for high-speed internet access.
Challenges in the Fixed LTE Industry Sector
The Fixed LTE industry faces several challenges:
- Spectrum Availability: Limited spectrum availability in some regions can hinder network expansion.
- Regulatory Hurdles: Complex regulatory frameworks and licensing processes can pose obstacles to market entry.
- Competition: Intense competition from other broadband technologies necessitates continuous innovation and cost optimization. The impact of competition on profitability is estimated at a xx% reduction in average profit margins by 2033.
Emerging Opportunities in Fixed LTE Industry
Emerging opportunities include:
- Expansion into Rural Areas: Bringing high-speed internet access to underserved communities represents a significant growth potential.
- Integration with IoT: Fixed LTE's role in connecting IoT devices opens up new applications across various sectors.
- Private LTE Networks: The growing adoption of private LTE networks within enterprises provides an expanding market segment.
Leading Players in the Fixed LTE Industry Market
- Motorola Solutions Inc
- Samsung Group
- ZyXel Communications Corp
- Teltronics (Hytera)
- Cisco Systems Inc
- L-com Global Connectivity
- Netgear Inc
- Sagemcom SAS
- Telenet Systems Pvt Ltd
- Huawei Technologies Co Ltd
- ZTE Corporation
- Aztech Group Ltd
- Arris International PLC
- Telrad Networks Ltd
- Shenzhen Zoolan Technology Co Ltd
- AT&T Inc
- Technicolor SA
- Datang Telecom Technology & Industry Group
- Telefonica SA
Key Developments in Fixed LTE Industry Industry
December 2022: South African-based Huge group launches Fixed LTE services for SMEs, targeting both work-from-home and large organizations. This signals a significant push into the SME market.
November 2022: San Antonio Terminal Internacional (STI) in Chile considers Nokia's industrial-grade LTE network, demonstrating the growing adoption of Fixed LTE in demanding industrial environments. This represents a substantial investment in high-performance network infrastructure.
October 2022: Nxtdigital's launch of NXTSkyFi, a broadband-over-satellite solution, illustrates an innovative approach to bridging the digital divide in regions with limited terrestrial infrastructure. This innovative approach signals a move towards hybrid solutions.
Strategic Outlook for Fixed LTE Industry Market
The Fixed LTE market is poised for continued growth, driven by technological innovation, expanding demand, and strategic investments in infrastructure development. The increasing adoption of Fixed LTE in both residential and commercial sectors, along with the expansion into new markets and applications, is expected to drive significant market expansion over the next decade. The convergence of Fixed LTE with other technologies like 5G and IoT will further accelerate market growth and create new opportunities for industry players.
Fixed LTE Industry Segmentation
-
1. Type of User
- 1.1. Residential
- 1.2. Commercial
-
2. Type of Solution
- 2.1. LTE Infrastructure
- 2.2. Other Solution Types (Indoor CPE, Outdoor CPE)
Fixed LTE Industry Segmentation By Geography
-
1. North America
- 1.1. United States
- 1.2. Canada
-
2. Europe
- 2.1. United Kingdom
- 2.2. Germany
- 2.3. France
- 2.4. Rest of the Europe
-
3. Asia Pacific
- 3.1. China
- 3.2. Japan
- 3.3. India
- 3.4. Rest of the Asia Pacific
- 4. Latin America
- 5. Middle East and Africa
Fixed LTE Industry REPORT HIGHLIGHTS
| Aspects | Details |
|---|---|
| Study Period | 2019-2033 |
| Base Year | 2024 |
| Estimated Year | 2025 |
| Forecast Period | 2025-2033 |
| Historical Period | 2019-2024 |
| Growth Rate | CAGR of 24.97% from 2019-2033 |
| Segmentation |
|
Table of Contents
- 1. Introduction
- 1.1. Research Scope
- 1.2. Market Segmentation
- 1.3. Research Methodology
- 1.4. Definitions and Assumptions
- 2. Executive Summary
- 2.1. Introduction
- 3. Market Dynamics
- 3.1. Introduction
- 3.2. Market Drivers
- 3.2.1 Increased Adoption of Public Safety LTE.; Growing Demand For High Speed BroadBand In Rural Areas; Positive Outlook of Fixed LTE Compared to DSL
- 3.2.2 Fiber and Cable
- 3.3. Market Restrains
- 3.3.1. Network Performance Concerns
- 3.4. Market Trends
- 3.4.1. Residential Type of User Expected to Account for Significant Share
- 4. Market Factor Analysis
- 4.1. Porters Five Forces
- 4.2. Supply/Value Chain
- 4.3. PESTEL analysis
- 4.4. Market Entropy
- 4.5. Patent/Trademark Analysis
- 5. Global Fixed LTE Industry Analysis, Insights and Forecast, 2019-2031
- 5.1. Market Analysis, Insights and Forecast - by Type of User
- 5.1.1. Residential
- 5.1.2. Commercial
- 5.2. Market Analysis, Insights and Forecast - by Type of Solution
- 5.2.1. LTE Infrastructure
- 5.2.2. Other Solution Types (Indoor CPE, Outdoor CPE)
- 5.3. Market Analysis, Insights and Forecast - by Region
- 5.3.1. North America
- 5.3.2. Europe
- 5.3.3. Asia Pacific
- 5.3.4. Latin America
- 5.3.5. Middle East and Africa
- 5.1. Market Analysis, Insights and Forecast - by Type of User
- 6. North America Fixed LTE Industry Analysis, Insights and Forecast, 2019-2031
- 6.1. Market Analysis, Insights and Forecast - by Type of User
- 6.1.1. Residential
- 6.1.2. Commercial
- 6.2. Market Analysis, Insights and Forecast - by Type of Solution
- 6.2.1. LTE Infrastructure
- 6.2.2. Other Solution Types (Indoor CPE, Outdoor CPE)
- 6.1. Market Analysis, Insights and Forecast - by Type of User
- 7. Europe Fixed LTE Industry Analysis, Insights and Forecast, 2019-2031
- 7.1. Market Analysis, Insights and Forecast - by Type of User
- 7.1.1. Residential
- 7.1.2. Commercial
- 7.2. Market Analysis, Insights and Forecast - by Type of Solution
- 7.2.1. LTE Infrastructure
- 7.2.2. Other Solution Types (Indoor CPE, Outdoor CPE)
- 7.1. Market Analysis, Insights and Forecast - by Type of User
- 8. Asia Pacific Fixed LTE Industry Analysis, Insights and Forecast, 2019-2031
- 8.1. Market Analysis, Insights and Forecast - by Type of User
- 8.1.1. Residential
- 8.1.2. Commercial
- 8.2. Market Analysis, Insights and Forecast - by Type of Solution
- 8.2.1. LTE Infrastructure
- 8.2.2. Other Solution Types (Indoor CPE, Outdoor CPE)
- 8.1. Market Analysis, Insights and Forecast - by Type of User
- 9. Latin America Fixed LTE Industry Analysis, Insights and Forecast, 2019-2031
- 9.1. Market Analysis, Insights and Forecast - by Type of User
- 9.1.1. Residential
- 9.1.2. Commercial
- 9.2. Market Analysis, Insights and Forecast - by Type of Solution
- 9.2.1. LTE Infrastructure
- 9.2.2. Other Solution Types (Indoor CPE, Outdoor CPE)
- 9.1. Market Analysis, Insights and Forecast - by Type of User
- 10. Middle East and Africa Fixed LTE Industry Analysis, Insights and Forecast, 2019-2031
- 10.1. Market Analysis, Insights and Forecast - by Type of User
- 10.1.1. Residential
- 10.1.2. Commercial
- 10.2. Market Analysis, Insights and Forecast - by Type of Solution
- 10.2.1. LTE Infrastructure
- 10.2.2. Other Solution Types (Indoor CPE, Outdoor CPE)
- 10.1. Market Analysis, Insights and Forecast - by Type of User
- 11. North America Fixed LTE Industry Analysis, Insights and Forecast, 2019-2031
- 11.1. Market Analysis, Insights and Forecast - By Country/Sub-region
- 11.1.1 United States
- 11.1.2 Canada
- 11.1.3 Mexico
- 12. Europe Fixed LTE Industry Analysis, Insights and Forecast, 2019-2031
- 12.1. Market Analysis, Insights and Forecast - By Country/Sub-region
- 12.1.1 Germany
- 12.1.2 United Kingdom
- 12.1.3 France
- 12.1.4 Spain
- 12.1.5 Italy
- 12.1.6 Spain
- 12.1.7 Belgium
- 12.1.8 Netherland
- 12.1.9 Nordics
- 12.1.10 Rest of Europe
- 13. Asia Pacific Fixed LTE Industry Analysis, Insights and Forecast, 2019-2031
- 13.1. Market Analysis, Insights and Forecast - By Country/Sub-region
- 13.1.1 China
- 13.1.2 Japan
- 13.1.3 India
- 13.1.4 South Korea
- 13.1.5 Southeast Asia
- 13.1.6 Australia
- 13.1.7 Indonesia
- 13.1.8 Phillipes
- 13.1.9 Singapore
- 13.1.10 Thailandc
- 13.1.11 Rest of Asia Pacific
- 14. South America Fixed LTE Industry Analysis, Insights and Forecast, 2019-2031
- 14.1. Market Analysis, Insights and Forecast - By Country/Sub-region
- 14.1.1 Brazil
- 14.1.2 Argentina
- 14.1.3 Peru
- 14.1.4 Chile
- 14.1.5 Colombia
- 14.1.6 Ecuador
- 14.1.7 Venezuela
- 14.1.8 Rest of South America
- 15. North America Fixed LTE Industry Analysis, Insights and Forecast, 2019-2031
- 15.1. Market Analysis, Insights and Forecast - By Country/Sub-region
- 15.1.1 United States
- 15.1.2 Canada
- 15.1.3 Mexico
- 16. MEA Fixed LTE Industry Analysis, Insights and Forecast, 2019-2031
- 16.1. Market Analysis, Insights and Forecast - By Country/Sub-region
- 16.1.1 United Arab Emirates
- 16.1.2 Saudi Arabia
- 16.1.3 South Africa
- 16.1.4 Rest of Middle East and Africa
- 17. Competitive Analysis
- 17.1. Global Market Share Analysis 2024
- 17.2. Company Profiles
- 17.2.1 Motorola Solutions Inc
- 17.2.1.1. Overview
- 17.2.1.2. Products
- 17.2.1.3. SWOT Analysis
- 17.2.1.4. Recent Developments
- 17.2.1.5. Financials (Based on Availability)
- 17.2.2 Samsung Group
- 17.2.2.1. Overview
- 17.2.2.2. Products
- 17.2.2.3. SWOT Analysis
- 17.2.2.4. Recent Developments
- 17.2.2.5. Financials (Based on Availability)
- 17.2.3 ZyXel Communications Corp
- 17.2.3.1. Overview
- 17.2.3.2. Products
- 17.2.3.3. SWOT Analysis
- 17.2.3.4. Recent Developments
- 17.2.3.5. Financials (Based on Availability)
- 17.2.4 Teltronics (Hytera)
- 17.2.4.1. Overview
- 17.2.4.2. Products
- 17.2.4.3. SWOT Analysis
- 17.2.4.4. Recent Developments
- 17.2.4.5. Financials (Based on Availability)
- 17.2.5 Cisco Systems Inc
- 17.2.5.1. Overview
- 17.2.5.2. Products
- 17.2.5.3. SWOT Analysis
- 17.2.5.4. Recent Developments
- 17.2.5.5. Financials (Based on Availability)
- 17.2.6 L-com Global Connectivity
- 17.2.6.1. Overview
- 17.2.6.2. Products
- 17.2.6.3. SWOT Analysis
- 17.2.6.4. Recent Developments
- 17.2.6.5. Financials (Based on Availability)
- 17.2.7 Netgear Inc
- 17.2.7.1. Overview
- 17.2.7.2. Products
- 17.2.7.3. SWOT Analysis
- 17.2.7.4. Recent Developments
- 17.2.7.5. Financials (Based on Availability)
- 17.2.8 Sagemcom SAS
- 17.2.8.1. Overview
- 17.2.8.2. Products
- 17.2.8.3. SWOT Analysis
- 17.2.8.4. Recent Developments
- 17.2.8.5. Financials (Based on Availability)
- 17.2.9 Telenet Systems Pvt Ltd
- 17.2.9.1. Overview
- 17.2.9.2. Products
- 17.2.9.3. SWOT Analysis
- 17.2.9.4. Recent Developments
- 17.2.9.5. Financials (Based on Availability)
- 17.2.10 Huawei Technologies Co Ltd
- 17.2.10.1. Overview
- 17.2.10.2. Products
- 17.2.10.3. SWOT Analysis
- 17.2.10.4. Recent Developments
- 17.2.10.5. Financials (Based on Availability)
- 17.2.11 ZTE Corporation
- 17.2.11.1. Overview
- 17.2.11.2. Products
- 17.2.11.3. SWOT Analysis
- 17.2.11.4. Recent Developments
- 17.2.11.5. Financials (Based on Availability)
- 17.2.12 Aztech Group Ltd
- 17.2.12.1. Overview
- 17.2.12.2. Products
- 17.2.12.3. SWOT Analysis
- 17.2.12.4. Recent Developments
- 17.2.12.5. Financials (Based on Availability)
- 17.2.13 Arris International PLC
- 17.2.13.1. Overview
- 17.2.13.2. Products
- 17.2.13.3. SWOT Analysis
- 17.2.13.4. Recent Developments
- 17.2.13.5. Financials (Based on Availability)
- 17.2.14 Telrad Networks Ltd
- 17.2.14.1. Overview
- 17.2.14.2. Products
- 17.2.14.3. SWOT Analysis
- 17.2.14.4. Recent Developments
- 17.2.14.5. Financials (Based on Availability)
- 17.2.15 Shenzhen Zoolan Technology Co Ltd
- 17.2.15.1. Overview
- 17.2.15.2. Products
- 17.2.15.3. SWOT Analysis
- 17.2.15.4. Recent Developments
- 17.2.15.5. Financials (Based on Availability)
- 17.2.16 AT&T Inc
- 17.2.16.1. Overview
- 17.2.16.2. Products
- 17.2.16.3. SWOT Analysis
- 17.2.16.4. Recent Developments
- 17.2.16.5. Financials (Based on Availability)
- 17.2.17 Technicolor SA
- 17.2.17.1. Overview
- 17.2.17.2. Products
- 17.2.17.3. SWOT Analysis
- 17.2.17.4. Recent Developments
- 17.2.17.5. Financials (Based on Availability)
- 17.2.18 Datang Telecom Technology & Industry Group*List Not Exhaustive
- 17.2.18.1. Overview
- 17.2.18.2. Products
- 17.2.18.3. SWOT Analysis
- 17.2.18.4. Recent Developments
- 17.2.18.5. Financials (Based on Availability)
- 17.2.19 Telefonica SA
- 17.2.19.1. Overview
- 17.2.19.2. Products
- 17.2.19.3. SWOT Analysis
- 17.2.19.4. Recent Developments
- 17.2.19.5. Financials (Based on Availability)
- 17.2.1 Motorola Solutions Inc
List of Figures
- Figure 1: Global Fixed LTE Industry Revenue Breakdown (Million, %) by Region 2024 & 2032
- Figure 2: North America Fixed LTE Industry Revenue (Million), by Country 2024 & 2032
- Figure 3: North America Fixed LTE Industry Revenue Share (%), by Country 2024 & 2032
- Figure 4: Europe Fixed LTE Industry Revenue (Million), by Country 2024 & 2032
- Figure 5: Europe Fixed LTE Industry Revenue Share (%), by Country 2024 & 2032
- Figure 6: Asia Pacific Fixed LTE Industry Revenue (Million), by Country 2024 & 2032
- Figure 7: Asia Pacific Fixed LTE Industry Revenue Share (%), by Country 2024 & 2032
- Figure 8: South America Fixed LTE Industry Revenue (Million), by Country 2024 & 2032
- Figure 9: South America Fixed LTE Industry Revenue Share (%), by Country 2024 & 2032
- Figure 10: North America Fixed LTE Industry Revenue (Million), by Country 2024 & 2032
- Figure 11: North America Fixed LTE Industry Revenue Share (%), by Country 2024 & 2032
- Figure 12: MEA Fixed LTE Industry Revenue (Million), by Country 2024 & 2032
- Figure 13: MEA Fixed LTE Industry Revenue Share (%), by Country 2024 & 2032
- Figure 14: North America Fixed LTE Industry Revenue (Million), by Type of User 2024 & 2032
- Figure 15: North America Fixed LTE Industry Revenue Share (%), by Type of User 2024 & 2032
- Figure 16: North America Fixed LTE Industry Revenue (Million), by Type of Solution 2024 & 2032
- Figure 17: North America Fixed LTE Industry Revenue Share (%), by Type of Solution 2024 & 2032
- Figure 18: North America Fixed LTE Industry Revenue (Million), by Country 2024 & 2032
- Figure 19: North America Fixed LTE Industry Revenue Share (%), by Country 2024 & 2032
- Figure 20: Europe Fixed LTE Industry Revenue (Million), by Type of User 2024 & 2032
- Figure 21: Europe Fixed LTE Industry Revenue Share (%), by Type of User 2024 & 2032
- Figure 22: Europe Fixed LTE Industry Revenue (Million), by Type of Solution 2024 & 2032
- Figure 23: Europe Fixed LTE Industry Revenue Share (%), by Type of Solution 2024 & 2032
- Figure 24: Europe Fixed LTE Industry Revenue (Million), by Country 2024 & 2032
- Figure 25: Europe Fixed LTE Industry Revenue Share (%), by Country 2024 & 2032
- Figure 26: Asia Pacific Fixed LTE Industry Revenue (Million), by Type of User 2024 & 2032
- Figure 27: Asia Pacific Fixed LTE Industry Revenue Share (%), by Type of User 2024 & 2032
- Figure 28: Asia Pacific Fixed LTE Industry Revenue (Million), by Type of Solution 2024 & 2032
- Figure 29: Asia Pacific Fixed LTE Industry Revenue Share (%), by Type of Solution 2024 & 2032
- Figure 30: Asia Pacific Fixed LTE Industry Revenue (Million), by Country 2024 & 2032
- Figure 31: Asia Pacific Fixed LTE Industry Revenue Share (%), by Country 2024 & 2032
- Figure 32: Latin America Fixed LTE Industry Revenue (Million), by Type of User 2024 & 2032
- Figure 33: Latin America Fixed LTE Industry Revenue Share (%), by Type of User 2024 & 2032
- Figure 34: Latin America Fixed LTE Industry Revenue (Million), by Type of Solution 2024 & 2032
- Figure 35: Latin America Fixed LTE Industry Revenue Share (%), by Type of Solution 2024 & 2032
- Figure 36: Latin America Fixed LTE Industry Revenue (Million), by Country 2024 & 2032
- Figure 37: Latin America Fixed LTE Industry Revenue Share (%), by Country 2024 & 2032
- Figure 38: Middle East and Africa Fixed LTE Industry Revenue (Million), by Type of User 2024 & 2032
- Figure 39: Middle East and Africa Fixed LTE Industry Revenue Share (%), by Type of User 2024 & 2032
- Figure 40: Middle East and Africa Fixed LTE Industry Revenue (Million), by Type of Solution 2024 & 2032
- Figure 41: Middle East and Africa Fixed LTE Industry Revenue Share (%), by Type of Solution 2024 & 2032
- Figure 42: Middle East and Africa Fixed LTE Industry Revenue (Million), by Country 2024 & 2032
- Figure 43: Middle East and Africa Fixed LTE Industry Revenue Share (%), by Country 2024 & 2032
List of Tables
- Table 1: Global Fixed LTE Industry Revenue Million Forecast, by Region 2019 & 2032
- Table 2: Global Fixed LTE Industry Revenue Million Forecast, by Type of User 2019 & 2032
- Table 3: Global Fixed LTE Industry Revenue Million Forecast, by Type of Solution 2019 & 2032
- Table 4: Global Fixed LTE Industry Revenue Million Forecast, by Region 2019 & 2032
- Table 5: Global Fixed LTE Industry Revenue Million Forecast, by Country 2019 & 2032
- Table 6: United States Fixed LTE Industry Revenue (Million) Forecast, by Application 2019 & 2032
- Table 7: Canada Fixed LTE Industry Revenue (Million) Forecast, by Application 2019 & 2032
- Table 8: Mexico Fixed LTE Industry Revenue (Million) Forecast, by Application 2019 & 2032
- Table 9: Global Fixed LTE Industry Revenue Million Forecast, by Country 2019 & 2032
- Table 10: Germany Fixed LTE Industry Revenue (Million) Forecast, by Application 2019 & 2032
- Table 11: United Kingdom Fixed LTE Industry Revenue (Million) Forecast, by Application 2019 & 2032
- Table 12: France Fixed LTE Industry Revenue (Million) Forecast, by Application 2019 & 2032
- Table 13: Spain Fixed LTE Industry Revenue (Million) Forecast, by Application 2019 & 2032
- Table 14: Italy Fixed LTE Industry Revenue (Million) Forecast, by Application 2019 & 2032
- Table 15: Spain Fixed LTE Industry Revenue (Million) Forecast, by Application 2019 & 2032
- Table 16: Belgium Fixed LTE Industry Revenue (Million) Forecast, by Application 2019 & 2032
- Table 17: Netherland Fixed LTE Industry Revenue (Million) Forecast, by Application 2019 & 2032
- Table 18: Nordics Fixed LTE Industry Revenue (Million) Forecast, by Application 2019 & 2032
- Table 19: Rest of Europe Fixed LTE Industry Revenue (Million) Forecast, by Application 2019 & 2032
- Table 20: Global Fixed LTE Industry Revenue Million Forecast, by Country 2019 & 2032
- Table 21: China Fixed LTE Industry Revenue (Million) Forecast, by Application 2019 & 2032
- Table 22: Japan Fixed LTE Industry Revenue (Million) Forecast, by Application 2019 & 2032
- Table 23: India Fixed LTE Industry Revenue (Million) Forecast, by Application 2019 & 2032
- Table 24: South Korea Fixed LTE Industry Revenue (Million) Forecast, by Application 2019 & 2032
- Table 25: Southeast Asia Fixed LTE Industry Revenue (Million) Forecast, by Application 2019 & 2032
- Table 26: Australia Fixed LTE Industry Revenue (Million) Forecast, by Application 2019 & 2032
- Table 27: Indonesia Fixed LTE Industry Revenue (Million) Forecast, by Application 2019 & 2032
- Table 28: Phillipes Fixed LTE Industry Revenue (Million) Forecast, by Application 2019 & 2032
- Table 29: Singapore Fixed LTE Industry Revenue (Million) Forecast, by Application 2019 & 2032
- Table 30: Thailandc Fixed LTE Industry Revenue (Million) Forecast, by Application 2019 & 2032
- Table 31: Rest of Asia Pacific Fixed LTE Industry Revenue (Million) Forecast, by Application 2019 & 2032
- Table 32: Global Fixed LTE Industry Revenue Million Forecast, by Country 2019 & 2032
- Table 33: Brazil Fixed LTE Industry Revenue (Million) Forecast, by Application 2019 & 2032
- Table 34: Argentina Fixed LTE Industry Revenue (Million) Forecast, by Application 2019 & 2032
- Table 35: Peru Fixed LTE Industry Revenue (Million) Forecast, by Application 2019 & 2032
- Table 36: Chile Fixed LTE Industry Revenue (Million) Forecast, by Application 2019 & 2032
- Table 37: Colombia Fixed LTE Industry Revenue (Million) Forecast, by Application 2019 & 2032
- Table 38: Ecuador Fixed LTE Industry Revenue (Million) Forecast, by Application 2019 & 2032
- Table 39: Venezuela Fixed LTE Industry Revenue (Million) Forecast, by Application 2019 & 2032
- Table 40: Rest of South America Fixed LTE Industry Revenue (Million) Forecast, by Application 2019 & 2032
- Table 41: Global Fixed LTE Industry Revenue Million Forecast, by Country 2019 & 2032
- Table 42: United States Fixed LTE Industry Revenue (Million) Forecast, by Application 2019 & 2032
- Table 43: Canada Fixed LTE Industry Revenue (Million) Forecast, by Application 2019 & 2032
- Table 44: Mexico Fixed LTE Industry Revenue (Million) Forecast, by Application 2019 & 2032
- Table 45: Global Fixed LTE Industry Revenue Million Forecast, by Country 2019 & 2032
- Table 46: United Arab Emirates Fixed LTE Industry Revenue (Million) Forecast, by Application 2019 & 2032
- Table 47: Saudi Arabia Fixed LTE Industry Revenue (Million) Forecast, by Application 2019 & 2032
- Table 48: South Africa Fixed LTE Industry Revenue (Million) Forecast, by Application 2019 & 2032
- Table 49: Rest of Middle East and Africa Fixed LTE Industry Revenue (Million) Forecast, by Application 2019 & 2032
- Table 50: Global Fixed LTE Industry Revenue Million Forecast, by Type of User 2019 & 2032
- Table 51: Global Fixed LTE Industry Revenue Million Forecast, by Type of Solution 2019 & 2032
- Table 52: Global Fixed LTE Industry Revenue Million Forecast, by Country 2019 & 2032
- Table 53: United States Fixed LTE Industry Revenue (Million) Forecast, by Application 2019 & 2032
- Table 54: Canada Fixed LTE Industry Revenue (Million) Forecast, by Application 2019 & 2032
- Table 55: Global Fixed LTE Industry Revenue Million Forecast, by Type of User 2019 & 2032
- Table 56: Global Fixed LTE Industry Revenue Million Forecast, by Type of Solution 2019 & 2032
- Table 57: Global Fixed LTE Industry Revenue Million Forecast, by Country 2019 & 2032
- Table 58: United Kingdom Fixed LTE Industry Revenue (Million) Forecast, by Application 2019 & 2032
- Table 59: Germany Fixed LTE Industry Revenue (Million) Forecast, by Application 2019 & 2032
- Table 60: France Fixed LTE Industry Revenue (Million) Forecast, by Application 2019 & 2032
- Table 61: Rest of the Europe Fixed LTE Industry Revenue (Million) Forecast, by Application 2019 & 2032
- Table 62: Global Fixed LTE Industry Revenue Million Forecast, by Type of User 2019 & 2032
- Table 63: Global Fixed LTE Industry Revenue Million Forecast, by Type of Solution 2019 & 2032
- Table 64: Global Fixed LTE Industry Revenue Million Forecast, by Country 2019 & 2032
- Table 65: China Fixed LTE Industry Revenue (Million) Forecast, by Application 2019 & 2032
- Table 66: Japan Fixed LTE Industry Revenue (Million) Forecast, by Application 2019 & 2032
- Table 67: India Fixed LTE Industry Revenue (Million) Forecast, by Application 2019 & 2032
- Table 68: Rest of the Asia Pacific Fixed LTE Industry Revenue (Million) Forecast, by Application 2019 & 2032
- Table 69: Global Fixed LTE Industry Revenue Million Forecast, by Type of User 2019 & 2032
- Table 70: Global Fixed LTE Industry Revenue Million Forecast, by Type of Solution 2019 & 2032
- Table 71: Global Fixed LTE Industry Revenue Million Forecast, by Country 2019 & 2032
- Table 72: Global Fixed LTE Industry Revenue Million Forecast, by Type of User 2019 & 2032
- Table 73: Global Fixed LTE Industry Revenue Million Forecast, by Type of Solution 2019 & 2032
- Table 74: Global Fixed LTE Industry Revenue Million Forecast, by Country 2019 & 2032
Frequently Asked Questions
1. What is the projected Compound Annual Growth Rate (CAGR) of the Fixed LTE Industry?
The projected CAGR is approximately 24.97%.
2. Which companies are prominent players in the Fixed LTE Industry?
Key companies in the market include Motorola Solutions Inc, Samsung Group, ZyXel Communications Corp, Teltronics (Hytera), Cisco Systems Inc, L-com Global Connectivity, Netgear Inc, Sagemcom SAS, Telenet Systems Pvt Ltd, Huawei Technologies Co Ltd, ZTE Corporation, Aztech Group Ltd, Arris International PLC, Telrad Networks Ltd, Shenzhen Zoolan Technology Co Ltd, AT&T Inc, Technicolor SA, Datang Telecom Technology & Industry Group*List Not Exhaustive, Telefonica SA.
3. What are the main segments of the Fixed LTE Industry?
The market segments include Type of User, Type of Solution.
4. Can you provide details about the market size?
The market size is estimated to be USD 37.97 Million as of 2022.
5. What are some drivers contributing to market growth?
Increased Adoption of Public Safety LTE.; Growing Demand For High Speed BroadBand In Rural Areas; Positive Outlook of Fixed LTE Compared to DSL. Fiber and Cable.
6. What are the notable trends driving market growth?
Residential Type of User Expected to Account for Significant Share.
7. Are there any restraints impacting market growth?
Network Performance Concerns.
8. Can you provide examples of recent developments in the market?
December 2022 - South African-based Huge group formed a new business group to offer Fixed LTE services to SMEs (Small and Small-Medium Enterprises). The company has designed smaller internet packages suitable for work-from-home scenarios and large packages to serve big organizations. The group already has a combined customer base of 19000 19 000 businesses and SMEs and plans to expand this further.
9. What pricing options are available for accessing the report?
Pricing options include single-user, multi-user, and enterprise licenses priced at USD 4750, USD 5250, and USD 8750 respectively.
10. Is the market size provided in terms of value or volume?
The market size is provided in terms of value, measured in Million.
11. Are there any specific market keywords associated with the report?
Yes, the market keyword associated with the report is "Fixed LTE Industry," which aids in identifying and referencing the specific market segment covered.
12. How do I determine which pricing option suits my needs best?
The pricing options vary based on user requirements and access needs. Individual users may opt for single-user licenses, while businesses requiring broader access may choose multi-user or enterprise licenses for cost-effective access to the report.
13. Are there any additional resources or data provided in the Fixed LTE Industry report?
While the report offers comprehensive insights, it's advisable to review the specific contents or supplementary materials provided to ascertain if additional resources or data are available.
14. How can I stay updated on further developments or reports in the Fixed LTE Industry?
To stay informed about further developments, trends, and reports in the Fixed LTE Industry, consider subscribing to industry newsletters, following relevant companies and organizations, or regularly checking reputable industry news sources and publications.
Methodology
Step 1 - Identification of Relevant Samples Size from Population Database


Step 2 - Approaches for Defining Global Market Size (Value, Volume* & Price*)

Note*: In applicable scenarios
Step 3 - Data Sources
Primary Research
- Web Analytics
- Survey Reports
- Research Institute
- Latest Research Reports
- Opinion Leaders
Secondary Research
- Annual Reports
- White Paper
- Latest Press Release
- Industry Association
- Paid Database
- Investor Presentations

Step 4 - Data Triangulation
Involves using different sources of information in order to increase the validity of a study
These sources are likely to be stakeholders in a program - participants, other researchers, program staff, other community members, and so on.
Then we put all data in single framework & apply various statistical tools to find out the dynamic on the market.
During the analysis stage, feedback from the stakeholder groups would be compared to determine areas of agreement as well as areas of divergence


