
Key Insights
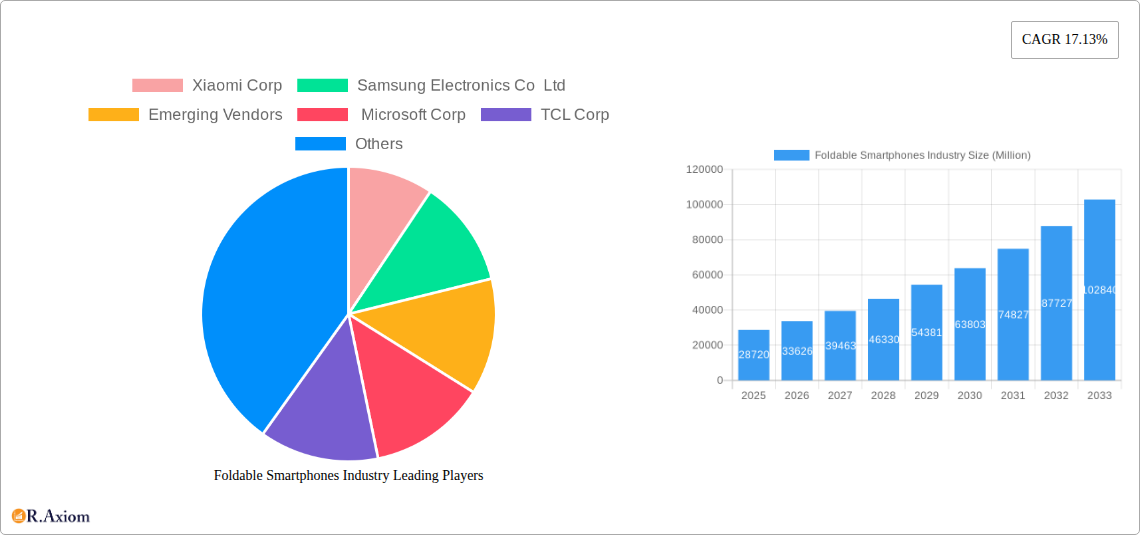
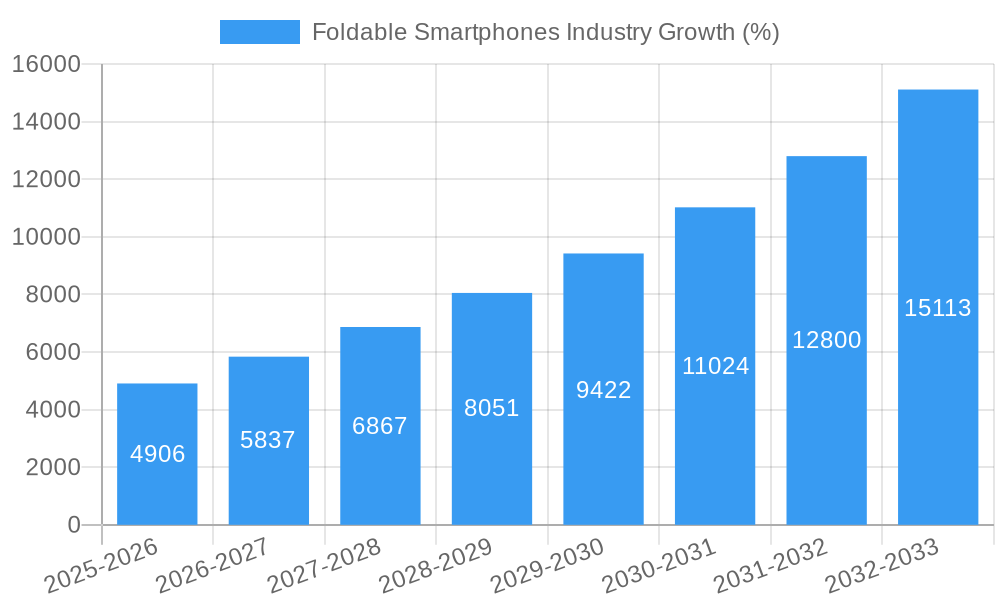
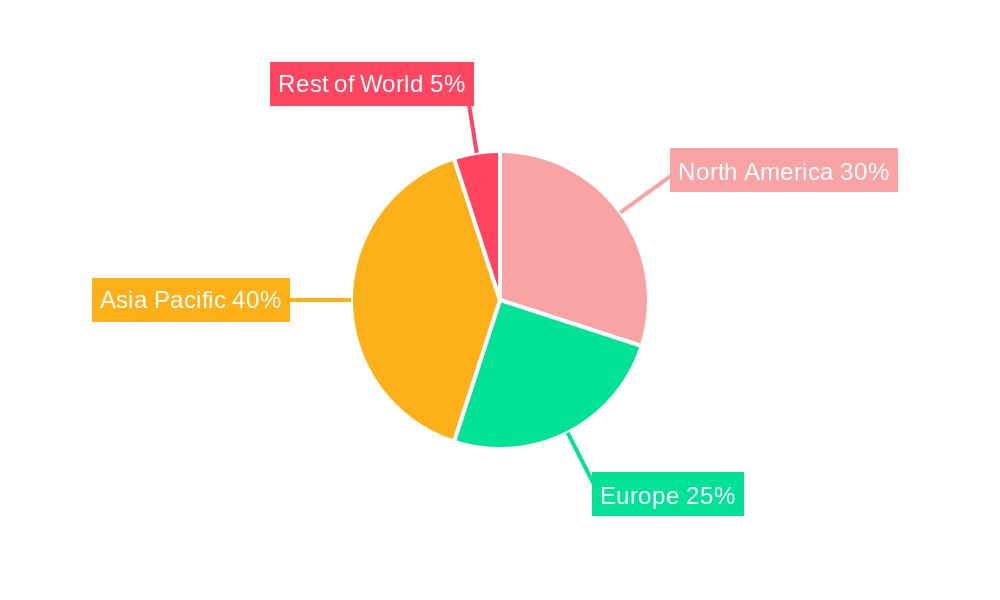
The foldable smartphone market, currently valued at $28.72 billion in 2025, is experiencing robust growth, projected to expand at a Compound Annual Growth Rate (CAGR) of 17.13% from 2025 to 2033. This significant expansion is driven by several key factors. Firstly, technological advancements have led to more durable and reliable foldable screens, addressing earlier concerns about durability and longevity. Secondly, increasing consumer demand for larger screens and innovative form factors is fueling market adoption. The introduction of more affordable foldable models is also broadening accessibility beyond premium segments. Key players like Samsung, Xiaomi, and Apple are aggressively competing, driving innovation and further pushing market growth. However, challenges remain, including the relatively high price point of foldable devices compared to traditional smartphones which limits broader market penetration. Furthermore, the complexity of manufacturing foldable screens and potential supply chain constraints could impact growth trajectory in the short term. The market is segmented by functionality (inward and outward folding), with both types contributing to the overall growth, though inward folding currently holds a larger market share due to its more established technology and potentially higher consumer preference for protection. Regional analysis indicates that the Asia-Pacific region is likely to dominate the market, driven by high smartphone adoption rates and manufacturing hubs in the region, followed by North America and EMEA (Europe, the Middle East, and Africa).
The competitive landscape is intense, with established players like Samsung and Apple vying for market dominance alongside emerging vendors who are introducing innovative features and more competitive pricing. Successful strategies involve focusing on improved durability, innovative software experiences tailored to the foldable form factor, and competitive pricing to stimulate broader adoption. The continued technological advancements and decreasing manufacturing costs are expected to further drive market expansion, with a projected substantial market size by 2033. The long-term outlook for the foldable smartphone market remains highly positive, driven by increasing consumer demand and the ongoing innovations in display technology. However, addressing consumer concerns regarding durability and price will be crucial for sustained growth.
Foldable Smartphones Industry: A Comprehensive Market Report (2019-2033)
This in-depth report provides a comprehensive analysis of the foldable smartphones industry, covering market dynamics, key players, technological advancements, and future growth prospects from 2019 to 2033. The study period encompasses historical data (2019-2024), the base year (2025), the estimated year (2025), and a detailed forecast (2025-2033). This report is essential for industry stakeholders, investors, and strategists seeking actionable insights into this rapidly evolving market. The market is valued at xx Million in 2025 and is projected to reach xx Million by 2033, exhibiting a CAGR of xx%.
Foldable Smartphones Industry Market Concentration & Innovation
This section analyzes the competitive landscape of the foldable smartphone market, examining market concentration, innovation drivers, regulatory influences, product substitutes, end-user trends, and mergers & acquisitions (M&A) activities.
The market is currently characterized by a moderately concentrated structure, with key players like Samsung Electronics Co Ltd and Xiaomi Corp holding significant market share. However, the emergence of several new vendors is intensifying competition. Innovation is driven by advancements in flexible display technology, improved hinge mechanisms, and enhanced software integration. Regulatory frameworks related to safety and data privacy are shaping industry practices. The lack of affordable alternatives and evolving consumer preferences towards larger screens are impacting market growth.
- Market Share: Samsung Electronics holds approximately xx% market share, followed by Xiaomi Corp with xx%.
- M&A Activity: The past five years have witnessed xx M&A deals in the foldable smartphone sector, with a total deal value of approximately xx Million. These deals predominantly involved smaller companies being acquired by established players.
Foldable Smartphones Industry Industry Trends & Insights
The foldable smartphone market is witnessing robust growth fueled by several factors. Technological advancements in flexible displays and durable hinges are driving innovation, while the increasing demand for larger screens and enhanced user experience is boosting consumer adoption. The market is experiencing technological disruptions with new materials and designs constantly emerging, pushing boundaries and shaping user expectations. Competitive dynamics are intensely competitive with key players focused on differentiation through unique features, pricing strategies, and brand positioning.
The CAGR for the foldable smartphone market during the forecast period (2025-2033) is projected to be xx%, indicating substantial growth potential. Market penetration is expected to increase from xx% in 2025 to xx% by 2033, reflecting rising consumer adoption.
Dominant Markets & Segments in Foldable Smartphones Industry
The dominant market for foldable smartphones is currently North America, followed by Asia. Within Asia, China and South Korea represent key markets. The inward fold segment currently dominates the market due to its compact form factor and affordability, although the outward fold segment is rapidly gaining traction due to its larger screen size.
- Key Drivers in North America: Strong consumer demand for premium electronics, high disposable incomes, and advanced infrastructure.
- Key Drivers in Asia (China & South Korea): High smartphone penetration, a growing middle class, and a strong manufacturing base.
The outward fold segment is expected to witness faster growth due to its larger display and potential to capture the tablet market share while the inward fold segment benefits from its compact form factor and perceived affordability.
Foldable Smartphones Industry Product Developments
Recent product innovations focus on improving durability, reducing the crease in foldable screens, and enhancing water resistance. Applications extend beyond communication to include productivity, gaming, and multimedia consumption. Competitive advantages are achieved through superior screen quality, innovative hinge designs, and integrated software features. The trend is towards lighter, slimmer devices with more advanced functionalities.
Report Scope & Segmentation Analysis
This report segments the foldable smartphone market by functionality type:
Inward Fold: This segment features foldable smartphones that fold inward, resulting in a more compact device when folded. The market size for inward fold smartphones is projected to be xx Million in 2025, growing to xx Million by 2033, with a CAGR of xx%. Competition is intense, with several established and emerging vendors vying for market share.
Outward Fold: This segment includes foldable smartphones that fold outward, offering a larger screen area when unfolded. The market size is estimated at xx Million in 2025, expected to reach xx Million by 2033, with a CAGR of xx%. This segment benefits from the larger display size but faces challenges in terms of durability and cost.
Key Drivers of Foldable Smartphones Industry Growth
The foldable smartphone industry's growth is fueled by technological advancements, economic factors, and supportive regulatory environments. Advancements in flexible display technology, robust hinge mechanisms, and powerful processors drive product innovation. Growing consumer disposable incomes, especially in emerging markets, fuel demand. Government policies promoting technological innovation also contribute to market expansion.
Challenges in the Foldable Smartphones Industry Sector
The foldable smartphone industry faces challenges such as high manufacturing costs, supply chain disruptions, and intense competition. High prices limit market accessibility, while the complexity of flexible displays and hinges impacts durability. Competition from established smartphone manufacturers further complicates market dynamics. These factors combined have impacted the overall market growth by xx% in 2024.
Emerging Opportunities in Foldable Smartphones Industry
The industry presents promising opportunities in the expansion into emerging markets and the development of specialized applications. Opportunities are arising in regions with rising smartphone penetration, like Africa and Latin America. Furthermore, niche applications such as foldable devices for professionals (e.g., designers, engineers) and customized foldable screens for specific applications will create new market segments.
Leading Players in the Foldable Smartphones Industry Market
- Xiaomi Corp
- Samsung Electronics Co Ltd
- Emerging Vendors
- Microsoft Corp
- TCL Corp
- Lenovo Group Ltd
- LG Electronics Inc
- Sony Corp
- Apple Inc
- Motorola Mobility LLC (Lenovo Group Limited)
- Commercialised Vendors (Market Ready)
- Royole Corp
- Huawei Technologies Co Ltd
- Energizer Holdings Inc
- ZTE Corporation
Key Developments in Foldable Smartphones Industry Industry
- August 2022: Samsung Electronics launched the Galaxy Z Flip4 (USD 999.99) and Galaxy Z Fold4 (USD 1,799.99), signifying advancements in foldable technology and further market penetration in the premium segment.
- November 2022: Huawei introduced the Pocket S, a budget-friendly flip-style foldable phone (USD 819-1025) targeting a wider consumer base and expanding the market to price-sensitive customers. This move increased market competition.
Strategic Outlook for Foldable Smartphones Industry Market
The foldable smartphone market is poised for significant growth driven by ongoing technological innovations, falling prices, and increased consumer acceptance. Future opportunities lie in developing more durable and affordable devices, expanding into new markets, and exploring diverse applications beyond basic communication, creating a larger addressable market. The market is expected to mature further over the next decade, with increased competition and innovation driving its expansion.
Foldable Smartphones Industry Segmentation
-
1. Functionality Types
- 1.1. Inward Fold
- 1.2. Outward Fold
-
2. Geography
- 2.1. Americas
- 2.2. EMEA
- 2.3. Asia Pacific
Foldable Smartphones Industry Segmentation By Geography
-
1. North America
- 1.1. United States
- 1.2. Canada
- 1.3. Mexico
-
2. Europe
- 2.1. Germany
- 2.2. United Kingdom
- 2.3. France
- 2.4. Italy
- 2.5. Spain
- 2.6. Rest of Europe
-
3. Asia Pacific
- 3.1. China
- 3.2. Japan
- 3.3. India
- 3.4. Australia
- 3.5. South Korea
- 3.6. Rest of Asia Pacific
-
4. South America
- 4.1. Brazil
- 4.2. Argentina
- 4.3. Rest of South America
-
5. MEA
- 5.1. UAE
- 5.2. South Africa
- 5.3. Saudi Arabia
- 5.4. Rest Of MEA
Foldable Smartphones Industry REPORT HIGHLIGHTS
| Aspects | Details |
|---|---|
| Study Period | 2019-2033 |
| Base Year | 2024 |
| Estimated Year | 2025 |
| Forecast Period | 2025-2033 |
| Historical Period | 2019-2024 |
| Growth Rate | CAGR of 17.13% from 2019-2033 |
| Segmentation |
|
Table of Contents
- 1. Introduction
- 1.1. Research Scope
- 1.2. Market Segmentation
- 1.3. Research Methodology
- 1.4. Definitions and Assumptions
- 2. Executive Summary
- 2.1. Introduction
- 3. Market Dynamics
- 3.1. Introduction
- 3.2. Market Drivers
- 3.2.1. Miniaturization of the Display Technology Products; Growing Demand of Multi-Screen Smartphone
- 3.3. Market Restrains
- 3.3.1. Complexity in the Manufacturing Process with Countable Number of Folds; Huge Price Tags with Products from Prominent Vendors
- 3.4. Market Trends
- 3.4.1. Growing Demand of Multi-Screen Smartphone
- 4. Market Factor Analysis
- 4.1. Porters Five Forces
- 4.2. Supply/Value Chain
- 4.3. PESTEL analysis
- 4.4. Market Entropy
- 4.5. Patent/Trademark Analysis
- 5. Global Foldable Smartphones Industry Analysis, Insights and Forecast, 2019-2031
- 5.1. Market Analysis, Insights and Forecast - by Functionality Types
- 5.1.1. Inward Fold
- 5.1.2. Outward Fold
- 5.2. Market Analysis, Insights and Forecast - by Geography
- 5.2.1. Americas
- 5.2.2. EMEA
- 5.2.3. Asia Pacific
- 5.3. Market Analysis, Insights and Forecast - by Region
- 5.3.1. North America
- 5.3.2. Europe
- 5.3.3. Asia Pacific
- 5.3.4. South America
- 5.3.5. MEA
- 5.1. Market Analysis, Insights and Forecast - by Functionality Types
- 6. North America Foldable Smartphones Industry Analysis, Insights and Forecast, 2019-2031
- 6.1. Market Analysis, Insights and Forecast - by Functionality Types
- 6.1.1. Inward Fold
- 6.1.2. Outward Fold
- 6.2. Market Analysis, Insights and Forecast - by Geography
- 6.2.1. Americas
- 6.2.2. EMEA
- 6.2.3. Asia Pacific
- 6.1. Market Analysis, Insights and Forecast - by Functionality Types
- 7. Europe Foldable Smartphones Industry Analysis, Insights and Forecast, 2019-2031
- 7.1. Market Analysis, Insights and Forecast - by Functionality Types
- 7.1.1. Inward Fold
- 7.1.2. Outward Fold
- 7.2. Market Analysis, Insights and Forecast - by Geography
- 7.2.1. Americas
- 7.2.2. EMEA
- 7.2.3. Asia Pacific
- 7.1. Market Analysis, Insights and Forecast - by Functionality Types
- 8. Asia Pacific Foldable Smartphones Industry Analysis, Insights and Forecast, 2019-2031
- 8.1. Market Analysis, Insights and Forecast - by Functionality Types
- 8.1.1. Inward Fold
- 8.1.2. Outward Fold
- 8.2. Market Analysis, Insights and Forecast - by Geography
- 8.2.1. Americas
- 8.2.2. EMEA
- 8.2.3. Asia Pacific
- 8.1. Market Analysis, Insights and Forecast - by Functionality Types
- 9. South America Foldable Smartphones Industry Analysis, Insights and Forecast, 2019-2031
- 9.1. Market Analysis, Insights and Forecast - by Functionality Types
- 9.1.1. Inward Fold
- 9.1.2. Outward Fold
- 9.2. Market Analysis, Insights and Forecast - by Geography
- 9.2.1. Americas
- 9.2.2. EMEA
- 9.2.3. Asia Pacific
- 9.1. Market Analysis, Insights and Forecast - by Functionality Types
- 10. MEA Foldable Smartphones Industry Analysis, Insights and Forecast, 2019-2031
- 10.1. Market Analysis, Insights and Forecast - by Functionality Types
- 10.1.1. Inward Fold
- 10.1.2. Outward Fold
- 10.2. Market Analysis, Insights and Forecast - by Geography
- 10.2.1. Americas
- 10.2.2. EMEA
- 10.2.3. Asia Pacific
- 10.1. Market Analysis, Insights and Forecast - by Functionality Types
- 11. Americas Foldable Smartphones Industry Analysis, Insights and Forecast, 2019-2031
- 11.1. Market Analysis, Insights and Forecast - By Country/Sub-region
- 11.1.1.
- 12. EMEA Foldable Smartphones Industry Analysis, Insights and Forecast, 2019-2031
- 12.1. Market Analysis, Insights and Forecast - By Country/Sub-region
- 12.1.1.
- 13. Asia Pacific Foldable Smartphones Industry Analysis, Insights and Forecast, 2019-2031
- 13.1. Market Analysis, Insights and Forecast - By Country/Sub-region
- 13.1.1.
- 14. Competitive Analysis
- 14.1. Global Market Share Analysis 2024
- 14.2. Company Profiles
- 14.2.1 Xiaomi Corp
- 14.2.1.1. Overview
- 14.2.1.2. Products
- 14.2.1.3. SWOT Analysis
- 14.2.1.4. Recent Developments
- 14.2.1.5. Financials (Based on Availability)
- 14.2.2 Samsung Electronics Co Ltd
- 14.2.2.1. Overview
- 14.2.2.2. Products
- 14.2.2.3. SWOT Analysis
- 14.2.2.4. Recent Developments
- 14.2.2.5. Financials (Based on Availability)
- 14.2.3 Emerging Vendors
- 14.2.3.1. Overview
- 14.2.3.2. Products
- 14.2.3.3. SWOT Analysis
- 14.2.3.4. Recent Developments
- 14.2.3.5. Financials (Based on Availability)
- 14.2.4 Microsoft Corp
- 14.2.4.1. Overview
- 14.2.4.2. Products
- 14.2.4.3. SWOT Analysis
- 14.2.4.4. Recent Developments
- 14.2.4.5. Financials (Based on Availability)
- 14.2.5 TCL Corp
- 14.2.5.1. Overview
- 14.2.5.2. Products
- 14.2.5.3. SWOT Analysis
- 14.2.5.4. Recent Developments
- 14.2.5.5. Financials (Based on Availability)
- 14.2.6 Lenovo Group Ltd
- 14.2.6.1. Overview
- 14.2.6.2. Products
- 14.2.6.3. SWOT Analysis
- 14.2.6.4. Recent Developments
- 14.2.6.5. Financials (Based on Availability)
- 14.2.7 LG Electronics Inc
- 14.2.7.1. Overview
- 14.2.7.2. Products
- 14.2.7.3. SWOT Analysis
- 14.2.7.4. Recent Developments
- 14.2.7.5. Financials (Based on Availability)
- 14.2.8 Sony Corp
- 14.2.8.1. Overview
- 14.2.8.2. Products
- 14.2.8.3. SWOT Analysis
- 14.2.8.4. Recent Developments
- 14.2.8.5. Financials (Based on Availability)
- 14.2.9 Apple Inc
- 14.2.9.1. Overview
- 14.2.9.2. Products
- 14.2.9.3. SWOT Analysis
- 14.2.9.4. Recent Developments
- 14.2.9.5. Financials (Based on Availability)
- 14.2.10 Motorola Mobility LLC (Lenovo Group Limited)
- 14.2.10.1. Overview
- 14.2.10.2. Products
- 14.2.10.3. SWOT Analysis
- 14.2.10.4. Recent Developments
- 14.2.10.5. Financials (Based on Availability)
- 14.2.11 Commercialised Vendors (Market Ready)
- 14.2.11.1. Overview
- 14.2.11.2. Products
- 14.2.11.3. SWOT Analysis
- 14.2.11.4. Recent Developments
- 14.2.11.5. Financials (Based on Availability)
- 14.2.12 Royole Corp
- 14.2.12.1. Overview
- 14.2.12.2. Products
- 14.2.12.3. SWOT Analysis
- 14.2.12.4. Recent Developments
- 14.2.12.5. Financials (Based on Availability)
- 14.2.13 Huawei Technologies Co Ltd
- 14.2.13.1. Overview
- 14.2.13.2. Products
- 14.2.13.3. SWOT Analysis
- 14.2.13.4. Recent Developments
- 14.2.13.5. Financials (Based on Availability)
- 14.2.14 Energizer Holdings Inc
- 14.2.14.1. Overview
- 14.2.14.2. Products
- 14.2.14.3. SWOT Analysis
- 14.2.14.4. Recent Developments
- 14.2.14.5. Financials (Based on Availability)
- 14.2.15 ZTE Corporation
- 14.2.15.1. Overview
- 14.2.15.2. Products
- 14.2.15.3. SWOT Analysis
- 14.2.15.4. Recent Developments
- 14.2.15.5. Financials (Based on Availability)
- 14.2.1 Xiaomi Corp
List of Figures
- Figure 1: Global Foldable Smartphones Industry Revenue Breakdown (Million, %) by Region 2024 & 2032
- Figure 2: Global Foldable Smartphones Industry Volume Breakdown (K Unit, %) by Region 2024 & 2032
- Figure 3: Americas Foldable Smartphones Industry Revenue (Million), by Country 2024 & 2032
- Figure 4: Americas Foldable Smartphones Industry Volume (K Unit), by Country 2024 & 2032
- Figure 5: Americas Foldable Smartphones Industry Revenue Share (%), by Country 2024 & 2032
- Figure 6: Americas Foldable Smartphones Industry Volume Share (%), by Country 2024 & 2032
- Figure 7: EMEA Foldable Smartphones Industry Revenue (Million), by Country 2024 & 2032
- Figure 8: EMEA Foldable Smartphones Industry Volume (K Unit), by Country 2024 & 2032
- Figure 9: EMEA Foldable Smartphones Industry Revenue Share (%), by Country 2024 & 2032
- Figure 10: EMEA Foldable Smartphones Industry Volume Share (%), by Country 2024 & 2032
- Figure 11: Asia Pacific Foldable Smartphones Industry Revenue (Million), by Country 2024 & 2032
- Figure 12: Asia Pacific Foldable Smartphones Industry Volume (K Unit), by Country 2024 & 2032
- Figure 13: Asia Pacific Foldable Smartphones Industry Revenue Share (%), by Country 2024 & 2032
- Figure 14: Asia Pacific Foldable Smartphones Industry Volume Share (%), by Country 2024 & 2032
- Figure 15: North America Foldable Smartphones Industry Revenue (Million), by Functionality Types 2024 & 2032
- Figure 16: North America Foldable Smartphones Industry Volume (K Unit), by Functionality Types 2024 & 2032
- Figure 17: North America Foldable Smartphones Industry Revenue Share (%), by Functionality Types 2024 & 2032
- Figure 18: North America Foldable Smartphones Industry Volume Share (%), by Functionality Types 2024 & 2032
- Figure 19: North America Foldable Smartphones Industry Revenue (Million), by Geography 2024 & 2032
- Figure 20: North America Foldable Smartphones Industry Volume (K Unit), by Geography 2024 & 2032
- Figure 21: North America Foldable Smartphones Industry Revenue Share (%), by Geography 2024 & 2032
- Figure 22: North America Foldable Smartphones Industry Volume Share (%), by Geography 2024 & 2032
- Figure 23: North America Foldable Smartphones Industry Revenue (Million), by Country 2024 & 2032
- Figure 24: North America Foldable Smartphones Industry Volume (K Unit), by Country 2024 & 2032
- Figure 25: North America Foldable Smartphones Industry Revenue Share (%), by Country 2024 & 2032
- Figure 26: North America Foldable Smartphones Industry Volume Share (%), by Country 2024 & 2032
- Figure 27: Europe Foldable Smartphones Industry Revenue (Million), by Functionality Types 2024 & 2032
- Figure 28: Europe Foldable Smartphones Industry Volume (K Unit), by Functionality Types 2024 & 2032
- Figure 29: Europe Foldable Smartphones Industry Revenue Share (%), by Functionality Types 2024 & 2032
- Figure 30: Europe Foldable Smartphones Industry Volume Share (%), by Functionality Types 2024 & 2032
- Figure 31: Europe Foldable Smartphones Industry Revenue (Million), by Geography 2024 & 2032
- Figure 32: Europe Foldable Smartphones Industry Volume (K Unit), by Geography 2024 & 2032
- Figure 33: Europe Foldable Smartphones Industry Revenue Share (%), by Geography 2024 & 2032
- Figure 34: Europe Foldable Smartphones Industry Volume Share (%), by Geography 2024 & 2032
- Figure 35: Europe Foldable Smartphones Industry Revenue (Million), by Country 2024 & 2032
- Figure 36: Europe Foldable Smartphones Industry Volume (K Unit), by Country 2024 & 2032
- Figure 37: Europe Foldable Smartphones Industry Revenue Share (%), by Country 2024 & 2032
- Figure 38: Europe Foldable Smartphones Industry Volume Share (%), by Country 2024 & 2032
- Figure 39: Asia Pacific Foldable Smartphones Industry Revenue (Million), by Functionality Types 2024 & 2032
- Figure 40: Asia Pacific Foldable Smartphones Industry Volume (K Unit), by Functionality Types 2024 & 2032
- Figure 41: Asia Pacific Foldable Smartphones Industry Revenue Share (%), by Functionality Types 2024 & 2032
- Figure 42: Asia Pacific Foldable Smartphones Industry Volume Share (%), by Functionality Types 2024 & 2032
- Figure 43: Asia Pacific Foldable Smartphones Industry Revenue (Million), by Geography 2024 & 2032
- Figure 44: Asia Pacific Foldable Smartphones Industry Volume (K Unit), by Geography 2024 & 2032
- Figure 45: Asia Pacific Foldable Smartphones Industry Revenue Share (%), by Geography 2024 & 2032
- Figure 46: Asia Pacific Foldable Smartphones Industry Volume Share (%), by Geography 2024 & 2032
- Figure 47: Asia Pacific Foldable Smartphones Industry Revenue (Million), by Country 2024 & 2032
- Figure 48: Asia Pacific Foldable Smartphones Industry Volume (K Unit), by Country 2024 & 2032
- Figure 49: Asia Pacific Foldable Smartphones Industry Revenue Share (%), by Country 2024 & 2032
- Figure 50: Asia Pacific Foldable Smartphones Industry Volume Share (%), by Country 2024 & 2032
- Figure 51: South America Foldable Smartphones Industry Revenue (Million), by Functionality Types 2024 & 2032
- Figure 52: South America Foldable Smartphones Industry Volume (K Unit), by Functionality Types 2024 & 2032
- Figure 53: South America Foldable Smartphones Industry Revenue Share (%), by Functionality Types 2024 & 2032
- Figure 54: South America Foldable Smartphones Industry Volume Share (%), by Functionality Types 2024 & 2032
- Figure 55: South America Foldable Smartphones Industry Revenue (Million), by Geography 2024 & 2032
- Figure 56: South America Foldable Smartphones Industry Volume (K Unit), by Geography 2024 & 2032
- Figure 57: South America Foldable Smartphones Industry Revenue Share (%), by Geography 2024 & 2032
- Figure 58: South America Foldable Smartphones Industry Volume Share (%), by Geography 2024 & 2032
- Figure 59: South America Foldable Smartphones Industry Revenue (Million), by Country 2024 & 2032
- Figure 60: South America Foldable Smartphones Industry Volume (K Unit), by Country 2024 & 2032
- Figure 61: South America Foldable Smartphones Industry Revenue Share (%), by Country 2024 & 2032
- Figure 62: South America Foldable Smartphones Industry Volume Share (%), by Country 2024 & 2032
- Figure 63: MEA Foldable Smartphones Industry Revenue (Million), by Functionality Types 2024 & 2032
- Figure 64: MEA Foldable Smartphones Industry Volume (K Unit), by Functionality Types 2024 & 2032
- Figure 65: MEA Foldable Smartphones Industry Revenue Share (%), by Functionality Types 2024 & 2032
- Figure 66: MEA Foldable Smartphones Industry Volume Share (%), by Functionality Types 2024 & 2032
- Figure 67: MEA Foldable Smartphones Industry Revenue (Million), by Geography 2024 & 2032
- Figure 68: MEA Foldable Smartphones Industry Volume (K Unit), by Geography 2024 & 2032
- Figure 69: MEA Foldable Smartphones Industry Revenue Share (%), by Geography 2024 & 2032
- Figure 70: MEA Foldable Smartphones Industry Volume Share (%), by Geography 2024 & 2032
- Figure 71: MEA Foldable Smartphones Industry Revenue (Million), by Country 2024 & 2032
- Figure 72: MEA Foldable Smartphones Industry Volume (K Unit), by Country 2024 & 2032
- Figure 73: MEA Foldable Smartphones Industry Revenue Share (%), by Country 2024 & 2032
- Figure 74: MEA Foldable Smartphones Industry Volume Share (%), by Country 2024 & 2032
List of Tables
- Table 1: Global Foldable Smartphones Industry Revenue Million Forecast, by Region 2019 & 2032
- Table 2: Global Foldable Smartphones Industry Volume K Unit Forecast, by Region 2019 & 2032
- Table 3: Global Foldable Smartphones Industry Revenue Million Forecast, by Functionality Types 2019 & 2032
- Table 4: Global Foldable Smartphones Industry Volume K Unit Forecast, by Functionality Types 2019 & 2032
- Table 5: Global Foldable Smartphones Industry Revenue Million Forecast, by Geography 2019 & 2032
- Table 6: Global Foldable Smartphones Industry Volume K Unit Forecast, by Geography 2019 & 2032
- Table 7: Global Foldable Smartphones Industry Revenue Million Forecast, by Region 2019 & 2032
- Table 8: Global Foldable Smartphones Industry Volume K Unit Forecast, by Region 2019 & 2032
- Table 9: Global Foldable Smartphones Industry Revenue Million Forecast, by Country 2019 & 2032
- Table 10: Global Foldable Smartphones Industry Volume K Unit Forecast, by Country 2019 & 2032
- Table 11: Foldable Smartphones Industry Revenue (Million) Forecast, by Application 2019 & 2032
- Table 12: Foldable Smartphones Industry Volume (K Unit) Forecast, by Application 2019 & 2032
- Table 13: Global Foldable Smartphones Industry Revenue Million Forecast, by Country 2019 & 2032
- Table 14: Global Foldable Smartphones Industry Volume K Unit Forecast, by Country 2019 & 2032
- Table 15: Foldable Smartphones Industry Revenue (Million) Forecast, by Application 2019 & 2032
- Table 16: Foldable Smartphones Industry Volume (K Unit) Forecast, by Application 2019 & 2032
- Table 17: Global Foldable Smartphones Industry Revenue Million Forecast, by Country 2019 & 2032
- Table 18: Global Foldable Smartphones Industry Volume K Unit Forecast, by Country 2019 & 2032
- Table 19: Foldable Smartphones Industry Revenue (Million) Forecast, by Application 2019 & 2032
- Table 20: Foldable Smartphones Industry Volume (K Unit) Forecast, by Application 2019 & 2032
- Table 21: Global Foldable Smartphones Industry Revenue Million Forecast, by Functionality Types 2019 & 2032
- Table 22: Global Foldable Smartphones Industry Volume K Unit Forecast, by Functionality Types 2019 & 2032
- Table 23: Global Foldable Smartphones Industry Revenue Million Forecast, by Geography 2019 & 2032
- Table 24: Global Foldable Smartphones Industry Volume K Unit Forecast, by Geography 2019 & 2032
- Table 25: Global Foldable Smartphones Industry Revenue Million Forecast, by Country 2019 & 2032
- Table 26: Global Foldable Smartphones Industry Volume K Unit Forecast, by Country 2019 & 2032
- Table 27: United States Foldable Smartphones Industry Revenue (Million) Forecast, by Application 2019 & 2032
- Table 28: United States Foldable Smartphones Industry Volume (K Unit) Forecast, by Application 2019 & 2032
- Table 29: Canada Foldable Smartphones Industry Revenue (Million) Forecast, by Application 2019 & 2032
- Table 30: Canada Foldable Smartphones Industry Volume (K Unit) Forecast, by Application 2019 & 2032
- Table 31: Mexico Foldable Smartphones Industry Revenue (Million) Forecast, by Application 2019 & 2032
- Table 32: Mexico Foldable Smartphones Industry Volume (K Unit) Forecast, by Application 2019 & 2032
- Table 33: Global Foldable Smartphones Industry Revenue Million Forecast, by Functionality Types 2019 & 2032
- Table 34: Global Foldable Smartphones Industry Volume K Unit Forecast, by Functionality Types 2019 & 2032
- Table 35: Global Foldable Smartphones Industry Revenue Million Forecast, by Geography 2019 & 2032
- Table 36: Global Foldable Smartphones Industry Volume K Unit Forecast, by Geography 2019 & 2032
- Table 37: Global Foldable Smartphones Industry Revenue Million Forecast, by Country 2019 & 2032
- Table 38: Global Foldable Smartphones Industry Volume K Unit Forecast, by Country 2019 & 2032
- Table 39: Germany Foldable Smartphones Industry Revenue (Million) Forecast, by Application 2019 & 2032
- Table 40: Germany Foldable Smartphones Industry Volume (K Unit) Forecast, by Application 2019 & 2032
- Table 41: United Kingdom Foldable Smartphones Industry Revenue (Million) Forecast, by Application 2019 & 2032
- Table 42: United Kingdom Foldable Smartphones Industry Volume (K Unit) Forecast, by Application 2019 & 2032
- Table 43: France Foldable Smartphones Industry Revenue (Million) Forecast, by Application 2019 & 2032
- Table 44: France Foldable Smartphones Industry Volume (K Unit) Forecast, by Application 2019 & 2032
- Table 45: Italy Foldable Smartphones Industry Revenue (Million) Forecast, by Application 2019 & 2032
- Table 46: Italy Foldable Smartphones Industry Volume (K Unit) Forecast, by Application 2019 & 2032
- Table 47: Spain Foldable Smartphones Industry Revenue (Million) Forecast, by Application 2019 & 2032
- Table 48: Spain Foldable Smartphones Industry Volume (K Unit) Forecast, by Application 2019 & 2032
- Table 49: Rest of Europe Foldable Smartphones Industry Revenue (Million) Forecast, by Application 2019 & 2032
- Table 50: Rest of Europe Foldable Smartphones Industry Volume (K Unit) Forecast, by Application 2019 & 2032
- Table 51: Global Foldable Smartphones Industry Revenue Million Forecast, by Functionality Types 2019 & 2032
- Table 52: Global Foldable Smartphones Industry Volume K Unit Forecast, by Functionality Types 2019 & 2032
- Table 53: Global Foldable Smartphones Industry Revenue Million Forecast, by Geography 2019 & 2032
- Table 54: Global Foldable Smartphones Industry Volume K Unit Forecast, by Geography 2019 & 2032
- Table 55: Global Foldable Smartphones Industry Revenue Million Forecast, by Country 2019 & 2032
- Table 56: Global Foldable Smartphones Industry Volume K Unit Forecast, by Country 2019 & 2032
- Table 57: China Foldable Smartphones Industry Revenue (Million) Forecast, by Application 2019 & 2032
- Table 58: China Foldable Smartphones Industry Volume (K Unit) Forecast, by Application 2019 & 2032
- Table 59: Japan Foldable Smartphones Industry Revenue (Million) Forecast, by Application 2019 & 2032
- Table 60: Japan Foldable Smartphones Industry Volume (K Unit) Forecast, by Application 2019 & 2032
- Table 61: India Foldable Smartphones Industry Revenue (Million) Forecast, by Application 2019 & 2032
- Table 62: India Foldable Smartphones Industry Volume (K Unit) Forecast, by Application 2019 & 2032
- Table 63: Australia Foldable Smartphones Industry Revenue (Million) Forecast, by Application 2019 & 2032
- Table 64: Australia Foldable Smartphones Industry Volume (K Unit) Forecast, by Application 2019 & 2032
- Table 65: South Korea Foldable Smartphones Industry Revenue (Million) Forecast, by Application 2019 & 2032
- Table 66: South Korea Foldable Smartphones Industry Volume (K Unit) Forecast, by Application 2019 & 2032
- Table 67: Rest of Asia Pacific Foldable Smartphones Industry Revenue (Million) Forecast, by Application 2019 & 2032
- Table 68: Rest of Asia Pacific Foldable Smartphones Industry Volume (K Unit) Forecast, by Application 2019 & 2032
- Table 69: Global Foldable Smartphones Industry Revenue Million Forecast, by Functionality Types 2019 & 2032
- Table 70: Global Foldable Smartphones Industry Volume K Unit Forecast, by Functionality Types 2019 & 2032
- Table 71: Global Foldable Smartphones Industry Revenue Million Forecast, by Geography 2019 & 2032
- Table 72: Global Foldable Smartphones Industry Volume K Unit Forecast, by Geography 2019 & 2032
- Table 73: Global Foldable Smartphones Industry Revenue Million Forecast, by Country 2019 & 2032
- Table 74: Global Foldable Smartphones Industry Volume K Unit Forecast, by Country 2019 & 2032
- Table 75: Brazil Foldable Smartphones Industry Revenue (Million) Forecast, by Application 2019 & 2032
- Table 76: Brazil Foldable Smartphones Industry Volume (K Unit) Forecast, by Application 2019 & 2032
- Table 77: Argentina Foldable Smartphones Industry Revenue (Million) Forecast, by Application 2019 & 2032
- Table 78: Argentina Foldable Smartphones Industry Volume (K Unit) Forecast, by Application 2019 & 2032
- Table 79: Rest of South America Foldable Smartphones Industry Revenue (Million) Forecast, by Application 2019 & 2032
- Table 80: Rest of South America Foldable Smartphones Industry Volume (K Unit) Forecast, by Application 2019 & 2032
- Table 81: Global Foldable Smartphones Industry Revenue Million Forecast, by Functionality Types 2019 & 2032
- Table 82: Global Foldable Smartphones Industry Volume K Unit Forecast, by Functionality Types 2019 & 2032
- Table 83: Global Foldable Smartphones Industry Revenue Million Forecast, by Geography 2019 & 2032
- Table 84: Global Foldable Smartphones Industry Volume K Unit Forecast, by Geography 2019 & 2032
- Table 85: Global Foldable Smartphones Industry Revenue Million Forecast, by Country 2019 & 2032
- Table 86: Global Foldable Smartphones Industry Volume K Unit Forecast, by Country 2019 & 2032
- Table 87: UAE Foldable Smartphones Industry Revenue (Million) Forecast, by Application 2019 & 2032
- Table 88: UAE Foldable Smartphones Industry Volume (K Unit) Forecast, by Application 2019 & 2032
- Table 89: South Africa Foldable Smartphones Industry Revenue (Million) Forecast, by Application 2019 & 2032
- Table 90: South Africa Foldable Smartphones Industry Volume (K Unit) Forecast, by Application 2019 & 2032
- Table 91: Saudi Arabia Foldable Smartphones Industry Revenue (Million) Forecast, by Application 2019 & 2032
- Table 92: Saudi Arabia Foldable Smartphones Industry Volume (K Unit) Forecast, by Application 2019 & 2032
- Table 93: Rest Of MEA Foldable Smartphones Industry Revenue (Million) Forecast, by Application 2019 & 2032
- Table 94: Rest Of MEA Foldable Smartphones Industry Volume (K Unit) Forecast, by Application 2019 & 2032
Frequently Asked Questions
1. What is the projected Compound Annual Growth Rate (CAGR) of the Foldable Smartphones Industry?
The projected CAGR is approximately 17.13%.
2. Which companies are prominent players in the Foldable Smartphones Industry?
Key companies in the market include Xiaomi Corp, Samsung Electronics Co Ltd, Emerging Vendors, Microsoft Corp, TCL Corp, Lenovo Group Ltd, LG Electronics Inc, Sony Corp, Apple Inc, Motorola Mobility LLC (Lenovo Group Limited), Commercialised Vendors (Market Ready), Royole Corp, Huawei Technologies Co Ltd, Energizer Holdings Inc, ZTE Corporation.
3. What are the main segments of the Foldable Smartphones Industry?
The market segments include Functionality Types, Geography.
4. Can you provide details about the market size?
The market size is estimated to be USD 28.72 Million as of 2022.
5. What are some drivers contributing to market growth?
Miniaturization of the Display Technology Products; Growing Demand of Multi-Screen Smartphone.
6. What are the notable trends driving market growth?
Growing Demand of Multi-Screen Smartphone.
7. Are there any restraints impacting market growth?
Complexity in the Manufacturing Process with Countable Number of Folds; Huge Price Tags with Products from Prominent Vendors.
8. Can you provide examples of recent developments in the market?
August 2022: Samsung Electronics unveiled its most recent line of premium foldable smartphones. The Galaxy Z Flip4 clamshell smartphone is priced at USD 999.99, while the top-tier Galaxy Z Fold4 with 5G support has a 7.6-inch central screen and starts at USD 1,799.99.
9. What pricing options are available for accessing the report?
Pricing options include single-user, multi-user, and enterprise licenses priced at USD 4750, USD 5250, and USD 8750 respectively.
10. Is the market size provided in terms of value or volume?
The market size is provided in terms of value, measured in Million and volume, measured in K Unit.
11. Are there any specific market keywords associated with the report?
Yes, the market keyword associated with the report is "Foldable Smartphones Industry," which aids in identifying and referencing the specific market segment covered.
12. How do I determine which pricing option suits my needs best?
The pricing options vary based on user requirements and access needs. Individual users may opt for single-user licenses, while businesses requiring broader access may choose multi-user or enterprise licenses for cost-effective access to the report.
13. Are there any additional resources or data provided in the Foldable Smartphones Industry report?
While the report offers comprehensive insights, it's advisable to review the specific contents or supplementary materials provided to ascertain if additional resources or data are available.
14. How can I stay updated on further developments or reports in the Foldable Smartphones Industry?
To stay informed about further developments, trends, and reports in the Foldable Smartphones Industry, consider subscribing to industry newsletters, following relevant companies and organizations, or regularly checking reputable industry news sources and publications.
Methodology
Step 1 - Identification of Relevant Samples Size from Population Database


Step 2 - Approaches for Defining Global Market Size (Value, Volume* & Price*)

Note*: In applicable scenarios
Step 3 - Data Sources
Primary Research
- Web Analytics
- Survey Reports
- Research Institute
- Latest Research Reports
- Opinion Leaders
Secondary Research
- Annual Reports
- White Paper
- Latest Press Release
- Industry Association
- Paid Database
- Investor Presentations

Step 4 - Data Triangulation
Involves using different sources of information in order to increase the validity of a study
These sources are likely to be stakeholders in a program - participants, other researchers, program staff, other community members, and so on.
Then we put all data in single framework & apply various statistical tools to find out the dynamic on the market.
During the analysis stage, feedback from the stakeholder groups would be compared to determine areas of agreement as well as areas of divergence


