
Key Insights
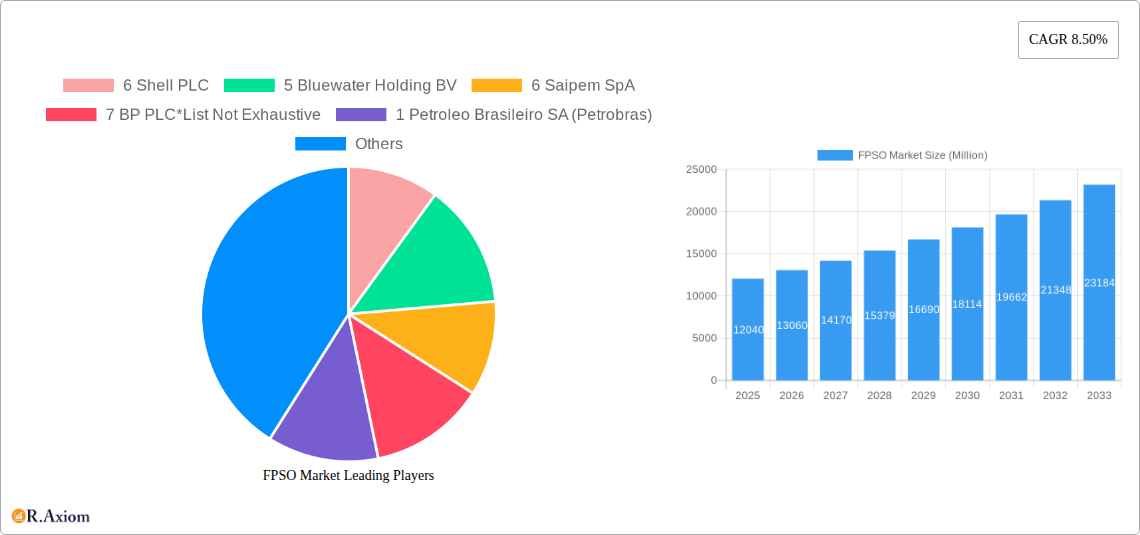
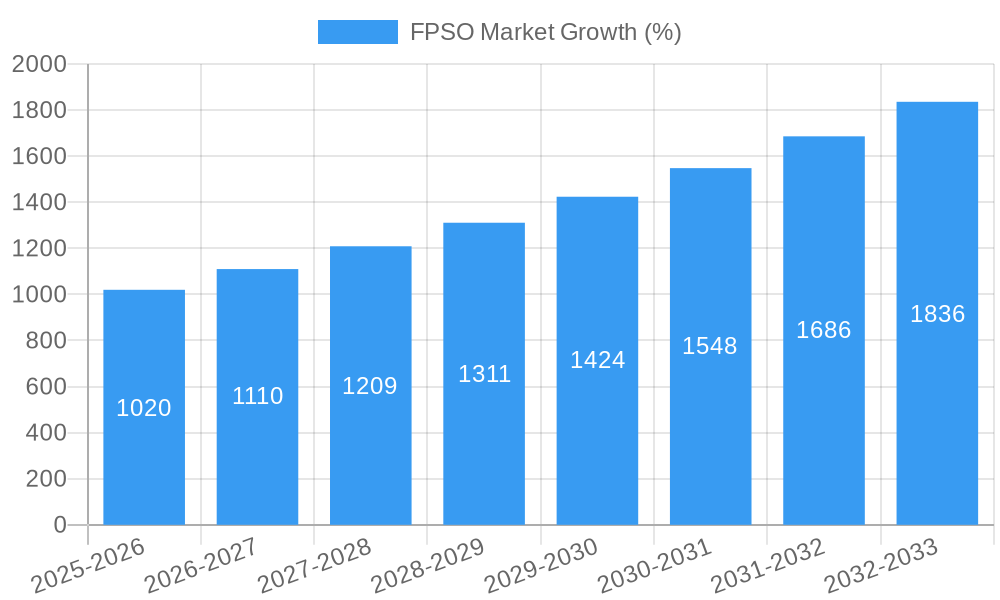
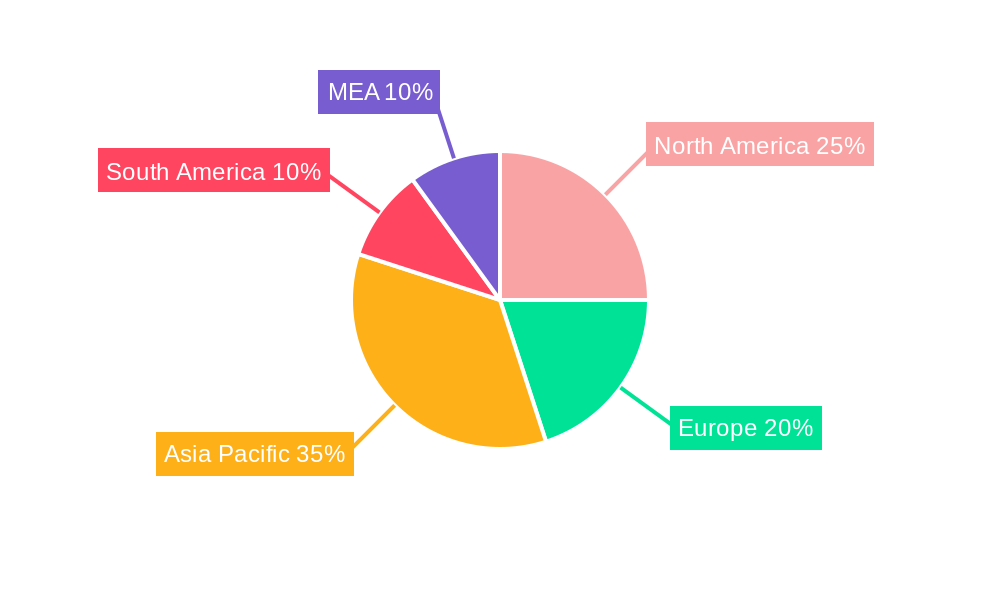
The Floating Production Storage and Offloading (FPSO) market, valued at $12.04 billion in 2025, is projected to experience robust growth, driven by increasing offshore oil and gas exploration and production activities, particularly in deepwater environments. The market's Compound Annual Growth Rate (CAGR) of 8.50% from 2025 to 2033 signifies a significant expansion, fueled by the rising demand for energy and technological advancements in FPSO design and construction. Key growth drivers include the exploration of previously inaccessible deepwater reserves, the need for efficient production solutions in challenging environments, and ongoing investments in the energy sector. Market segmentation reveals a significant portion dedicated to deepwater and ultra-deepwater operations, reflecting the industry shift towards more complex and technologically advanced projects. Operator-owned FPSOs currently dominate the market share, although contractor-owned models are gradually gaining traction due to their cost-effectiveness and flexibility. Geographical analysis indicates strong growth potential in regions like Asia-Pacific, driven by expanding energy needs and prolific offshore oil and gas discoveries, especially in countries like China, India, and Southeast Asia. North America and Europe also represent significant markets, driven by existing infrastructure and established energy companies. However, factors like fluctuating oil prices, environmental regulations, and the increasing costs associated with deepwater operations present challenges to sustained growth. The competitive landscape is characterized by a mix of major international oil companies and specialized FPSO contractors, suggesting a dynamic market with both established players and emerging contenders vying for market share.
The continued expansion of the FPSO market hinges on several factors. Sustained investment in offshore exploration and production, technological innovations enhancing FPSO efficiency and operational capabilities, and a strategic focus on sustainability will be crucial for future growth. Addressing the challenges related to volatile oil prices, stringent environmental regulations, and high operational costs will be imperative for market players. Growth opportunities are projected in developing new technologies such as advanced subsea systems and improved energy efficiency measures to reduce environmental impact and increase operational profitability. Furthermore, collaborative partnerships and mergers & acquisitions amongst market players are expected to contribute to industry consolidation and further growth of the FPSO market over the forecast period. The adoption of advanced analytics and digitalization technologies to enhance operational efficiency and reduce downtime will also be pivotal in boosting market growth in the coming years.
FPSO Market: A Comprehensive Report (2019-2033)
This in-depth report provides a comprehensive analysis of the FPSO (Floating Production, Storage, and Offloading) market, offering invaluable insights for industry stakeholders, investors, and strategic decision-makers. The report covers the period from 2019 to 2033, with a focus on the base year 2025 and a forecast period extending to 2033. It analyzes market dynamics, key players, technological advancements, and future growth prospects, providing a clear picture of the current landscape and future trajectory of the FPSO market. The market size is projected to reach xx Million by 2033.
FPSO Market Concentration & Innovation
The FPSO market exhibits a moderately concentrated structure, with a few major players holding significant market share. While precise market share figures fluctuate, companies like SBM Offshore NV, Modec Inc, and others consistently demonstrate substantial presence. Innovation is driven by the need for increased efficiency, cost reduction, and the ability to operate in ever-deeper and more challenging waters.
- Market Concentration: The top 5 players account for approximately xx% of the global market share in 2025 (estimated).
- Innovation Drivers: Technological advancements in subsea systems, improved FPSO designs (e.g., increased capacity, enhanced processing capabilities), and digitalization initiatives are key drivers.
- Regulatory Framework: Stringent environmental regulations and safety standards impact design and operational aspects. Variations in regulatory frameworks across different regions create unique opportunities and challenges.
- Product Substitutes: While FPSOs currently dominate deepwater production, alternative technologies are constantly evolving. However, FPSOs continue to hold an advantage due to their versatility and scalability.
- End-User Trends: The increasing demand for offshore oil and gas resources from deepwater fields fuels growth in the FPSO market. A shift towards cleaner energy sources is a potential long-term headwind, although the transition is expected to be gradual.
- M&A Activities: The FPSO sector has witnessed significant M&A activity in recent years, with deal values reaching several billion USD annually. These mergers and acquisitions reflect consolidation efforts and strategic expansion into new markets or technologies. For example, the xx Million KBR contract for Equinor's Bay du Nord project showcases this.
FPSO Market Industry Trends & Insights
The global FPSO market is witnessing robust growth, driven by several key factors. Exploration and production activities in deepwater and ultra-deepwater fields are a primary driver. Technological innovations enabling operations in more challenging environments and the increasing demand for offshore energy resources further boost market expansion. The market is also experiencing technological disruptions, with digitalization and automation significantly impacting operational efficiency and reducing costs. Competitive dynamics are characterized by intense rivalry among major players, focusing on securing contracts, expanding geographically, and technological differentiation.
The market is expected to register a CAGR of xx% during the forecast period (2025-2033). Market penetration in deepwater regions is expected to reach xx% by 2033. The significant investments in new FPSO projects indicate a high level of confidence in the future of this technology.
Dominant Markets & Segments in FPSO Market
Deepwater and ultra-deepwater segments dominate the FPSO market, driven by the increasing exploration and production activities in these challenging environments.
Dominant Regions/Countries: Brazil, West Africa (e.g., Guyana, Nigeria), and Southeast Asia represent key markets owing to significant deepwater reserves and ongoing projects.
Water Depth Segments:
- Deepwater: This segment dominates due to the substantial number of deepwater oil and gas reserves globally.
- Ultra-deepwater: Rapid technological advances are making ultra-deepwater projects increasingly feasible, driving growth in this segment.
- Shallow Water: This segment experiences relatively slower growth due to the limited scope of offshore projects compared to deep and ultra-deepwater.
Ownership Segments:
- Operator-owned: Many major oil and gas companies directly own and operate FPSOs, which increases the demand in this segment.
- Contractor-owned: This segment offers flexibility to operators, allowing them to outsource the ownership and management of FPSOs, reducing capital expenditure.
Key drivers for this dominance include favorable government policies, substantial investments in infrastructure, and the presence of major oil and gas companies.
FPSO Market Product Developments
Recent advancements in FPSO technology have focused on enhancing efficiency, optimizing operational costs, and improving environmental performance. Innovations such as advanced subsea processing systems, improved hull designs for stability in harsh environments, and the integration of automation and digitalization tools have greatly increased the appeal and capabilities of FPSOs. These enhancements cater to the needs of both existing and emerging markets, ensuring the continued relevance of FPSOs in offshore oil and gas production.
Report Scope & Segmentation Analysis
This report provides a granular segmentation analysis of the FPSO market across various parameters:
- Water Depth: Shallow Water, Deep Water, Ultra-deepwater, each segment analyzed for growth projections, market size, and competitive landscape.
- Ownership: Operator-owned, Contractor-owned, detailing the market dynamics and growth potential within each segment. Each segment’s market size, growth projections, and competitive landscape are detailed.
Key Drivers of FPSO Market Growth
The FPSO market's growth is propelled by several factors:
- Technological advancements: Innovations in subsea technologies, improved hull designs, and increased processing capacity allow for operation in deeper waters and harsher environments.
- Deepwater exploration: The discovery and development of substantial reserves in deep and ultra-deepwater locations is a major driver.
- Government policies and incentives: Many nations are implementing policies to encourage exploration and production in offshore areas.
Challenges in the FPSO Market Sector
The FPSO market faces challenges, including:
- High capital expenditure: The upfront costs associated with building and deploying FPSOs are substantial.
- Regulatory hurdles: Stringent environmental regulations and safety requirements can impact project timelines and costs.
- Supply chain complexities: The global nature of the supply chain can lead to delays and disruptions.
- Fluctuations in oil prices: Price volatility can affect investment decisions and project feasibility.
Emerging Opportunities in FPSO Market
Emerging opportunities include:
- Growth in deepwater exploration in new regions: Exploration in under-explored deepwater basins presents significant opportunities.
- Technological advancements in carbon capture and storage: Integrating carbon capture technology into FPSOs aligns with sustainability goals.
- Expansion into floating LNG (FLNG) facilities: The growth of the FLNG sector offers new avenues for FPSO technology.
Leading Players in the FPSO Market Market
- Shell PLC
- Bluewater Holding BV
- Saipem SpA
- BP PLC
- Petroleo Brasileiro SA (Petrobras)
- Teekay Offshore Partners LP
- Chevron Corporation
- TotalEnergies SE
- Petrofac Limited
- ExxonMobil Corp
- Modec Inc
- BW Offshore Limited
- SBM Offshore NV
- CNOOC Ltd
Key Developments in FPSO Market Industry
- May 2023: SBM Offshore and Esso Exploration & Production Guyana entered a 10-year Operations and Maintenance Enabling Agreement for four FPSOs: Liza Destiny, Liza Unity, Prosperity, and ONE GUYANA. This significantly strengthens SBM Offshore's position in the Guyanese market.
- April 2023: Shell resumed gas production at the Pierce field in the UK North Sea after upgrading the Haewene Brim FPSO. This demonstrates the adaptability and extended lifespan of FPSOs.
- April 2023: KBR secured a USD 9.4 Billion engineering contract for Equinor's Bay du Nord project in Canada. This highlights the significant investment in new FPSO projects.
Strategic Outlook for FPSO Market Market
The FPSO market is poised for continued growth, driven by ongoing deepwater exploration, technological advancements, and increasing demand for offshore energy resources. The industry's focus on sustainability and the integration of carbon capture technologies will be pivotal in shaping the future of the market. New market entrants and strategic partnerships will further fuel innovation and market expansion. The forecast period anticipates strong growth, particularly in deepwater and ultra-deepwater segments.
FPSO Market Segmentation
-
1. Ownership
- 1.1. Operator-owned
- 1.2. Contractor-owned
-
2. Water Depth
- 2.1. Shallow Water
- 2.2. Deep Water
- 2.3. Ultra-deep Water
FPSO Market Segmentation By Geography
-
1. North America
- 1.1. United States
- 1.2. Canada
- 1.3. Mexico
- 1.4. Rest of North America
-
2. Europe
- 2.1. Norway
- 2.2. United Kingdom
- 2.3. Russia
- 2.4. Netherland
- 2.5. France
- 2.6. Italy
- 2.7. NORDIC
- 2.8. Germany
- 2.9. Spain
- 2.10. Rest of Europe
-
3. Asia Pacific
- 3.1. China
- 3.2. India
- 3.3. Australia
- 3.4. Indonesia
- 3.5. Malaysia
- 3.6. Thailand
- 3.7. Japan
- 3.8. Vietnam
- 3.9. Rest of Asia Pacific
-
4. South America
- 4.1. Brazil
- 4.2. Argentina
- 4.3. Venezuela
- 4.4. Colombia
- 4.5. Rest of South America
-
5. Middle East and Africa
- 5.1. Saudi Arabia
- 5.2. United Arab Emirates
- 5.3. Nigeria
- 5.4. Algeria
- 5.5. Qatar
- 5.6. South Africa
- 5.7. Egypt
- 5.8. Rest of Middle East and Africa
FPSO Market REPORT HIGHLIGHTS
| Aspects | Details |
|---|---|
| Study Period | 2019-2033 |
| Base Year | 2024 |
| Estimated Year | 2025 |
| Forecast Period | 2025-2033 |
| Historical Period | 2019-2024 |
| Growth Rate | CAGR of 8.50% from 2019-2033 |
| Segmentation |
|
Table of Contents
- 1. Introduction
- 1.1. Research Scope
- 1.2. Market Segmentation
- 1.3. Research Methodology
- 1.4. Definitions and Assumptions
- 2. Executive Summary
- 2.1. Introduction
- 3. Market Dynamics
- 3.1. Introduction
- 3.2. Market Drivers
- 3.2.1. 4.; Increasing Offshore Oil and Gas Exploration and Production Activities4.; Growing Demand for Energy
- 3.3. Market Restrains
- 3.3.1. 4.; High Upfront Costs
- 3.4. Market Trends
- 3.4.1. Contractor-owned FPSO Expected to Dominate the Market
- 4. Market Factor Analysis
- 4.1. Porters Five Forces
- 4.2. Supply/Value Chain
- 4.3. PESTEL analysis
- 4.4. Market Entropy
- 4.5. Patent/Trademark Analysis
- 5. Global FPSO Market Analysis, Insights and Forecast, 2019-2031
- 5.1. Market Analysis, Insights and Forecast - by Ownership
- 5.1.1. Operator-owned
- 5.1.2. Contractor-owned
- 5.2. Market Analysis, Insights and Forecast - by Water Depth
- 5.2.1. Shallow Water
- 5.2.2. Deep Water
- 5.2.3. Ultra-deep Water
- 5.3. Market Analysis, Insights and Forecast - by Region
- 5.3.1. North America
- 5.3.2. Europe
- 5.3.3. Asia Pacific
- 5.3.4. South America
- 5.3.5. Middle East and Africa
- 5.1. Market Analysis, Insights and Forecast - by Ownership
- 6. North America FPSO Market Analysis, Insights and Forecast, 2019-2031
- 6.1. Market Analysis, Insights and Forecast - by Ownership
- 6.1.1. Operator-owned
- 6.1.2. Contractor-owned
- 6.2. Market Analysis, Insights and Forecast - by Water Depth
- 6.2.1. Shallow Water
- 6.2.2. Deep Water
- 6.2.3. Ultra-deep Water
- 6.1. Market Analysis, Insights and Forecast - by Ownership
- 7. Europe FPSO Market Analysis, Insights and Forecast, 2019-2031
- 7.1. Market Analysis, Insights and Forecast - by Ownership
- 7.1.1. Operator-owned
- 7.1.2. Contractor-owned
- 7.2. Market Analysis, Insights and Forecast - by Water Depth
- 7.2.1. Shallow Water
- 7.2.2. Deep Water
- 7.2.3. Ultra-deep Water
- 7.1. Market Analysis, Insights and Forecast - by Ownership
- 8. Asia Pacific FPSO Market Analysis, Insights and Forecast, 2019-2031
- 8.1. Market Analysis, Insights and Forecast - by Ownership
- 8.1.1. Operator-owned
- 8.1.2. Contractor-owned
- 8.2. Market Analysis, Insights and Forecast - by Water Depth
- 8.2.1. Shallow Water
- 8.2.2. Deep Water
- 8.2.3. Ultra-deep Water
- 8.1. Market Analysis, Insights and Forecast - by Ownership
- 9. South America FPSO Market Analysis, Insights and Forecast, 2019-2031
- 9.1. Market Analysis, Insights and Forecast - by Ownership
- 9.1.1. Operator-owned
- 9.1.2. Contractor-owned
- 9.2. Market Analysis, Insights and Forecast - by Water Depth
- 9.2.1. Shallow Water
- 9.2.2. Deep Water
- 9.2.3. Ultra-deep Water
- 9.1. Market Analysis, Insights and Forecast - by Ownership
- 10. Middle East and Africa FPSO Market Analysis, Insights and Forecast, 2019-2031
- 10.1. Market Analysis, Insights and Forecast - by Ownership
- 10.1.1. Operator-owned
- 10.1.2. Contractor-owned
- 10.2. Market Analysis, Insights and Forecast - by Water Depth
- 10.2.1. Shallow Water
- 10.2.2. Deep Water
- 10.2.3. Ultra-deep Water
- 10.1. Market Analysis, Insights and Forecast - by Ownership
- 11. North America FPSO Market Analysis, Insights and Forecast, 2019-2031
- 11.1. Market Analysis, Insights and Forecast - By Country/Sub-region
- 11.1.1 United States
- 11.1.2 Canada
- 11.1.3 Mexico
- 12. Europe FPSO Market Analysis, Insights and Forecast, 2019-2031
- 12.1. Market Analysis, Insights and Forecast - By Country/Sub-region
- 12.1.1 Germany
- 12.1.2 United Kingdom
- 12.1.3 France
- 12.1.4 Spain
- 12.1.5 Italy
- 12.1.6 Spain
- 12.1.7 Belgium
- 12.1.8 Netherland
- 12.1.9 Nordics
- 12.1.10 Rest of Europe
- 13. Asia Pacific FPSO Market Analysis, Insights and Forecast, 2019-2031
- 13.1. Market Analysis, Insights and Forecast - By Country/Sub-region
- 13.1.1 China
- 13.1.2 Japan
- 13.1.3 India
- 13.1.4 South Korea
- 13.1.5 Southeast Asia
- 13.1.6 Australia
- 13.1.7 Indonesia
- 13.1.8 Phillipes
- 13.1.9 Singapore
- 13.1.10 Thailandc
- 13.1.11 Rest of Asia Pacific
- 14. South America FPSO Market Analysis, Insights and Forecast, 2019-2031
- 14.1. Market Analysis, Insights and Forecast - By Country/Sub-region
- 14.1.1 Brazil
- 14.1.2 Argentina
- 14.1.3 Peru
- 14.1.4 Chile
- 14.1.5 Colombia
- 14.1.6 Ecuador
- 14.1.7 Venezuela
- 14.1.8 Rest of South America
- 15. North America FPSO Market Analysis, Insights and Forecast, 2019-2031
- 15.1. Market Analysis, Insights and Forecast - By Country/Sub-region
- 15.1.1 United States
- 15.1.2 Canada
- 15.1.3 Mexico
- 16. MEA FPSO Market Analysis, Insights and Forecast, 2019-2031
- 16.1. Market Analysis, Insights and Forecast - By Country/Sub-region
- 16.1.1 United Arab Emirates
- 16.1.2 Saudi Arabia
- 16.1.3 South Africa
- 16.1.4 Rest of Middle East and Africa
- 17. Competitive Analysis
- 17.1. Global Market Share Analysis 2024
- 17.2. Company Profiles
- 17.2.1 6 Shell PLC
- 17.2.1.1. Overview
- 17.2.1.2. Products
- 17.2.1.3. SWOT Analysis
- 17.2.1.4. Recent Developments
- 17.2.1.5. Financials (Based on Availability)
- 17.2.2 5 Bluewater Holding BV
- 17.2.2.1. Overview
- 17.2.2.2. Products
- 17.2.2.3. SWOT Analysis
- 17.2.2.4. Recent Developments
- 17.2.2.5. Financials (Based on Availability)
- 17.2.3 6 Saipem SpA
- 17.2.3.1. Overview
- 17.2.3.2. Products
- 17.2.3.3. SWOT Analysis
- 17.2.3.4. Recent Developments
- 17.2.3.5. Financials (Based on Availability)
- 17.2.4 7 BP PLC*List Not Exhaustive
- 17.2.4.1. Overview
- 17.2.4.2. Products
- 17.2.4.3. SWOT Analysis
- 17.2.4.4. Recent Developments
- 17.2.4.5. Financials (Based on Availability)
- 17.2.5 1 Petroleo Brasileiro SA (Petrobras)
- 17.2.5.1. Overview
- 17.2.5.2. Products
- 17.2.5.3. SWOT Analysis
- 17.2.5.4. Recent Developments
- 17.2.5.5. Financials (Based on Availability)
- 17.2.6 4 Teekay Offshore Partners LP
- 17.2.6.1. Overview
- 17.2.6.2. Products
- 17.2.6.3. SWOT Analysis
- 17.2.6.4. Recent Developments
- 17.2.6.5. Financials (Based on Availability)
- 17.2.7 5 Chevron Corporation
- 17.2.7.1. Overview
- 17.2.7.2. Products
- 17.2.7.3. SWOT Analysis
- 17.2.7.4. Recent Developments
- 17.2.7.5. Financials (Based on Availability)
- 17.2.8 3 TotalEnergies SE
- 17.2.8.1. Overview
- 17.2.8.2. Products
- 17.2.8.3. SWOT Analysis
- 17.2.8.4. Recent Developments
- 17.2.8.5. Financials (Based on Availability)
- 17.2.9 7 Petrofac Limited
- 17.2.9.1. Overview
- 17.2.9.2. Products
- 17.2.9.3. SWOT Analysis
- 17.2.9.4. Recent Developments
- 17.2.9.5. Financials (Based on Availability)
- 17.2.10 4 ExxonMobil Corp
- 17.2.10.1. Overview
- 17.2.10.2. Products
- 17.2.10.3. SWOT Analysis
- 17.2.10.4. Recent Developments
- 17.2.10.5. Financials (Based on Availability)
- 17.2.11 1 Modec Inc
- 17.2.11.1. Overview
- 17.2.11.2. Products
- 17.2.11.3. SWOT Analysis
- 17.2.11.4. Recent Developments
- 17.2.11.5. Financials (Based on Availability)
- 17.2.12 3 BW Offshore Limited
- 17.2.12.1. Overview
- 17.2.12.2. Products
- 17.2.12.3. SWOT Analysis
- 17.2.12.4. Recent Developments
- 17.2.12.5. Financials (Based on Availability)
- 17.2.13 FPSO Operators
- 17.2.13.1. Overview
- 17.2.13.2. Products
- 17.2.13.3. SWOT Analysis
- 17.2.13.4. Recent Developments
- 17.2.13.5. Financials (Based on Availability)
- 17.2.14 2 SBM Offshore NV
- 17.2.14.1. Overview
- 17.2.14.2. Products
- 17.2.14.3. SWOT Analysis
- 17.2.14.4. Recent Developments
- 17.2.14.5. Financials (Based on Availability)
- 17.2.15 2 CNOOC Ltd
- 17.2.15.1. Overview
- 17.2.15.2. Products
- 17.2.15.3. SWOT Analysis
- 17.2.15.4. Recent Developments
- 17.2.15.5. Financials (Based on Availability)
- 17.2.16 FPSO Contractors
- 17.2.16.1. Overview
- 17.2.16.2. Products
- 17.2.16.3. SWOT Analysis
- 17.2.16.4. Recent Developments
- 17.2.16.5. Financials (Based on Availability)
- 17.2.1 6 Shell PLC
List of Figures
- Figure 1: Global FPSO Market Revenue Breakdown (Million, %) by Region 2024 & 2032
- Figure 2: North America FPSO Market Revenue (Million), by Country 2024 & 2032
- Figure 3: North America FPSO Market Revenue Share (%), by Country 2024 & 2032
- Figure 4: Europe FPSO Market Revenue (Million), by Country 2024 & 2032
- Figure 5: Europe FPSO Market Revenue Share (%), by Country 2024 & 2032
- Figure 6: Asia Pacific FPSO Market Revenue (Million), by Country 2024 & 2032
- Figure 7: Asia Pacific FPSO Market Revenue Share (%), by Country 2024 & 2032
- Figure 8: South America FPSO Market Revenue (Million), by Country 2024 & 2032
- Figure 9: South America FPSO Market Revenue Share (%), by Country 2024 & 2032
- Figure 10: North America FPSO Market Revenue (Million), by Country 2024 & 2032
- Figure 11: North America FPSO Market Revenue Share (%), by Country 2024 & 2032
- Figure 12: MEA FPSO Market Revenue (Million), by Country 2024 & 2032
- Figure 13: MEA FPSO Market Revenue Share (%), by Country 2024 & 2032
- Figure 14: North America FPSO Market Revenue (Million), by Ownership 2024 & 2032
- Figure 15: North America FPSO Market Revenue Share (%), by Ownership 2024 & 2032
- Figure 16: North America FPSO Market Revenue (Million), by Water Depth 2024 & 2032
- Figure 17: North America FPSO Market Revenue Share (%), by Water Depth 2024 & 2032
- Figure 18: North America FPSO Market Revenue (Million), by Country 2024 & 2032
- Figure 19: North America FPSO Market Revenue Share (%), by Country 2024 & 2032
- Figure 20: Europe FPSO Market Revenue (Million), by Ownership 2024 & 2032
- Figure 21: Europe FPSO Market Revenue Share (%), by Ownership 2024 & 2032
- Figure 22: Europe FPSO Market Revenue (Million), by Water Depth 2024 & 2032
- Figure 23: Europe FPSO Market Revenue Share (%), by Water Depth 2024 & 2032
- Figure 24: Europe FPSO Market Revenue (Million), by Country 2024 & 2032
- Figure 25: Europe FPSO Market Revenue Share (%), by Country 2024 & 2032
- Figure 26: Asia Pacific FPSO Market Revenue (Million), by Ownership 2024 & 2032
- Figure 27: Asia Pacific FPSO Market Revenue Share (%), by Ownership 2024 & 2032
- Figure 28: Asia Pacific FPSO Market Revenue (Million), by Water Depth 2024 & 2032
- Figure 29: Asia Pacific FPSO Market Revenue Share (%), by Water Depth 2024 & 2032
- Figure 30: Asia Pacific FPSO Market Revenue (Million), by Country 2024 & 2032
- Figure 31: Asia Pacific FPSO Market Revenue Share (%), by Country 2024 & 2032
- Figure 32: South America FPSO Market Revenue (Million), by Ownership 2024 & 2032
- Figure 33: South America FPSO Market Revenue Share (%), by Ownership 2024 & 2032
- Figure 34: South America FPSO Market Revenue (Million), by Water Depth 2024 & 2032
- Figure 35: South America FPSO Market Revenue Share (%), by Water Depth 2024 & 2032
- Figure 36: South America FPSO Market Revenue (Million), by Country 2024 & 2032
- Figure 37: South America FPSO Market Revenue Share (%), by Country 2024 & 2032
- Figure 38: Middle East and Africa FPSO Market Revenue (Million), by Ownership 2024 & 2032
- Figure 39: Middle East and Africa FPSO Market Revenue Share (%), by Ownership 2024 & 2032
- Figure 40: Middle East and Africa FPSO Market Revenue (Million), by Water Depth 2024 & 2032
- Figure 41: Middle East and Africa FPSO Market Revenue Share (%), by Water Depth 2024 & 2032
- Figure 42: Middle East and Africa FPSO Market Revenue (Million), by Country 2024 & 2032
- Figure 43: Middle East and Africa FPSO Market Revenue Share (%), by Country 2024 & 2032
List of Tables
- Table 1: Global FPSO Market Revenue Million Forecast, by Region 2019 & 2032
- Table 2: Global FPSO Market Revenue Million Forecast, by Ownership 2019 & 2032
- Table 3: Global FPSO Market Revenue Million Forecast, by Water Depth 2019 & 2032
- Table 4: Global FPSO Market Revenue Million Forecast, by Region 2019 & 2032
- Table 5: Global FPSO Market Revenue Million Forecast, by Country 2019 & 2032
- Table 6: United States FPSO Market Revenue (Million) Forecast, by Application 2019 & 2032
- Table 7: Canada FPSO Market Revenue (Million) Forecast, by Application 2019 & 2032
- Table 8: Mexico FPSO Market Revenue (Million) Forecast, by Application 2019 & 2032
- Table 9: Global FPSO Market Revenue Million Forecast, by Country 2019 & 2032
- Table 10: Germany FPSO Market Revenue (Million) Forecast, by Application 2019 & 2032
- Table 11: United Kingdom FPSO Market Revenue (Million) Forecast, by Application 2019 & 2032
- Table 12: France FPSO Market Revenue (Million) Forecast, by Application 2019 & 2032
- Table 13: Spain FPSO Market Revenue (Million) Forecast, by Application 2019 & 2032
- Table 14: Italy FPSO Market Revenue (Million) Forecast, by Application 2019 & 2032
- Table 15: Spain FPSO Market Revenue (Million) Forecast, by Application 2019 & 2032
- Table 16: Belgium FPSO Market Revenue (Million) Forecast, by Application 2019 & 2032
- Table 17: Netherland FPSO Market Revenue (Million) Forecast, by Application 2019 & 2032
- Table 18: Nordics FPSO Market Revenue (Million) Forecast, by Application 2019 & 2032
- Table 19: Rest of Europe FPSO Market Revenue (Million) Forecast, by Application 2019 & 2032
- Table 20: Global FPSO Market Revenue Million Forecast, by Country 2019 & 2032
- Table 21: China FPSO Market Revenue (Million) Forecast, by Application 2019 & 2032
- Table 22: Japan FPSO Market Revenue (Million) Forecast, by Application 2019 & 2032
- Table 23: India FPSO Market Revenue (Million) Forecast, by Application 2019 & 2032
- Table 24: South Korea FPSO Market Revenue (Million) Forecast, by Application 2019 & 2032
- Table 25: Southeast Asia FPSO Market Revenue (Million) Forecast, by Application 2019 & 2032
- Table 26: Australia FPSO Market Revenue (Million) Forecast, by Application 2019 & 2032
- Table 27: Indonesia FPSO Market Revenue (Million) Forecast, by Application 2019 & 2032
- Table 28: Phillipes FPSO Market Revenue (Million) Forecast, by Application 2019 & 2032
- Table 29: Singapore FPSO Market Revenue (Million) Forecast, by Application 2019 & 2032
- Table 30: Thailandc FPSO Market Revenue (Million) Forecast, by Application 2019 & 2032
- Table 31: Rest of Asia Pacific FPSO Market Revenue (Million) Forecast, by Application 2019 & 2032
- Table 32: Global FPSO Market Revenue Million Forecast, by Country 2019 & 2032
- Table 33: Brazil FPSO Market Revenue (Million) Forecast, by Application 2019 & 2032
- Table 34: Argentina FPSO Market Revenue (Million) Forecast, by Application 2019 & 2032
- Table 35: Peru FPSO Market Revenue (Million) Forecast, by Application 2019 & 2032
- Table 36: Chile FPSO Market Revenue (Million) Forecast, by Application 2019 & 2032
- Table 37: Colombia FPSO Market Revenue (Million) Forecast, by Application 2019 & 2032
- Table 38: Ecuador FPSO Market Revenue (Million) Forecast, by Application 2019 & 2032
- Table 39: Venezuela FPSO Market Revenue (Million) Forecast, by Application 2019 & 2032
- Table 40: Rest of South America FPSO Market Revenue (Million) Forecast, by Application 2019 & 2032
- Table 41: Global FPSO Market Revenue Million Forecast, by Country 2019 & 2032
- Table 42: United States FPSO Market Revenue (Million) Forecast, by Application 2019 & 2032
- Table 43: Canada FPSO Market Revenue (Million) Forecast, by Application 2019 & 2032
- Table 44: Mexico FPSO Market Revenue (Million) Forecast, by Application 2019 & 2032
- Table 45: Global FPSO Market Revenue Million Forecast, by Country 2019 & 2032
- Table 46: United Arab Emirates FPSO Market Revenue (Million) Forecast, by Application 2019 & 2032
- Table 47: Saudi Arabia FPSO Market Revenue (Million) Forecast, by Application 2019 & 2032
- Table 48: South Africa FPSO Market Revenue (Million) Forecast, by Application 2019 & 2032
- Table 49: Rest of Middle East and Africa FPSO Market Revenue (Million) Forecast, by Application 2019 & 2032
- Table 50: Global FPSO Market Revenue Million Forecast, by Ownership 2019 & 2032
- Table 51: Global FPSO Market Revenue Million Forecast, by Water Depth 2019 & 2032
- Table 52: Global FPSO Market Revenue Million Forecast, by Country 2019 & 2032
- Table 53: United States FPSO Market Revenue (Million) Forecast, by Application 2019 & 2032
- Table 54: Canada FPSO Market Revenue (Million) Forecast, by Application 2019 & 2032
- Table 55: Mexico FPSO Market Revenue (Million) Forecast, by Application 2019 & 2032
- Table 56: Rest of North America FPSO Market Revenue (Million) Forecast, by Application 2019 & 2032
- Table 57: Global FPSO Market Revenue Million Forecast, by Ownership 2019 & 2032
- Table 58: Global FPSO Market Revenue Million Forecast, by Water Depth 2019 & 2032
- Table 59: Global FPSO Market Revenue Million Forecast, by Country 2019 & 2032
- Table 60: Norway FPSO Market Revenue (Million) Forecast, by Application 2019 & 2032
- Table 61: United Kingdom FPSO Market Revenue (Million) Forecast, by Application 2019 & 2032
- Table 62: Russia FPSO Market Revenue (Million) Forecast, by Application 2019 & 2032
- Table 63: Netherland FPSO Market Revenue (Million) Forecast, by Application 2019 & 2032
- Table 64: France FPSO Market Revenue (Million) Forecast, by Application 2019 & 2032
- Table 65: Italy FPSO Market Revenue (Million) Forecast, by Application 2019 & 2032
- Table 66: NORDIC FPSO Market Revenue (Million) Forecast, by Application 2019 & 2032
- Table 67: Germany FPSO Market Revenue (Million) Forecast, by Application 2019 & 2032
- Table 68: Spain FPSO Market Revenue (Million) Forecast, by Application 2019 & 2032
- Table 69: Rest of Europe FPSO Market Revenue (Million) Forecast, by Application 2019 & 2032
- Table 70: Global FPSO Market Revenue Million Forecast, by Ownership 2019 & 2032
- Table 71: Global FPSO Market Revenue Million Forecast, by Water Depth 2019 & 2032
- Table 72: Global FPSO Market Revenue Million Forecast, by Country 2019 & 2032
- Table 73: China FPSO Market Revenue (Million) Forecast, by Application 2019 & 2032
- Table 74: India FPSO Market Revenue (Million) Forecast, by Application 2019 & 2032
- Table 75: Australia FPSO Market Revenue (Million) Forecast, by Application 2019 & 2032
- Table 76: Indonesia FPSO Market Revenue (Million) Forecast, by Application 2019 & 2032
- Table 77: Malaysia FPSO Market Revenue (Million) Forecast, by Application 2019 & 2032
- Table 78: Thailand FPSO Market Revenue (Million) Forecast, by Application 2019 & 2032
- Table 79: Japan FPSO Market Revenue (Million) Forecast, by Application 2019 & 2032
- Table 80: Vietnam FPSO Market Revenue (Million) Forecast, by Application 2019 & 2032
- Table 81: Rest of Asia Pacific FPSO Market Revenue (Million) Forecast, by Application 2019 & 2032
- Table 82: Global FPSO Market Revenue Million Forecast, by Ownership 2019 & 2032
- Table 83: Global FPSO Market Revenue Million Forecast, by Water Depth 2019 & 2032
- Table 84: Global FPSO Market Revenue Million Forecast, by Country 2019 & 2032
- Table 85: Brazil FPSO Market Revenue (Million) Forecast, by Application 2019 & 2032
- Table 86: Argentina FPSO Market Revenue (Million) Forecast, by Application 2019 & 2032
- Table 87: Venezuela FPSO Market Revenue (Million) Forecast, by Application 2019 & 2032
- Table 88: Colombia FPSO Market Revenue (Million) Forecast, by Application 2019 & 2032
- Table 89: Rest of South America FPSO Market Revenue (Million) Forecast, by Application 2019 & 2032
- Table 90: Global FPSO Market Revenue Million Forecast, by Ownership 2019 & 2032
- Table 91: Global FPSO Market Revenue Million Forecast, by Water Depth 2019 & 2032
- Table 92: Global FPSO Market Revenue Million Forecast, by Country 2019 & 2032
- Table 93: Saudi Arabia FPSO Market Revenue (Million) Forecast, by Application 2019 & 2032
- Table 94: United Arab Emirates FPSO Market Revenue (Million) Forecast, by Application 2019 & 2032
- Table 95: Nigeria FPSO Market Revenue (Million) Forecast, by Application 2019 & 2032
- Table 96: Algeria FPSO Market Revenue (Million) Forecast, by Application 2019 & 2032
- Table 97: Qatar FPSO Market Revenue (Million) Forecast, by Application 2019 & 2032
- Table 98: South Africa FPSO Market Revenue (Million) Forecast, by Application 2019 & 2032
- Table 99: Egypt FPSO Market Revenue (Million) Forecast, by Application 2019 & 2032
- Table 100: Rest of Middle East and Africa FPSO Market Revenue (Million) Forecast, by Application 2019 & 2032
Frequently Asked Questions
1. What is the projected Compound Annual Growth Rate (CAGR) of the FPSO Market?
The projected CAGR is approximately 8.50%.
2. Which companies are prominent players in the FPSO Market?
Key companies in the market include 6 Shell PLC, 5 Bluewater Holding BV, 6 Saipem SpA, 7 BP PLC*List Not Exhaustive, 1 Petroleo Brasileiro SA (Petrobras), 4 Teekay Offshore Partners LP, 5 Chevron Corporation, 3 TotalEnergies SE, 7 Petrofac Limited, 4 ExxonMobil Corp, 1 Modec Inc, 3 BW Offshore Limited, FPSO Operators, 2 SBM Offshore NV, 2 CNOOC Ltd, FPSO Contractors.
3. What are the main segments of the FPSO Market?
The market segments include Ownership, Water Depth.
4. Can you provide details about the market size?
The market size is estimated to be USD 12.04 Million as of 2022.
5. What are some drivers contributing to market growth?
4.; Increasing Offshore Oil and Gas Exploration and Production Activities4.; Growing Demand for Energy.
6. What are the notable trends driving market growth?
Contractor-owned FPSO Expected to Dominate the Market.
7. Are there any restraints impacting market growth?
4.; High Upfront Costs.
8. Can you provide examples of recent developments in the market?
May 2023: SBM Offshore and Esso Exploration & Production Guyana entered a 10-year Operations and Maintenance Enabling Agreement. The agreement entails SBM Offshore being responsible for the operations and maintenance of four FPSOs: Liza Destiny, Liza Unity, Prosperity, and ONE GUYANA.
9. What pricing options are available for accessing the report?
Pricing options include single-user, multi-user, and enterprise licenses priced at USD 4750, USD 5250, and USD 8750 respectively.
10. Is the market size provided in terms of value or volume?
The market size is provided in terms of value, measured in Million.
11. Are there any specific market keywords associated with the report?
Yes, the market keyword associated with the report is "FPSO Market," which aids in identifying and referencing the specific market segment covered.
12. How do I determine which pricing option suits my needs best?
The pricing options vary based on user requirements and access needs. Individual users may opt for single-user licenses, while businesses requiring broader access may choose multi-user or enterprise licenses for cost-effective access to the report.
13. Are there any additional resources or data provided in the FPSO Market report?
While the report offers comprehensive insights, it's advisable to review the specific contents or supplementary materials provided to ascertain if additional resources or data are available.
14. How can I stay updated on further developments or reports in the FPSO Market?
To stay informed about further developments, trends, and reports in the FPSO Market, consider subscribing to industry newsletters, following relevant companies and organizations, or regularly checking reputable industry news sources and publications.
Methodology
Step 1 - Identification of Relevant Samples Size from Population Database


Step 2 - Approaches for Defining Global Market Size (Value, Volume* & Price*)

Note*: In applicable scenarios
Step 3 - Data Sources
Primary Research
- Web Analytics
- Survey Reports
- Research Institute
- Latest Research Reports
- Opinion Leaders
Secondary Research
- Annual Reports
- White Paper
- Latest Press Release
- Industry Association
- Paid Database
- Investor Presentations

Step 4 - Data Triangulation
Involves using different sources of information in order to increase the validity of a study
These sources are likely to be stakeholders in a program - participants, other researchers, program staff, other community members, and so on.
Then we put all data in single framework & apply various statistical tools to find out the dynamic on the market.
During the analysis stage, feedback from the stakeholder groups would be compared to determine areas of agreement as well as areas of divergence


