
Key Insights
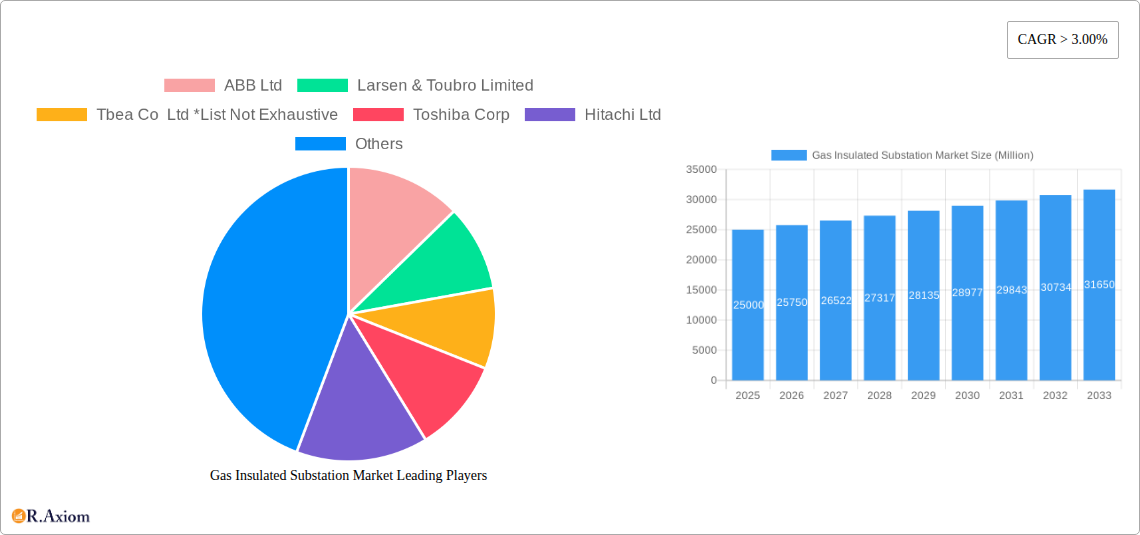
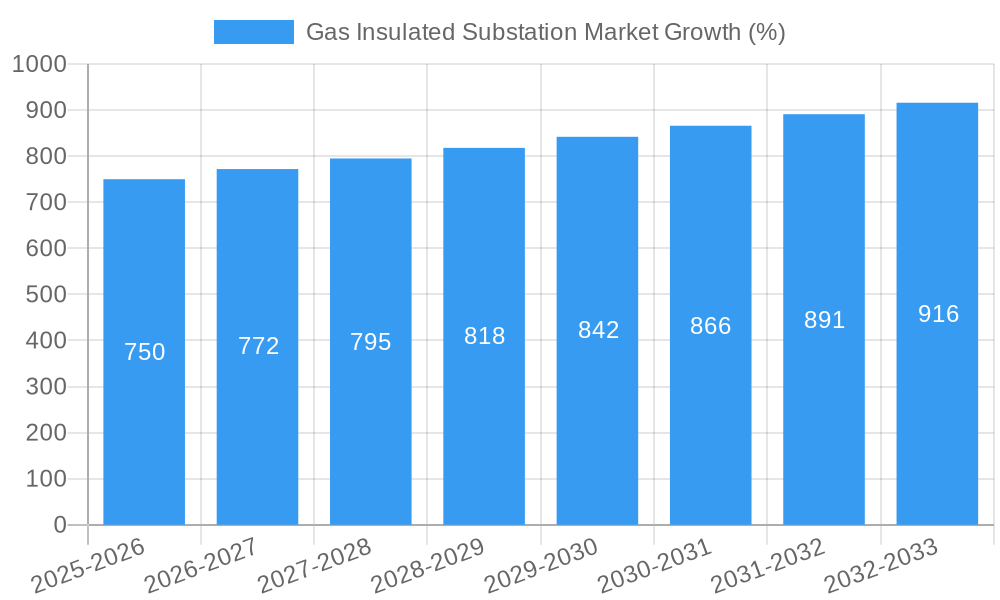
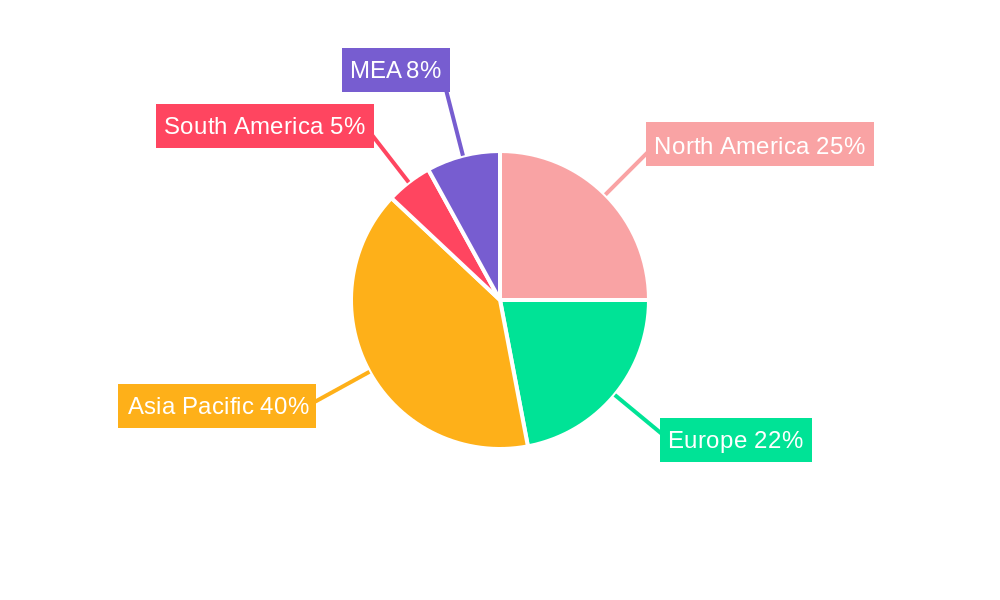
The Gas Insulated Substation (GIS) market is experiencing robust growth, driven by the increasing demand for reliable and efficient power transmission and distribution infrastructure globally. The market's Compound Annual Growth Rate (CAGR) exceeding 3.00% reflects a steady expansion projected through 2033. This growth is fueled by several key factors: the rising adoption of renewable energy sources requiring efficient integration into existing grids, the need for enhanced grid modernization to handle increasing power demands in urban areas, and the growing preference for compact and environmentally friendly substation solutions. The medium voltage segment currently holds a significant market share, but the high and extra-high voltage segments are poised for substantial growth due to large-scale power transmission projects. Geographically, Asia-Pacific, particularly China and India, are expected to dominate the market due to substantial investments in infrastructure development and expanding energy consumption. North America and Europe also contribute significantly, driven by grid upgrades and renewable energy integration initiatives. However, high initial investment costs and the specialized technical expertise required for installation and maintenance act as restraints on market expansion. Leading players like ABB, Siemens, and Schneider Electric are leveraging technological advancements and strategic partnerships to maintain their competitive edge, while regional players are capitalizing on localized demand.
The competitive landscape is marked by both established global players and regional manufacturers. The presence of numerous key players fosters innovation and drives price competition, benefiting end-users. Furthermore, the increasing focus on smart grids and digitalization presents opportunities for integrating advanced technologies within GIS solutions, leading to further market expansion. While the commercial and residential sector currently holds a smaller market share compared to power utilities and the industrial sector, its contribution is expected to grow steadily with increasing urbanization and the need for reliable power supply in residential and commercial buildings. The forecast period (2025-2033) anticipates continued market expansion, driven by ongoing infrastructural development and the urgent need for efficient and reliable power delivery worldwide. Market segmentation by voltage level and end-user will continue to be key factors influencing market dynamics and growth trajectory.
Gas Insulated Substation Market: A Comprehensive Report (2019-2033)
This in-depth report provides a comprehensive analysis of the Gas Insulated Substation (GIS) market, offering actionable insights for stakeholders across the value chain. With a study period spanning 2019-2033, a base year of 2025, and a forecast period of 2025-2033, this report meticulously examines market trends, competitive dynamics, and growth opportunities. The market is projected to reach xx Million by 2033, exhibiting a CAGR of xx% during the forecast period.
Gas Insulated Substation Market Market Concentration & Innovation
The Gas Insulated Substation market exhibits a moderately concentrated landscape, with key players such as ABB Ltd, Larsen & Toubro Limited, and TBEA Co Ltd holding significant market share. However, the presence of several other established players like Toshiba Corp, Hitachi Ltd, and Siemens AG indicates a competitive environment. Market share analysis reveals that ABB Ltd holds an estimated xx% market share in 2025, followed by Larsen & Toubro Limited with xx% and TBEA Co Ltd with xx%.
Innovation in GIS technology is driven by the need for enhanced reliability, compactness, and improved environmental performance. Stringent regulatory frameworks emphasizing grid modernization and emission reduction further fuel technological advancements. The market witnesses continuous innovation in areas like SF6 gas alternatives, digitalization of substations, and enhanced monitoring systems. M&A activities have played a significant role in shaping the market landscape, with notable deals valued at xx Million in the past five years. These mergers and acquisitions have primarily focused on expanding geographic reach and technological capabilities. End-user trends indicate a growing preference for compact and efficient GIS solutions, particularly in urban areas with limited space.
Gas Insulated Substation Market Industry Trends & Insights
The Gas Insulated Substation market is experiencing robust growth driven by several factors. The increasing demand for reliable and efficient power transmission and distribution infrastructure, particularly in rapidly developing economies, is a key driver. The global shift towards renewable energy sources necessitates the deployment of advanced substation technologies like GIS to enhance grid stability and integration. Technological disruptions, such as the development of eco-friendly SF6 alternatives and the integration of digital technologies, are further accelerating market expansion. Consumer preferences are shifting towards solutions that minimize environmental impact and offer enhanced operational efficiency. The competitive dynamics are characterized by intense rivalry among established players, with a focus on innovation, cost optimization, and strategic partnerships. The market penetration of GIS is expected to increase significantly in emerging markets, fueled by supportive government policies and investments in grid infrastructure.
Dominant Markets & Segments in Gas Insulated Substation Market
Dominant Regions & Countries: The Asia-Pacific region is projected to dominate the GIS market throughout the forecast period, driven by robust economic growth, rapid urbanization, and significant investments in power infrastructure. China and India are expected to be the leading national markets.
Dominant Segments:
- Voltage: The high voltage segment is expected to hold the largest market share due to the increasing demand for high-capacity transmission lines.
- End-User: The power utilities segment accounts for the largest market share, driven by the need to upgrade existing infrastructure and meet growing energy demands.
Key Drivers for Dominance:
- Asia-Pacific: Rapid economic growth, expanding power grids, and government initiatives promoting renewable energy integration.
- High Voltage Segment: Increasing demand for long-distance power transmission and higher power capacity requirements.
- Power Utilities Segment: Government regulations, grid modernization projects, and the need for reliable and efficient power distribution.
Gas Insulated Substation Market Product Developments
Recent product developments in the GIS market focus on enhancing compactness, improving efficiency, and reducing environmental impact. The development of eco-friendly SF6 alternatives, like air or vacuum circuit breakers, is gaining traction due to environmental concerns. Integration of smart sensors and digital technologies enables predictive maintenance and remote monitoring, optimizing operational efficiency. These innovations cater to the growing demand for sustainable and efficient power grid solutions, enhancing the market fit and competitiveness of new products.
Report Scope & Segmentation Analysis
This report segments the Gas Insulated Substation market based on voltage level (Medium Voltage, High Voltage, Extra High Voltage) and end-user (Power Utilities, Industrial Sector, Commercial and Residential Sector).
Voltage: Each voltage segment exhibits distinct growth projections and competitive dynamics, reflecting the specific technical requirements and applications. The High Voltage segment is expected to experience the highest growth due to large-scale power transmission projects.
End-User: The Power Utilities segment is the largest, driven by grid modernization, while the Industrial Sector is a significant segment owing to the rising demand for reliable power supply in industrial settings. The Commercial and Residential sector is a growing segment, albeit smaller, driven by the need for reliable power supply in commercial buildings and residential areas. Market sizes and competitive landscapes vary across each segment.
Key Drivers of Gas Insulated Substation Market Growth
The growth of the GIS market is primarily driven by:
- Increasing demand for reliable power infrastructure: Growth in electricity consumption and the need for reliable power supply across various sectors are primary drivers.
- Government initiatives for grid modernization: Government programs aimed at upgrading aging power grids are pushing the adoption of advanced GIS technology.
- Technological advancements: Developments in GIS technology, such as eco-friendly gas alternatives, are making the technology more appealing and sustainable.
Challenges in the Gas Insulated Substation Market Sector
The GIS market faces several challenges:
- High initial investment costs: The high capital expenditure required for GIS installation can be a barrier to adoption, particularly for smaller utilities.
- Supply chain disruptions: Global supply chain disruptions can impact the availability and cost of components, hindering market growth.
- Competition from alternative technologies: Competition from other substation technologies like air-insulated substations can limit market penetration.
Emerging Opportunities in Gas Insulated Substation Market
Emerging opportunities in the GIS market include:
- Growth in renewable energy integration: The rising adoption of renewable energy sources creates opportunities for GIS solutions to support grid stability and integration.
- Smart grid technologies: The development and adoption of smart grid technologies present opportunities for enhanced monitoring, control, and automation of GIS installations.
- Expansion in developing economies: Rapid economic growth and urbanization in developing economies are driving significant demand for improved power infrastructure, creating opportunities for GIS manufacturers.
Leading Players in the Gas Insulated Substation Market Market
- ABB Ltd
- Larsen & Toubro Limited
- TBEA Co Ltd
- Toshiba Corp
- Hitachi Ltd
- Bharat Heavy Electricals Limited
- Mitsubishi Electric Corporation
- Siemens AG
- Schneider Electric SE
- Powell Industries Inc
- Elsewedy Electric Co S A E
- CG Power and Industrial Solutions Ltd
- General Electric Company
- Hyosung Corp
Key Developments in Gas Insulated Substation Market Industry
- January 2023: ABB Ltd launched a new range of eco-friendly GIS solutions utilizing SF6 alternative gas.
- June 2022: Siemens AG acquired a smaller GIS manufacturer, expanding its product portfolio and market reach.
- October 2021: Larsen & Toubro Limited secured a major contract for GIS installation in a large-scale renewable energy project. (Further developments can be added here)
Strategic Outlook for Gas Insulated Substation Market Market
The Gas Insulated Substation market is poised for continued growth, driven by the increasing demand for reliable power infrastructure, government initiatives promoting grid modernization, and technological advancements in GIS technology. The adoption of eco-friendly solutions and the integration of smart grid technologies will further shape the market landscape. The focus on enhancing efficiency, reducing environmental impact, and optimizing operational costs will remain crucial for success in this dynamic and competitive market.
Gas Insulated Substation Market Segmentation
-
1. Voltage
- 1.1. Medium Voltage
- 1.2. High Voltage
- 1.3. Extra High Voltage
-
2. End-User
- 2.1. Power Utilities
- 2.2. Industrial Sector
- 2.3. Commercial and Residential Sector
Gas Insulated Substation Market Segmentation By Geography
- 1. North America
- 2. Europe
- 3. Asia Pacific
- 4. South America
- 5. Middle East and Africa
Gas Insulated Substation Market REPORT HIGHLIGHTS
| Aspects | Details |
|---|---|
| Study Period | 2019-2033 |
| Base Year | 2024 |
| Estimated Year | 2025 |
| Forecast Period | 2025-2033 |
| Historical Period | 2019-2024 |
| Growth Rate | CAGR of > 3.00% from 2019-2033 |
| Segmentation |
|
Table of Contents
- 1. Introduction
- 1.1. Research Scope
- 1.2. Market Segmentation
- 1.3. Research Methodology
- 1.4. Definitions and Assumptions
- 2. Executive Summary
- 2.1. Introduction
- 3. Market Dynamics
- 3.1. Introduction
- 3.2. Market Drivers
- 3.2.1. Supportive Government Policies and Incentives4.; Environmental Concerns
- 3.3. Market Restrains
- 3.3.1. Fossil Fuel Subsidies
- 3.4. Market Trends
- 3.4.1. Power Utilities Sector to Dominate the Market
- 4. Market Factor Analysis
- 4.1. Porters Five Forces
- 4.2. Supply/Value Chain
- 4.3. PESTEL analysis
- 4.4. Market Entropy
- 4.5. Patent/Trademark Analysis
- 5. Global Gas Insulated Substation Market Analysis, Insights and Forecast, 2019-2031
- 5.1. Market Analysis, Insights and Forecast - by Voltage
- 5.1.1. Medium Voltage
- 5.1.2. High Voltage
- 5.1.3. Extra High Voltage
- 5.2. Market Analysis, Insights and Forecast - by End-User
- 5.2.1. Power Utilities
- 5.2.2. Industrial Sector
- 5.2.3. Commercial and Residential Sector
- 5.3. Market Analysis, Insights and Forecast - by Region
- 5.3.1. North America
- 5.3.2. Europe
- 5.3.3. Asia Pacific
- 5.3.4. South America
- 5.3.5. Middle East and Africa
- 5.1. Market Analysis, Insights and Forecast - by Voltage
- 6. North America Gas Insulated Substation Market Analysis, Insights and Forecast, 2019-2031
- 6.1. Market Analysis, Insights and Forecast - by Voltage
- 6.1.1. Medium Voltage
- 6.1.2. High Voltage
- 6.1.3. Extra High Voltage
- 6.2. Market Analysis, Insights and Forecast - by End-User
- 6.2.1. Power Utilities
- 6.2.2. Industrial Sector
- 6.2.3. Commercial and Residential Sector
- 6.1. Market Analysis, Insights and Forecast - by Voltage
- 7. Europe Gas Insulated Substation Market Analysis, Insights and Forecast, 2019-2031
- 7.1. Market Analysis, Insights and Forecast - by Voltage
- 7.1.1. Medium Voltage
- 7.1.2. High Voltage
- 7.1.3. Extra High Voltage
- 7.2. Market Analysis, Insights and Forecast - by End-User
- 7.2.1. Power Utilities
- 7.2.2. Industrial Sector
- 7.2.3. Commercial and Residential Sector
- 7.1. Market Analysis, Insights and Forecast - by Voltage
- 8. Asia Pacific Gas Insulated Substation Market Analysis, Insights and Forecast, 2019-2031
- 8.1. Market Analysis, Insights and Forecast - by Voltage
- 8.1.1. Medium Voltage
- 8.1.2. High Voltage
- 8.1.3. Extra High Voltage
- 8.2. Market Analysis, Insights and Forecast - by End-User
- 8.2.1. Power Utilities
- 8.2.2. Industrial Sector
- 8.2.3. Commercial and Residential Sector
- 8.1. Market Analysis, Insights and Forecast - by Voltage
- 9. South America Gas Insulated Substation Market Analysis, Insights and Forecast, 2019-2031
- 9.1. Market Analysis, Insights and Forecast - by Voltage
- 9.1.1. Medium Voltage
- 9.1.2. High Voltage
- 9.1.3. Extra High Voltage
- 9.2. Market Analysis, Insights and Forecast - by End-User
- 9.2.1. Power Utilities
- 9.2.2. Industrial Sector
- 9.2.3. Commercial and Residential Sector
- 9.1. Market Analysis, Insights and Forecast - by Voltage
- 10. Middle East and Africa Gas Insulated Substation Market Analysis, Insights and Forecast, 2019-2031
- 10.1. Market Analysis, Insights and Forecast - by Voltage
- 10.1.1. Medium Voltage
- 10.1.2. High Voltage
- 10.1.3. Extra High Voltage
- 10.2. Market Analysis, Insights and Forecast - by End-User
- 10.2.1. Power Utilities
- 10.2.2. Industrial Sector
- 10.2.3. Commercial and Residential Sector
- 10.1. Market Analysis, Insights and Forecast - by Voltage
- 11. North America Gas Insulated Substation Market Analysis, Insights and Forecast, 2019-2031
- 11.1. Market Analysis, Insights and Forecast - By Country/Sub-region
- 11.1.1 United States
- 11.1.2 Canada
- 11.1.3 Mexico
- 12. Europe Gas Insulated Substation Market Analysis, Insights and Forecast, 2019-2031
- 12.1. Market Analysis, Insights and Forecast - By Country/Sub-region
- 12.1.1 Germany
- 12.1.2 United Kingdom
- 12.1.3 France
- 12.1.4 Spain
- 12.1.5 Italy
- 12.1.6 Spain
- 12.1.7 Belgium
- 12.1.8 Netherland
- 12.1.9 Nordics
- 12.1.10 Rest of Europe
- 13. Asia Pacific Gas Insulated Substation Market Analysis, Insights and Forecast, 2019-2031
- 13.1. Market Analysis, Insights and Forecast - By Country/Sub-region
- 13.1.1 China
- 13.1.2 Japan
- 13.1.3 India
- 13.1.4 South Korea
- 13.1.5 Southeast Asia
- 13.1.6 Australia
- 13.1.7 Indonesia
- 13.1.8 Phillipes
- 13.1.9 Singapore
- 13.1.10 Thailandc
- 13.1.11 Rest of Asia Pacific
- 14. South America Gas Insulated Substation Market Analysis, Insights and Forecast, 2019-2031
- 14.1. Market Analysis, Insights and Forecast - By Country/Sub-region
- 14.1.1 Brazil
- 14.1.2 Argentina
- 14.1.3 Peru
- 14.1.4 Chile
- 14.1.5 Colombia
- 14.1.6 Ecuador
- 14.1.7 Venezuela
- 14.1.8 Rest of South America
- 15. MEA Gas Insulated Substation Market Analysis, Insights and Forecast, 2019-2031
- 15.1. Market Analysis, Insights and Forecast - By Country/Sub-region
- 15.1.1 United Arab Emirates
- 15.1.2 Saudi Arabia
- 15.1.3 South Africa
- 15.1.4 Rest of Middle East and Africa
- 16. Competitive Analysis
- 16.1. Global Market Share Analysis 2024
- 16.2. Company Profiles
- 16.2.1 ABB Ltd
- 16.2.1.1. Overview
- 16.2.1.2. Products
- 16.2.1.3. SWOT Analysis
- 16.2.1.4. Recent Developments
- 16.2.1.5. Financials (Based on Availability)
- 16.2.2 Larsen & Toubro Limited
- 16.2.2.1. Overview
- 16.2.2.2. Products
- 16.2.2.3. SWOT Analysis
- 16.2.2.4. Recent Developments
- 16.2.2.5. Financials (Based on Availability)
- 16.2.3 Tbea Co Ltd *List Not Exhaustive
- 16.2.3.1. Overview
- 16.2.3.2. Products
- 16.2.3.3. SWOT Analysis
- 16.2.3.4. Recent Developments
- 16.2.3.5. Financials (Based on Availability)
- 16.2.4 Toshiba Corp
- 16.2.4.1. Overview
- 16.2.4.2. Products
- 16.2.4.3. SWOT Analysis
- 16.2.4.4. Recent Developments
- 16.2.4.5. Financials (Based on Availability)
- 16.2.5 Hitachi Ltd
- 16.2.5.1. Overview
- 16.2.5.2. Products
- 16.2.5.3. SWOT Analysis
- 16.2.5.4. Recent Developments
- 16.2.5.5. Financials (Based on Availability)
- 16.2.6 Bharat Heavy Electricals Limited
- 16.2.6.1. Overview
- 16.2.6.2. Products
- 16.2.6.3. SWOT Analysis
- 16.2.6.4. Recent Developments
- 16.2.6.5. Financials (Based on Availability)
- 16.2.7 Mitsubishi Electric Corporation
- 16.2.7.1. Overview
- 16.2.7.2. Products
- 16.2.7.3. SWOT Analysis
- 16.2.7.4. Recent Developments
- 16.2.7.5. Financials (Based on Availability)
- 16.2.8 Siemens AG
- 16.2.8.1. Overview
- 16.2.8.2. Products
- 16.2.8.3. SWOT Analysis
- 16.2.8.4. Recent Developments
- 16.2.8.5. Financials (Based on Availability)
- 16.2.9 Schneider Electric SE
- 16.2.9.1. Overview
- 16.2.9.2. Products
- 16.2.9.3. SWOT Analysis
- 16.2.9.4. Recent Developments
- 16.2.9.5. Financials (Based on Availability)
- 16.2.10 Powell Industries Inc
- 16.2.10.1. Overview
- 16.2.10.2. Products
- 16.2.10.3. SWOT Analysis
- 16.2.10.4. Recent Developments
- 16.2.10.5. Financials (Based on Availability)
- 16.2.11 Elsewedy Electric Co S A E
- 16.2.11.1. Overview
- 16.2.11.2. Products
- 16.2.11.3. SWOT Analysis
- 16.2.11.4. Recent Developments
- 16.2.11.5. Financials (Based on Availability)
- 16.2.12 CG Power and Industrial Solutions Ltd
- 16.2.12.1. Overview
- 16.2.12.2. Products
- 16.2.12.3. SWOT Analysis
- 16.2.12.4. Recent Developments
- 16.2.12.5. Financials (Based on Availability)
- 16.2.13 General Electric Company
- 16.2.13.1. Overview
- 16.2.13.2. Products
- 16.2.13.3. SWOT Analysis
- 16.2.13.4. Recent Developments
- 16.2.13.5. Financials (Based on Availability)
- 16.2.14 Hyosung Corp
- 16.2.14.1. Overview
- 16.2.14.2. Products
- 16.2.14.3. SWOT Analysis
- 16.2.14.4. Recent Developments
- 16.2.14.5. Financials (Based on Availability)
- 16.2.1 ABB Ltd
List of Figures
- Figure 1: Global Gas Insulated Substation Market Revenue Breakdown (Million, %) by Region 2024 & 2032
- Figure 2: North America Gas Insulated Substation Market Revenue (Million), by Country 2024 & 2032
- Figure 3: North America Gas Insulated Substation Market Revenue Share (%), by Country 2024 & 2032
- Figure 4: Europe Gas Insulated Substation Market Revenue (Million), by Country 2024 & 2032
- Figure 5: Europe Gas Insulated Substation Market Revenue Share (%), by Country 2024 & 2032
- Figure 6: Asia Pacific Gas Insulated Substation Market Revenue (Million), by Country 2024 & 2032
- Figure 7: Asia Pacific Gas Insulated Substation Market Revenue Share (%), by Country 2024 & 2032
- Figure 8: South America Gas Insulated Substation Market Revenue (Million), by Country 2024 & 2032
- Figure 9: South America Gas Insulated Substation Market Revenue Share (%), by Country 2024 & 2032
- Figure 10: MEA Gas Insulated Substation Market Revenue (Million), by Country 2024 & 2032
- Figure 11: MEA Gas Insulated Substation Market Revenue Share (%), by Country 2024 & 2032
- Figure 12: North America Gas Insulated Substation Market Revenue (Million), by Voltage 2024 & 2032
- Figure 13: North America Gas Insulated Substation Market Revenue Share (%), by Voltage 2024 & 2032
- Figure 14: North America Gas Insulated Substation Market Revenue (Million), by End-User 2024 & 2032
- Figure 15: North America Gas Insulated Substation Market Revenue Share (%), by End-User 2024 & 2032
- Figure 16: North America Gas Insulated Substation Market Revenue (Million), by Country 2024 & 2032
- Figure 17: North America Gas Insulated Substation Market Revenue Share (%), by Country 2024 & 2032
- Figure 18: Europe Gas Insulated Substation Market Revenue (Million), by Voltage 2024 & 2032
- Figure 19: Europe Gas Insulated Substation Market Revenue Share (%), by Voltage 2024 & 2032
- Figure 20: Europe Gas Insulated Substation Market Revenue (Million), by End-User 2024 & 2032
- Figure 21: Europe Gas Insulated Substation Market Revenue Share (%), by End-User 2024 & 2032
- Figure 22: Europe Gas Insulated Substation Market Revenue (Million), by Country 2024 & 2032
- Figure 23: Europe Gas Insulated Substation Market Revenue Share (%), by Country 2024 & 2032
- Figure 24: Asia Pacific Gas Insulated Substation Market Revenue (Million), by Voltage 2024 & 2032
- Figure 25: Asia Pacific Gas Insulated Substation Market Revenue Share (%), by Voltage 2024 & 2032
- Figure 26: Asia Pacific Gas Insulated Substation Market Revenue (Million), by End-User 2024 & 2032
- Figure 27: Asia Pacific Gas Insulated Substation Market Revenue Share (%), by End-User 2024 & 2032
- Figure 28: Asia Pacific Gas Insulated Substation Market Revenue (Million), by Country 2024 & 2032
- Figure 29: Asia Pacific Gas Insulated Substation Market Revenue Share (%), by Country 2024 & 2032
- Figure 30: South America Gas Insulated Substation Market Revenue (Million), by Voltage 2024 & 2032
- Figure 31: South America Gas Insulated Substation Market Revenue Share (%), by Voltage 2024 & 2032
- Figure 32: South America Gas Insulated Substation Market Revenue (Million), by End-User 2024 & 2032
- Figure 33: South America Gas Insulated Substation Market Revenue Share (%), by End-User 2024 & 2032
- Figure 34: South America Gas Insulated Substation Market Revenue (Million), by Country 2024 & 2032
- Figure 35: South America Gas Insulated Substation Market Revenue Share (%), by Country 2024 & 2032
- Figure 36: Middle East and Africa Gas Insulated Substation Market Revenue (Million), by Voltage 2024 & 2032
- Figure 37: Middle East and Africa Gas Insulated Substation Market Revenue Share (%), by Voltage 2024 & 2032
- Figure 38: Middle East and Africa Gas Insulated Substation Market Revenue (Million), by End-User 2024 & 2032
- Figure 39: Middle East and Africa Gas Insulated Substation Market Revenue Share (%), by End-User 2024 & 2032
- Figure 40: Middle East and Africa Gas Insulated Substation Market Revenue (Million), by Country 2024 & 2032
- Figure 41: Middle East and Africa Gas Insulated Substation Market Revenue Share (%), by Country 2024 & 2032
List of Tables
- Table 1: Global Gas Insulated Substation Market Revenue Million Forecast, by Region 2019 & 2032
- Table 2: Global Gas Insulated Substation Market Revenue Million Forecast, by Voltage 2019 & 2032
- Table 3: Global Gas Insulated Substation Market Revenue Million Forecast, by End-User 2019 & 2032
- Table 4: Global Gas Insulated Substation Market Revenue Million Forecast, by Region 2019 & 2032
- Table 5: Global Gas Insulated Substation Market Revenue Million Forecast, by Country 2019 & 2032
- Table 6: United States Gas Insulated Substation Market Revenue (Million) Forecast, by Application 2019 & 2032
- Table 7: Canada Gas Insulated Substation Market Revenue (Million) Forecast, by Application 2019 & 2032
- Table 8: Mexico Gas Insulated Substation Market Revenue (Million) Forecast, by Application 2019 & 2032
- Table 9: Global Gas Insulated Substation Market Revenue Million Forecast, by Country 2019 & 2032
- Table 10: Germany Gas Insulated Substation Market Revenue (Million) Forecast, by Application 2019 & 2032
- Table 11: United Kingdom Gas Insulated Substation Market Revenue (Million) Forecast, by Application 2019 & 2032
- Table 12: France Gas Insulated Substation Market Revenue (Million) Forecast, by Application 2019 & 2032
- Table 13: Spain Gas Insulated Substation Market Revenue (Million) Forecast, by Application 2019 & 2032
- Table 14: Italy Gas Insulated Substation Market Revenue (Million) Forecast, by Application 2019 & 2032
- Table 15: Spain Gas Insulated Substation Market Revenue (Million) Forecast, by Application 2019 & 2032
- Table 16: Belgium Gas Insulated Substation Market Revenue (Million) Forecast, by Application 2019 & 2032
- Table 17: Netherland Gas Insulated Substation Market Revenue (Million) Forecast, by Application 2019 & 2032
- Table 18: Nordics Gas Insulated Substation Market Revenue (Million) Forecast, by Application 2019 & 2032
- Table 19: Rest of Europe Gas Insulated Substation Market Revenue (Million) Forecast, by Application 2019 & 2032
- Table 20: Global Gas Insulated Substation Market Revenue Million Forecast, by Country 2019 & 2032
- Table 21: China Gas Insulated Substation Market Revenue (Million) Forecast, by Application 2019 & 2032
- Table 22: Japan Gas Insulated Substation Market Revenue (Million) Forecast, by Application 2019 & 2032
- Table 23: India Gas Insulated Substation Market Revenue (Million) Forecast, by Application 2019 & 2032
- Table 24: South Korea Gas Insulated Substation Market Revenue (Million) Forecast, by Application 2019 & 2032
- Table 25: Southeast Asia Gas Insulated Substation Market Revenue (Million) Forecast, by Application 2019 & 2032
- Table 26: Australia Gas Insulated Substation Market Revenue (Million) Forecast, by Application 2019 & 2032
- Table 27: Indonesia Gas Insulated Substation Market Revenue (Million) Forecast, by Application 2019 & 2032
- Table 28: Phillipes Gas Insulated Substation Market Revenue (Million) Forecast, by Application 2019 & 2032
- Table 29: Singapore Gas Insulated Substation Market Revenue (Million) Forecast, by Application 2019 & 2032
- Table 30: Thailandc Gas Insulated Substation Market Revenue (Million) Forecast, by Application 2019 & 2032
- Table 31: Rest of Asia Pacific Gas Insulated Substation Market Revenue (Million) Forecast, by Application 2019 & 2032
- Table 32: Global Gas Insulated Substation Market Revenue Million Forecast, by Country 2019 & 2032
- Table 33: Brazil Gas Insulated Substation Market Revenue (Million) Forecast, by Application 2019 & 2032
- Table 34: Argentina Gas Insulated Substation Market Revenue (Million) Forecast, by Application 2019 & 2032
- Table 35: Peru Gas Insulated Substation Market Revenue (Million) Forecast, by Application 2019 & 2032
- Table 36: Chile Gas Insulated Substation Market Revenue (Million) Forecast, by Application 2019 & 2032
- Table 37: Colombia Gas Insulated Substation Market Revenue (Million) Forecast, by Application 2019 & 2032
- Table 38: Ecuador Gas Insulated Substation Market Revenue (Million) Forecast, by Application 2019 & 2032
- Table 39: Venezuela Gas Insulated Substation Market Revenue (Million) Forecast, by Application 2019 & 2032
- Table 40: Rest of South America Gas Insulated Substation Market Revenue (Million) Forecast, by Application 2019 & 2032
- Table 41: Global Gas Insulated Substation Market Revenue Million Forecast, by Country 2019 & 2032
- Table 42: United Arab Emirates Gas Insulated Substation Market Revenue (Million) Forecast, by Application 2019 & 2032
- Table 43: Saudi Arabia Gas Insulated Substation Market Revenue (Million) Forecast, by Application 2019 & 2032
- Table 44: South Africa Gas Insulated Substation Market Revenue (Million) Forecast, by Application 2019 & 2032
- Table 45: Rest of Middle East and Africa Gas Insulated Substation Market Revenue (Million) Forecast, by Application 2019 & 2032
- Table 46: Global Gas Insulated Substation Market Revenue Million Forecast, by Voltage 2019 & 2032
- Table 47: Global Gas Insulated Substation Market Revenue Million Forecast, by End-User 2019 & 2032
- Table 48: Global Gas Insulated Substation Market Revenue Million Forecast, by Country 2019 & 2032
- Table 49: Global Gas Insulated Substation Market Revenue Million Forecast, by Voltage 2019 & 2032
- Table 50: Global Gas Insulated Substation Market Revenue Million Forecast, by End-User 2019 & 2032
- Table 51: Global Gas Insulated Substation Market Revenue Million Forecast, by Country 2019 & 2032
- Table 52: Global Gas Insulated Substation Market Revenue Million Forecast, by Voltage 2019 & 2032
- Table 53: Global Gas Insulated Substation Market Revenue Million Forecast, by End-User 2019 & 2032
- Table 54: Global Gas Insulated Substation Market Revenue Million Forecast, by Country 2019 & 2032
- Table 55: Global Gas Insulated Substation Market Revenue Million Forecast, by Voltage 2019 & 2032
- Table 56: Global Gas Insulated Substation Market Revenue Million Forecast, by End-User 2019 & 2032
- Table 57: Global Gas Insulated Substation Market Revenue Million Forecast, by Country 2019 & 2032
- Table 58: Global Gas Insulated Substation Market Revenue Million Forecast, by Voltage 2019 & 2032
- Table 59: Global Gas Insulated Substation Market Revenue Million Forecast, by End-User 2019 & 2032
- Table 60: Global Gas Insulated Substation Market Revenue Million Forecast, by Country 2019 & 2032
Frequently Asked Questions
1. What is the projected Compound Annual Growth Rate (CAGR) of the Gas Insulated Substation Market?
The projected CAGR is approximately > 3.00%.
2. Which companies are prominent players in the Gas Insulated Substation Market?
Key companies in the market include ABB Ltd, Larsen & Toubro Limited, Tbea Co Ltd *List Not Exhaustive, Toshiba Corp, Hitachi Ltd, Bharat Heavy Electricals Limited, Mitsubishi Electric Corporation, Siemens AG, Schneider Electric SE, Powell Industries Inc, Elsewedy Electric Co S A E, CG Power and Industrial Solutions Ltd, General Electric Company, Hyosung Corp.
3. What are the main segments of the Gas Insulated Substation Market?
The market segments include Voltage, End-User.
4. Can you provide details about the market size?
The market size is estimated to be USD XX Million as of 2022.
5. What are some drivers contributing to market growth?
Supportive Government Policies and Incentives4.; Environmental Concerns.
6. What are the notable trends driving market growth?
Power Utilities Sector to Dominate the Market.
7. Are there any restraints impacting market growth?
Fossil Fuel Subsidies.
8. Can you provide examples of recent developments in the market?
N/A
9. What pricing options are available for accessing the report?
Pricing options include single-user, multi-user, and enterprise licenses priced at USD 4750, USD 5250, and USD 8750 respectively.
10. Is the market size provided in terms of value or volume?
The market size is provided in terms of value, measured in Million.
11. Are there any specific market keywords associated with the report?
Yes, the market keyword associated with the report is "Gas Insulated Substation Market," which aids in identifying and referencing the specific market segment covered.
12. How do I determine which pricing option suits my needs best?
The pricing options vary based on user requirements and access needs. Individual users may opt for single-user licenses, while businesses requiring broader access may choose multi-user or enterprise licenses for cost-effective access to the report.
13. Are there any additional resources or data provided in the Gas Insulated Substation Market report?
While the report offers comprehensive insights, it's advisable to review the specific contents or supplementary materials provided to ascertain if additional resources or data are available.
14. How can I stay updated on further developments or reports in the Gas Insulated Substation Market?
To stay informed about further developments, trends, and reports in the Gas Insulated Substation Market, consider subscribing to industry newsletters, following relevant companies and organizations, or regularly checking reputable industry news sources and publications.
Methodology
Step 1 - Identification of Relevant Samples Size from Population Database


Step 2 - Approaches for Defining Global Market Size (Value, Volume* & Price*)

Note*: In applicable scenarios
Step 3 - Data Sources
Primary Research
- Web Analytics
- Survey Reports
- Research Institute
- Latest Research Reports
- Opinion Leaders
Secondary Research
- Annual Reports
- White Paper
- Latest Press Release
- Industry Association
- Paid Database
- Investor Presentations

Step 4 - Data Triangulation
Involves using different sources of information in order to increase the validity of a study
These sources are likely to be stakeholders in a program - participants, other researchers, program staff, other community members, and so on.
Then we put all data in single framework & apply various statistical tools to find out the dynamic on the market.
During the analysis stage, feedback from the stakeholder groups would be compared to determine areas of agreement as well as areas of divergence


