
Key Insights
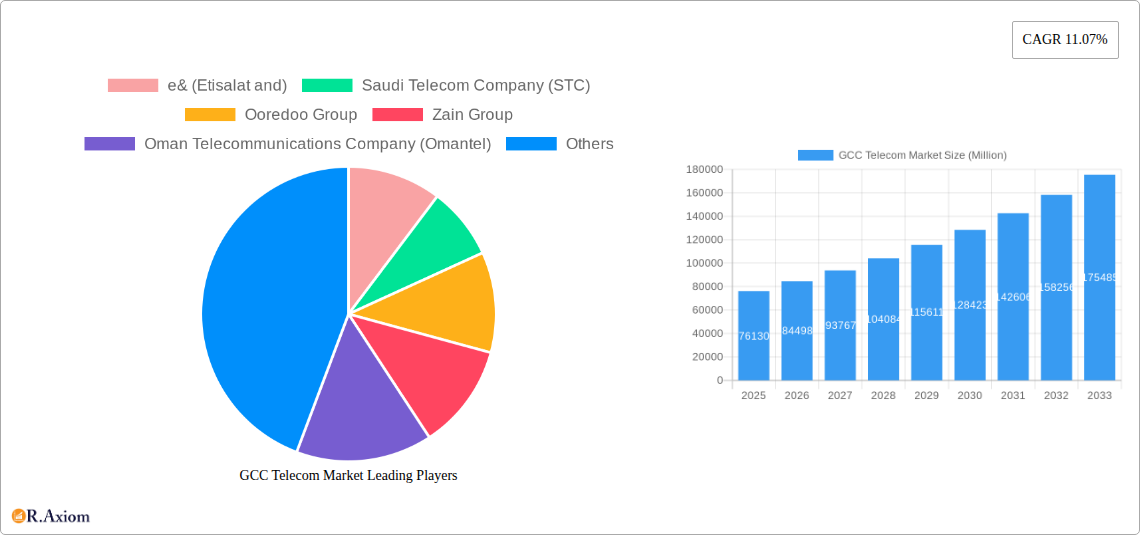
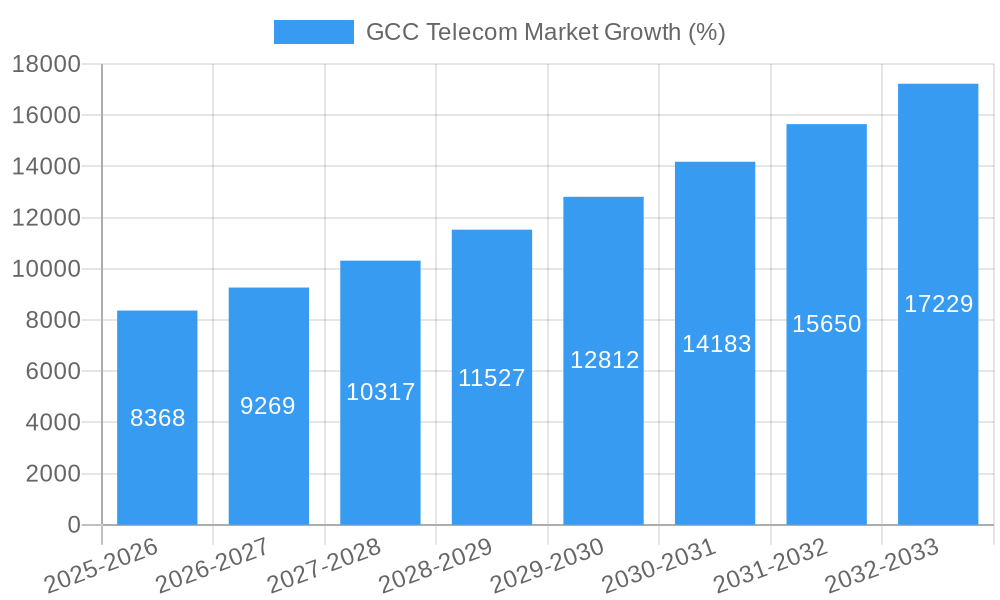
The GCC telecom market, valued at $76.13 billion in 2025, is projected to experience robust growth, exhibiting a Compound Annual Growth Rate (CAGR) of 11.07% from 2025 to 2033. This expansion is fueled by several key drivers. Increasing smartphone penetration and data consumption, particularly among the young and tech-savvy population, are significantly boosting demand for mobile data services and higher-speed internet access. Furthermore, the region's ongoing digital transformation initiatives, including the development of smart cities and the expansion of 5G networks, are creating lucrative opportunities for telecom operators. Government investments in digital infrastructure and supportive regulatory frameworks are further accelerating market growth. However, challenges remain. Intense competition among established players like Etisalat, STC, Ooredoo, Zain, Omantel, du, Mobily, and Batelco necessitates continuous innovation and investment in network infrastructure to maintain a competitive edge. Price wars and the need for continuous technological upgrades to meet evolving customer expectations pose significant restraints. The market is segmented based on service type (mobile, fixed-line, broadband), technology (4G, 5G, etc.), and customer type (residential, enterprise). Future growth will depend heavily on the successful rollout of 5G and the adoption of advanced technologies like IoT and cloud computing, creating opportunities for operators who can effectively cater to these emerging demands.
The forecast period of 2025-2033 will witness substantial shifts in market dynamics. We anticipate a continued dominance of mobile services, driven by rising mobile subscriptions and data consumption. However, the fixed-line and broadband segments are also expected to demonstrate growth, albeit at a potentially slower pace, due to increasing fiber optic network deployments and the rise of smart home technologies. The competitive landscape will likely remain highly concentrated, with the major players focusing on strategic mergers, acquisitions, and partnerships to expand their market share and service offerings. Moreover, the focus on enhancing customer experience through personalized services and advanced digital solutions will be crucial for success. The market will likely see increased investment in cybersecurity measures to address growing concerns related to data privacy and network security.
GCC Telecom Market: A Comprehensive Report (2019-2033)
This in-depth report provides a comprehensive analysis of the GCC Telecom Market, covering the period 2019-2033, with a focus on market trends, competitive landscape, and future growth prospects. The report utilizes data from 2019-2024 (historical period), with 2025 as the base year and a forecast extending to 2033. This detailed analysis is essential for telecom operators, investors, and industry stakeholders seeking to navigate this dynamic market.
GCC Telecom Market Concentration & Innovation
This section analyzes the market concentration, innovation drivers, regulatory landscape, and competitive dynamics within the GCC telecom sector. The market is characterized by a relatively concentrated landscape, dominated by a few major players, but also featuring significant competition and innovation.
Market Concentration: The GCC telecom market exhibits moderate concentration, with key players like e& (Etisalat and), Saudi Telecom Company (STC), and Ooredoo Group commanding significant market shares. Precise figures for market share are detailed within the full report. However, smaller players and new entrants continue to challenge the established order.
Innovation Drivers: Investment in 5G technology, the expansion of fiber optic networks, and the rise of digital services are driving innovation. Recent M&A activity, as detailed below, underscores the ongoing efforts to consolidate market share and enhance technological capabilities.
Regulatory Framework: Government regulations influence market access, pricing, and service offerings. The report analyzes the impact of these frameworks on market dynamics.
Product Substitutes: Over-the-top (OTT) services and alternative communication platforms present competitive pressures, influencing pricing strategies and service innovation.
End-User Trends: Increasing smartphone penetration, rising data consumption, and the growing demand for high-speed internet access are shaping market demand.
Mergers & Acquisitions (M&A): Significant M&A activity has reshaped the market landscape. The report details specific M&A deals, analyzing their impact on market consolidation and competitive dynamics. While precise deal values are detailed in the full report, the total value of M&A activity in the historical period is estimated at xx Million.
GCC Telecom Market Industry Trends & Insights
This section delves into the key trends and insights shaping the GCC telecom market, including market growth drivers, technological disruptions, consumer preferences, and competitive dynamics. The market has experienced robust growth, fueled by factors including rising mobile penetration, increasing data consumption, and government initiatives promoting digital transformation.
The Compound Annual Growth Rate (CAGR) for the historical period (2019-2024) was estimated at xx%, with a projected CAGR of xx% during the forecast period (2025-2033). Market penetration rates for various services, including mobile broadband and fixed-line services, are analyzed in detail. The full report includes detailed analysis of competitive dynamics, including pricing strategies, service differentiation, and market share evolution of key players. Consumer preferences are shifting towards higher data allowances, bundled services, and greater value for money.
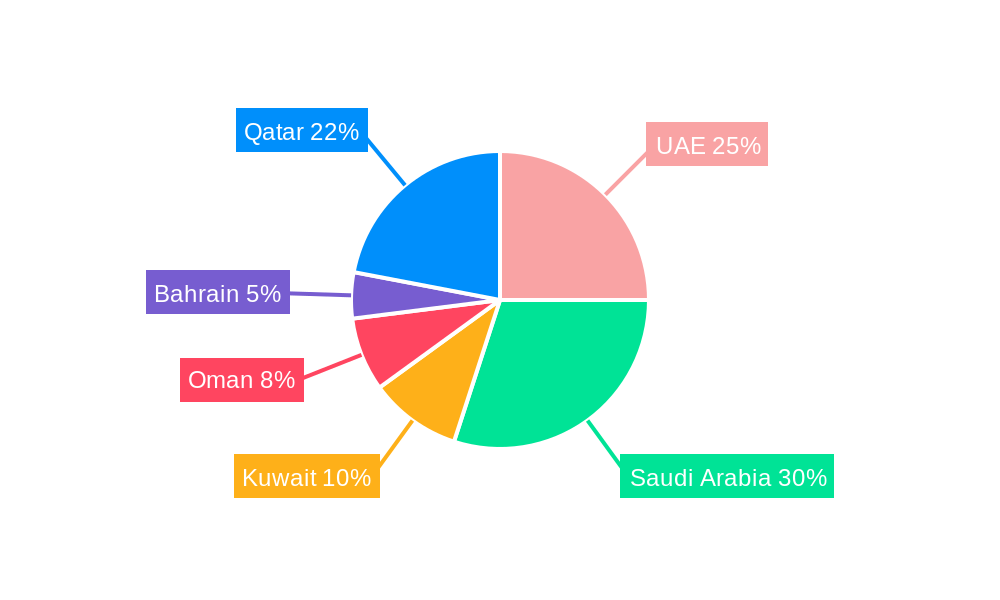
Dominant Markets & Segments in GCC Telecom Market
This section identifies the leading regions, countries, and segments within the GCC telecom market. Saudi Arabia and the UAE currently hold significant positions, driven by factors such as economic strength, robust infrastructure investment, and favorable government policies.
- Key Drivers for Dominant Markets:
- Robust Economic Growth: High GDP growth rates in leading markets fuel investment in telecom infrastructure and services.
- Government Initiatives: Government support for digital transformation and infrastructure development significantly influences market growth.
- Favorable Regulatory Environment: Clear regulatory frameworks promote market competition and investment.
The full report provides a detailed analysis of the market dominance of specific countries, including the factors responsible for their leading position.
GCC Telecom Market Product Developments
The GCC telecom market is witnessing significant product innovation, driven by technological advancements such as 5G, cloud computing, and the Internet of Things (IoT). New products and services are designed to cater to evolving consumer preferences, including higher data speeds, improved network coverage, and innovative digital solutions. The market is characterized by intense competition, driving providers to offer superior products and services to maintain their market share.
Report Scope & Segmentation Analysis
This report segments the GCC telecom market based on several key parameters, including technology (2G, 3G, 4G, 5G), service type (mobile, fixed-line, broadband), and country. Detailed growth projections, market sizes, and competitive dynamics are presented for each segment within the full report. The market is expected to witness substantial growth across all segments during the forecast period.
Key Drivers of GCC Telecom Market Growth
Several factors drive the growth of the GCC telecom market. These include:
- Technological Advancements: The deployment of 5G networks, the expansion of fiber-optic infrastructure, and advancements in cloud computing and IoT are major drivers.
- Economic Growth: Strong economic growth in the GCC region stimulates demand for advanced telecom services.
- Government Support: Government initiatives aimed at promoting digital transformation are fostering market growth.
Challenges in the GCC Telecom Market Sector
The GCC telecom market faces several challenges, including:
- Intense Competition: The highly competitive nature of the market puts pressure on profitability and requires continuous innovation.
- Regulatory Hurdles: Navigating complex regulatory frameworks can create challenges for market participants.
- Infrastructure Limitations: In some areas, limitations in network infrastructure hinder the deployment of advanced technologies.
Emerging Opportunities in GCC Telecom Market
The GCC telecom market presents several emerging opportunities, including:
- 5G Deployment: The roll-out of 5G networks creates opportunities for new services and applications.
- Growth of IoT: The increasing adoption of IoT devices presents significant growth potential for connected services.
- Expansion of Digital Services: The demand for advanced digital services, such as cloud computing and e-commerce, continues to grow.
Leading Players in the GCC Telecom Market Market
- e& (Etisalat and)
- Saudi Telecom Company (STC)
- Ooredoo Group
- Zain Group
- Oman Telecommunications Company (Omantel)
- Emirates Integrated Telecommunications Company (Du)
- Mobily (Etihad Etisalat Company)
- Batelco (Bahrain Telecommunication Company)
- List Not Exhaustive
Key Developments in GCC Telecom Market Industry
- January 2024: e& Group announced a USD 6 Billion investment over two years to enhance technology, infrastructure, and digital solutions, focusing on improved network accessibility and affordability.
- March 2024: Zain Saudi Arabia and Nokia signed a memorandum of understanding to collaborate on 5G technology development and deployment in Saudi Arabia.
Strategic Outlook for GCC Telecom Market Market
The GCC telecom market is poised for continued growth, driven by technological advancements, economic development, and increasing consumer demand for advanced telecommunications services. The strategic focus for operators will be on 5G deployment, investment in digital infrastructure, and expansion of innovative services to maintain competitiveness in this dynamic market. The potential for market expansion through new technologies and services is considerable.
GCC Telecom Market Segmentation
-
1. Overall telecom revenue
- 1.1. Telecom Subscriptions
- 1.2. Average revenue per user
-
2. Telecom services
-
2.1. Voice Services
- 2.1.1. Wired
- 2.1.2. Wireless
- 2.2. Data and Messaging Services
- 2.3. PayTV Services
-
2.1. Voice Services
-
3. Telecom connectivity
- 3.1. Fixed Network
- 3.2. Mobile Network
GCC Telecom Market Segmentation By Geography
-
1. North America
- 1.1. United States
- 1.2. Canada
- 1.3. Mexico
-
2. South America
- 2.1. Brazil
- 2.2. Argentina
- 2.3. Rest of South America
-
3. Europe
- 3.1. United Kingdom
- 3.2. Germany
- 3.3. France
- 3.4. Italy
- 3.5. Spain
- 3.6. Russia
- 3.7. Benelux
- 3.8. Nordics
- 3.9. Rest of Europe
-
4. Middle East & Africa
- 4.1. Turkey
- 4.2. Israel
- 4.3. GCC
- 4.4. North Africa
- 4.5. South Africa
- 4.6. Rest of Middle East & Africa
-
5. Asia Pacific
- 5.1. China
- 5.2. India
- 5.3. Japan
- 5.4. South Korea
- 5.5. ASEAN
- 5.6. Oceania
- 5.7. Rest of Asia Pacific
GCC Telecom Market REPORT HIGHLIGHTS
| Aspects | Details |
|---|---|
| Study Period | 2019-2033 |
| Base Year | 2024 |
| Estimated Year | 2025 |
| Forecast Period | 2025-2033 |
| Historical Period | 2019-2024 |
| Growth Rate | CAGR of 11.07% from 2019-2033 |
| Segmentation |
|
Table of Contents
- 1. Introduction
- 1.1. Research Scope
- 1.2. Market Segmentation
- 1.3. Research Methodology
- 1.4. Definitions and Assumptions
- 2. Executive Summary
- 2.1. Introduction
- 3. Market Dynamics
- 3.1. Introduction
- 3.2. Market Drivers
- 3.2.1. Huge demand for 5G; Significant penetrations of internet and smart phones; Rising digital transformation in the industries
- 3.3. Market Restrains
- 3.3.1. Huge demand for 5G; Significant penetrations of internet and smart phones; Rising digital transformation in the industries
- 3.4. Market Trends
- 3.4.1. Mobile Network is Expected to Drive the Market
- 4. Market Factor Analysis
- 4.1. Porters Five Forces
- 4.2. Supply/Value Chain
- 4.3. PESTEL analysis
- 4.4. Market Entropy
- 4.5. Patent/Trademark Analysis
- 5. Global GCC Telecom Market Analysis, Insights and Forecast, 2019-2031
- 5.1. Market Analysis, Insights and Forecast - by Overall telecom revenue
- 5.1.1. Telecom Subscriptions
- 5.1.2. Average revenue per user
- 5.2. Market Analysis, Insights and Forecast - by Telecom services
- 5.2.1. Voice Services
- 5.2.1.1. Wired
- 5.2.1.2. Wireless
- 5.2.2. Data and Messaging Services
- 5.2.3. PayTV Services
- 5.2.1. Voice Services
- 5.3. Market Analysis, Insights and Forecast - by Telecom connectivity
- 5.3.1. Fixed Network
- 5.3.2. Mobile Network
- 5.4. Market Analysis, Insights and Forecast - by Region
- 5.4.1. North America
- 5.4.2. South America
- 5.4.3. Europe
- 5.4.4. Middle East & Africa
- 5.4.5. Asia Pacific
- 5.1. Market Analysis, Insights and Forecast - by Overall telecom revenue
- 6. North America GCC Telecom Market Analysis, Insights and Forecast, 2019-2031
- 6.1. Market Analysis, Insights and Forecast - by Overall telecom revenue
- 6.1.1. Telecom Subscriptions
- 6.1.2. Average revenue per user
- 6.2. Market Analysis, Insights and Forecast - by Telecom services
- 6.2.1. Voice Services
- 6.2.1.1. Wired
- 6.2.1.2. Wireless
- 6.2.2. Data and Messaging Services
- 6.2.3. PayTV Services
- 6.2.1. Voice Services
- 6.3. Market Analysis, Insights and Forecast - by Telecom connectivity
- 6.3.1. Fixed Network
- 6.3.2. Mobile Network
- 6.1. Market Analysis, Insights and Forecast - by Overall telecom revenue
- 7. South America GCC Telecom Market Analysis, Insights and Forecast, 2019-2031
- 7.1. Market Analysis, Insights and Forecast - by Overall telecom revenue
- 7.1.1. Telecom Subscriptions
- 7.1.2. Average revenue per user
- 7.2. Market Analysis, Insights and Forecast - by Telecom services
- 7.2.1. Voice Services
- 7.2.1.1. Wired
- 7.2.1.2. Wireless
- 7.2.2. Data and Messaging Services
- 7.2.3. PayTV Services
- 7.2.1. Voice Services
- 7.3. Market Analysis, Insights and Forecast - by Telecom connectivity
- 7.3.1. Fixed Network
- 7.3.2. Mobile Network
- 7.1. Market Analysis, Insights and Forecast - by Overall telecom revenue
- 8. Europe GCC Telecom Market Analysis, Insights and Forecast, 2019-2031
- 8.1. Market Analysis, Insights and Forecast - by Overall telecom revenue
- 8.1.1. Telecom Subscriptions
- 8.1.2. Average revenue per user
- 8.2. Market Analysis, Insights and Forecast - by Telecom services
- 8.2.1. Voice Services
- 8.2.1.1. Wired
- 8.2.1.2. Wireless
- 8.2.2. Data and Messaging Services
- 8.2.3. PayTV Services
- 8.2.1. Voice Services
- 8.3. Market Analysis, Insights and Forecast - by Telecom connectivity
- 8.3.1. Fixed Network
- 8.3.2. Mobile Network
- 8.1. Market Analysis, Insights and Forecast - by Overall telecom revenue
- 9. Middle East & Africa GCC Telecom Market Analysis, Insights and Forecast, 2019-2031
- 9.1. Market Analysis, Insights and Forecast - by Overall telecom revenue
- 9.1.1. Telecom Subscriptions
- 9.1.2. Average revenue per user
- 9.2. Market Analysis, Insights and Forecast - by Telecom services
- 9.2.1. Voice Services
- 9.2.1.1. Wired
- 9.2.1.2. Wireless
- 9.2.2. Data and Messaging Services
- 9.2.3. PayTV Services
- 9.2.1. Voice Services
- 9.3. Market Analysis, Insights and Forecast - by Telecom connectivity
- 9.3.1. Fixed Network
- 9.3.2. Mobile Network
- 9.1. Market Analysis, Insights and Forecast - by Overall telecom revenue
- 10. Asia Pacific GCC Telecom Market Analysis, Insights and Forecast, 2019-2031
- 10.1. Market Analysis, Insights and Forecast - by Overall telecom revenue
- 10.1.1. Telecom Subscriptions
- 10.1.2. Average revenue per user
- 10.2. Market Analysis, Insights and Forecast - by Telecom services
- 10.2.1. Voice Services
- 10.2.1.1. Wired
- 10.2.1.2. Wireless
- 10.2.2. Data and Messaging Services
- 10.2.3. PayTV Services
- 10.2.1. Voice Services
- 10.3. Market Analysis, Insights and Forecast - by Telecom connectivity
- 10.3.1. Fixed Network
- 10.3.2. Mobile Network
- 10.1. Market Analysis, Insights and Forecast - by Overall telecom revenue
- 11. Competitive Analysis
- 11.1. Global Market Share Analysis 2024
- 11.2. Company Profiles
- 11.2.1 e& (Etisalat and)
- 11.2.1.1. Overview
- 11.2.1.2. Products
- 11.2.1.3. SWOT Analysis
- 11.2.1.4. Recent Developments
- 11.2.1.5. Financials (Based on Availability)
- 11.2.2 Saudi Telecom Company (STC)
- 11.2.2.1. Overview
- 11.2.2.2. Products
- 11.2.2.3. SWOT Analysis
- 11.2.2.4. Recent Developments
- 11.2.2.5. Financials (Based on Availability)
- 11.2.3 Ooredoo Group
- 11.2.3.1. Overview
- 11.2.3.2. Products
- 11.2.3.3. SWOT Analysis
- 11.2.3.4. Recent Developments
- 11.2.3.5. Financials (Based on Availability)
- 11.2.4 Zain Group
- 11.2.4.1. Overview
- 11.2.4.2. Products
- 11.2.4.3. SWOT Analysis
- 11.2.4.4. Recent Developments
- 11.2.4.5. Financials (Based on Availability)
- 11.2.5 Oman Telecommunications Company (Omantel)
- 11.2.5.1. Overview
- 11.2.5.2. Products
- 11.2.5.3. SWOT Analysis
- 11.2.5.4. Recent Developments
- 11.2.5.5. Financials (Based on Availability)
- 11.2.6 Emirates Integrated Telecommunications Company (Du)
- 11.2.6.1. Overview
- 11.2.6.2. Products
- 11.2.6.3. SWOT Analysis
- 11.2.6.4. Recent Developments
- 11.2.6.5. Financials (Based on Availability)
- 11.2.7 Mobily (Etihad Etisalat Company)
- 11.2.7.1. Overview
- 11.2.7.2. Products
- 11.2.7.3. SWOT Analysis
- 11.2.7.4. Recent Developments
- 11.2.7.5. Financials (Based on Availability)
- 11.2.8 Batelco (Bahrain Telecommunication Company)*List Not Exhaustive
- 11.2.8.1. Overview
- 11.2.8.2. Products
- 11.2.8.3. SWOT Analysis
- 11.2.8.4. Recent Developments
- 11.2.8.5. Financials (Based on Availability)
- 11.2.1 e& (Etisalat and)
List of Figures
- Figure 1: Global GCC Telecom Market Revenue Breakdown (Million, %) by Region 2024 & 2032
- Figure 2: Global GCC Telecom Market Volume Breakdown (Billion, %) by Region 2024 & 2032
- Figure 3: North America GCC Telecom Market Revenue (Million), by Overall telecom revenue 2024 & 2032
- Figure 4: North America GCC Telecom Market Volume (Billion), by Overall telecom revenue 2024 & 2032
- Figure 5: North America GCC Telecom Market Revenue Share (%), by Overall telecom revenue 2024 & 2032
- Figure 6: North America GCC Telecom Market Volume Share (%), by Overall telecom revenue 2024 & 2032
- Figure 7: North America GCC Telecom Market Revenue (Million), by Telecom services 2024 & 2032
- Figure 8: North America GCC Telecom Market Volume (Billion), by Telecom services 2024 & 2032
- Figure 9: North America GCC Telecom Market Revenue Share (%), by Telecom services 2024 & 2032
- Figure 10: North America GCC Telecom Market Volume Share (%), by Telecom services 2024 & 2032
- Figure 11: North America GCC Telecom Market Revenue (Million), by Telecom connectivity 2024 & 2032
- Figure 12: North America GCC Telecom Market Volume (Billion), by Telecom connectivity 2024 & 2032
- Figure 13: North America GCC Telecom Market Revenue Share (%), by Telecom connectivity 2024 & 2032
- Figure 14: North America GCC Telecom Market Volume Share (%), by Telecom connectivity 2024 & 2032
- Figure 15: North America GCC Telecom Market Revenue (Million), by Country 2024 & 2032
- Figure 16: North America GCC Telecom Market Volume (Billion), by Country 2024 & 2032
- Figure 17: North America GCC Telecom Market Revenue Share (%), by Country 2024 & 2032
- Figure 18: North America GCC Telecom Market Volume Share (%), by Country 2024 & 2032
- Figure 19: South America GCC Telecom Market Revenue (Million), by Overall telecom revenue 2024 & 2032
- Figure 20: South America GCC Telecom Market Volume (Billion), by Overall telecom revenue 2024 & 2032
- Figure 21: South America GCC Telecom Market Revenue Share (%), by Overall telecom revenue 2024 & 2032
- Figure 22: South America GCC Telecom Market Volume Share (%), by Overall telecom revenue 2024 & 2032
- Figure 23: South America GCC Telecom Market Revenue (Million), by Telecom services 2024 & 2032
- Figure 24: South America GCC Telecom Market Volume (Billion), by Telecom services 2024 & 2032
- Figure 25: South America GCC Telecom Market Revenue Share (%), by Telecom services 2024 & 2032
- Figure 26: South America GCC Telecom Market Volume Share (%), by Telecom services 2024 & 2032
- Figure 27: South America GCC Telecom Market Revenue (Million), by Telecom connectivity 2024 & 2032
- Figure 28: South America GCC Telecom Market Volume (Billion), by Telecom connectivity 2024 & 2032
- Figure 29: South America GCC Telecom Market Revenue Share (%), by Telecom connectivity 2024 & 2032
- Figure 30: South America GCC Telecom Market Volume Share (%), by Telecom connectivity 2024 & 2032
- Figure 31: South America GCC Telecom Market Revenue (Million), by Country 2024 & 2032
- Figure 32: South America GCC Telecom Market Volume (Billion), by Country 2024 & 2032
- Figure 33: South America GCC Telecom Market Revenue Share (%), by Country 2024 & 2032
- Figure 34: South America GCC Telecom Market Volume Share (%), by Country 2024 & 2032
- Figure 35: Europe GCC Telecom Market Revenue (Million), by Overall telecom revenue 2024 & 2032
- Figure 36: Europe GCC Telecom Market Volume (Billion), by Overall telecom revenue 2024 & 2032
- Figure 37: Europe GCC Telecom Market Revenue Share (%), by Overall telecom revenue 2024 & 2032
- Figure 38: Europe GCC Telecom Market Volume Share (%), by Overall telecom revenue 2024 & 2032
- Figure 39: Europe GCC Telecom Market Revenue (Million), by Telecom services 2024 & 2032
- Figure 40: Europe GCC Telecom Market Volume (Billion), by Telecom services 2024 & 2032
- Figure 41: Europe GCC Telecom Market Revenue Share (%), by Telecom services 2024 & 2032
- Figure 42: Europe GCC Telecom Market Volume Share (%), by Telecom services 2024 & 2032
- Figure 43: Europe GCC Telecom Market Revenue (Million), by Telecom connectivity 2024 & 2032
- Figure 44: Europe GCC Telecom Market Volume (Billion), by Telecom connectivity 2024 & 2032
- Figure 45: Europe GCC Telecom Market Revenue Share (%), by Telecom connectivity 2024 & 2032
- Figure 46: Europe GCC Telecom Market Volume Share (%), by Telecom connectivity 2024 & 2032
- Figure 47: Europe GCC Telecom Market Revenue (Million), by Country 2024 & 2032
- Figure 48: Europe GCC Telecom Market Volume (Billion), by Country 2024 & 2032
- Figure 49: Europe GCC Telecom Market Revenue Share (%), by Country 2024 & 2032
- Figure 50: Europe GCC Telecom Market Volume Share (%), by Country 2024 & 2032
- Figure 51: Middle East & Africa GCC Telecom Market Revenue (Million), by Overall telecom revenue 2024 & 2032
- Figure 52: Middle East & Africa GCC Telecom Market Volume (Billion), by Overall telecom revenue 2024 & 2032
- Figure 53: Middle East & Africa GCC Telecom Market Revenue Share (%), by Overall telecom revenue 2024 & 2032
- Figure 54: Middle East & Africa GCC Telecom Market Volume Share (%), by Overall telecom revenue 2024 & 2032
- Figure 55: Middle East & Africa GCC Telecom Market Revenue (Million), by Telecom services 2024 & 2032
- Figure 56: Middle East & Africa GCC Telecom Market Volume (Billion), by Telecom services 2024 & 2032
- Figure 57: Middle East & Africa GCC Telecom Market Revenue Share (%), by Telecom services 2024 & 2032
- Figure 58: Middle East & Africa GCC Telecom Market Volume Share (%), by Telecom services 2024 & 2032
- Figure 59: Middle East & Africa GCC Telecom Market Revenue (Million), by Telecom connectivity 2024 & 2032
- Figure 60: Middle East & Africa GCC Telecom Market Volume (Billion), by Telecom connectivity 2024 & 2032
- Figure 61: Middle East & Africa GCC Telecom Market Revenue Share (%), by Telecom connectivity 2024 & 2032
- Figure 62: Middle East & Africa GCC Telecom Market Volume Share (%), by Telecom connectivity 2024 & 2032
- Figure 63: Middle East & Africa GCC Telecom Market Revenue (Million), by Country 2024 & 2032
- Figure 64: Middle East & Africa GCC Telecom Market Volume (Billion), by Country 2024 & 2032
- Figure 65: Middle East & Africa GCC Telecom Market Revenue Share (%), by Country 2024 & 2032
- Figure 66: Middle East & Africa GCC Telecom Market Volume Share (%), by Country 2024 & 2032
- Figure 67: Asia Pacific GCC Telecom Market Revenue (Million), by Overall telecom revenue 2024 & 2032
- Figure 68: Asia Pacific GCC Telecom Market Volume (Billion), by Overall telecom revenue 2024 & 2032
- Figure 69: Asia Pacific GCC Telecom Market Revenue Share (%), by Overall telecom revenue 2024 & 2032
- Figure 70: Asia Pacific GCC Telecom Market Volume Share (%), by Overall telecom revenue 2024 & 2032
- Figure 71: Asia Pacific GCC Telecom Market Revenue (Million), by Telecom services 2024 & 2032
- Figure 72: Asia Pacific GCC Telecom Market Volume (Billion), by Telecom services 2024 & 2032
- Figure 73: Asia Pacific GCC Telecom Market Revenue Share (%), by Telecom services 2024 & 2032
- Figure 74: Asia Pacific GCC Telecom Market Volume Share (%), by Telecom services 2024 & 2032
- Figure 75: Asia Pacific GCC Telecom Market Revenue (Million), by Telecom connectivity 2024 & 2032
- Figure 76: Asia Pacific GCC Telecom Market Volume (Billion), by Telecom connectivity 2024 & 2032
- Figure 77: Asia Pacific GCC Telecom Market Revenue Share (%), by Telecom connectivity 2024 & 2032
- Figure 78: Asia Pacific GCC Telecom Market Volume Share (%), by Telecom connectivity 2024 & 2032
- Figure 79: Asia Pacific GCC Telecom Market Revenue (Million), by Country 2024 & 2032
- Figure 80: Asia Pacific GCC Telecom Market Volume (Billion), by Country 2024 & 2032
- Figure 81: Asia Pacific GCC Telecom Market Revenue Share (%), by Country 2024 & 2032
- Figure 82: Asia Pacific GCC Telecom Market Volume Share (%), by Country 2024 & 2032
List of Tables
- Table 1: Global GCC Telecom Market Revenue Million Forecast, by Region 2019 & 2032
- Table 2: Global GCC Telecom Market Volume Billion Forecast, by Region 2019 & 2032
- Table 3: Global GCC Telecom Market Revenue Million Forecast, by Overall telecom revenue 2019 & 2032
- Table 4: Global GCC Telecom Market Volume Billion Forecast, by Overall telecom revenue 2019 & 2032
- Table 5: Global GCC Telecom Market Revenue Million Forecast, by Telecom services 2019 & 2032
- Table 6: Global GCC Telecom Market Volume Billion Forecast, by Telecom services 2019 & 2032
- Table 7: Global GCC Telecom Market Revenue Million Forecast, by Telecom connectivity 2019 & 2032
- Table 8: Global GCC Telecom Market Volume Billion Forecast, by Telecom connectivity 2019 & 2032
- Table 9: Global GCC Telecom Market Revenue Million Forecast, by Region 2019 & 2032
- Table 10: Global GCC Telecom Market Volume Billion Forecast, by Region 2019 & 2032
- Table 11: Global GCC Telecom Market Revenue Million Forecast, by Overall telecom revenue 2019 & 2032
- Table 12: Global GCC Telecom Market Volume Billion Forecast, by Overall telecom revenue 2019 & 2032
- Table 13: Global GCC Telecom Market Revenue Million Forecast, by Telecom services 2019 & 2032
- Table 14: Global GCC Telecom Market Volume Billion Forecast, by Telecom services 2019 & 2032
- Table 15: Global GCC Telecom Market Revenue Million Forecast, by Telecom connectivity 2019 & 2032
- Table 16: Global GCC Telecom Market Volume Billion Forecast, by Telecom connectivity 2019 & 2032
- Table 17: Global GCC Telecom Market Revenue Million Forecast, by Country 2019 & 2032
- Table 18: Global GCC Telecom Market Volume Billion Forecast, by Country 2019 & 2032
- Table 19: United States GCC Telecom Market Revenue (Million) Forecast, by Application 2019 & 2032
- Table 20: United States GCC Telecom Market Volume (Billion) Forecast, by Application 2019 & 2032
- Table 21: Canada GCC Telecom Market Revenue (Million) Forecast, by Application 2019 & 2032
- Table 22: Canada GCC Telecom Market Volume (Billion) Forecast, by Application 2019 & 2032
- Table 23: Mexico GCC Telecom Market Revenue (Million) Forecast, by Application 2019 & 2032
- Table 24: Mexico GCC Telecom Market Volume (Billion) Forecast, by Application 2019 & 2032
- Table 25: Global GCC Telecom Market Revenue Million Forecast, by Overall telecom revenue 2019 & 2032
- Table 26: Global GCC Telecom Market Volume Billion Forecast, by Overall telecom revenue 2019 & 2032
- Table 27: Global GCC Telecom Market Revenue Million Forecast, by Telecom services 2019 & 2032
- Table 28: Global GCC Telecom Market Volume Billion Forecast, by Telecom services 2019 & 2032
- Table 29: Global GCC Telecom Market Revenue Million Forecast, by Telecom connectivity 2019 & 2032
- Table 30: Global GCC Telecom Market Volume Billion Forecast, by Telecom connectivity 2019 & 2032
- Table 31: Global GCC Telecom Market Revenue Million Forecast, by Country 2019 & 2032
- Table 32: Global GCC Telecom Market Volume Billion Forecast, by Country 2019 & 2032
- Table 33: Brazil GCC Telecom Market Revenue (Million) Forecast, by Application 2019 & 2032
- Table 34: Brazil GCC Telecom Market Volume (Billion) Forecast, by Application 2019 & 2032
- Table 35: Argentina GCC Telecom Market Revenue (Million) Forecast, by Application 2019 & 2032
- Table 36: Argentina GCC Telecom Market Volume (Billion) Forecast, by Application 2019 & 2032
- Table 37: Rest of South America GCC Telecom Market Revenue (Million) Forecast, by Application 2019 & 2032
- Table 38: Rest of South America GCC Telecom Market Volume (Billion) Forecast, by Application 2019 & 2032
- Table 39: Global GCC Telecom Market Revenue Million Forecast, by Overall telecom revenue 2019 & 2032
- Table 40: Global GCC Telecom Market Volume Billion Forecast, by Overall telecom revenue 2019 & 2032
- Table 41: Global GCC Telecom Market Revenue Million Forecast, by Telecom services 2019 & 2032
- Table 42: Global GCC Telecom Market Volume Billion Forecast, by Telecom services 2019 & 2032
- Table 43: Global GCC Telecom Market Revenue Million Forecast, by Telecom connectivity 2019 & 2032
- Table 44: Global GCC Telecom Market Volume Billion Forecast, by Telecom connectivity 2019 & 2032
- Table 45: Global GCC Telecom Market Revenue Million Forecast, by Country 2019 & 2032
- Table 46: Global GCC Telecom Market Volume Billion Forecast, by Country 2019 & 2032
- Table 47: United Kingdom GCC Telecom Market Revenue (Million) Forecast, by Application 2019 & 2032
- Table 48: United Kingdom GCC Telecom Market Volume (Billion) Forecast, by Application 2019 & 2032
- Table 49: Germany GCC Telecom Market Revenue (Million) Forecast, by Application 2019 & 2032
- Table 50: Germany GCC Telecom Market Volume (Billion) Forecast, by Application 2019 & 2032
- Table 51: France GCC Telecom Market Revenue (Million) Forecast, by Application 2019 & 2032
- Table 52: France GCC Telecom Market Volume (Billion) Forecast, by Application 2019 & 2032
- Table 53: Italy GCC Telecom Market Revenue (Million) Forecast, by Application 2019 & 2032
- Table 54: Italy GCC Telecom Market Volume (Billion) Forecast, by Application 2019 & 2032
- Table 55: Spain GCC Telecom Market Revenue (Million) Forecast, by Application 2019 & 2032
- Table 56: Spain GCC Telecom Market Volume (Billion) Forecast, by Application 2019 & 2032
- Table 57: Russia GCC Telecom Market Revenue (Million) Forecast, by Application 2019 & 2032
- Table 58: Russia GCC Telecom Market Volume (Billion) Forecast, by Application 2019 & 2032
- Table 59: Benelux GCC Telecom Market Revenue (Million) Forecast, by Application 2019 & 2032
- Table 60: Benelux GCC Telecom Market Volume (Billion) Forecast, by Application 2019 & 2032
- Table 61: Nordics GCC Telecom Market Revenue (Million) Forecast, by Application 2019 & 2032
- Table 62: Nordics GCC Telecom Market Volume (Billion) Forecast, by Application 2019 & 2032
- Table 63: Rest of Europe GCC Telecom Market Revenue (Million) Forecast, by Application 2019 & 2032
- Table 64: Rest of Europe GCC Telecom Market Volume (Billion) Forecast, by Application 2019 & 2032
- Table 65: Global GCC Telecom Market Revenue Million Forecast, by Overall telecom revenue 2019 & 2032
- Table 66: Global GCC Telecom Market Volume Billion Forecast, by Overall telecom revenue 2019 & 2032
- Table 67: Global GCC Telecom Market Revenue Million Forecast, by Telecom services 2019 & 2032
- Table 68: Global GCC Telecom Market Volume Billion Forecast, by Telecom services 2019 & 2032
- Table 69: Global GCC Telecom Market Revenue Million Forecast, by Telecom connectivity 2019 & 2032
- Table 70: Global GCC Telecom Market Volume Billion Forecast, by Telecom connectivity 2019 & 2032
- Table 71: Global GCC Telecom Market Revenue Million Forecast, by Country 2019 & 2032
- Table 72: Global GCC Telecom Market Volume Billion Forecast, by Country 2019 & 2032
- Table 73: Turkey GCC Telecom Market Revenue (Million) Forecast, by Application 2019 & 2032
- Table 74: Turkey GCC Telecom Market Volume (Billion) Forecast, by Application 2019 & 2032
- Table 75: Israel GCC Telecom Market Revenue (Million) Forecast, by Application 2019 & 2032
- Table 76: Israel GCC Telecom Market Volume (Billion) Forecast, by Application 2019 & 2032
- Table 77: GCC GCC Telecom Market Revenue (Million) Forecast, by Application 2019 & 2032
- Table 78: GCC GCC Telecom Market Volume (Billion) Forecast, by Application 2019 & 2032
- Table 79: North Africa GCC Telecom Market Revenue (Million) Forecast, by Application 2019 & 2032
- Table 80: North Africa GCC Telecom Market Volume (Billion) Forecast, by Application 2019 & 2032
- Table 81: South Africa GCC Telecom Market Revenue (Million) Forecast, by Application 2019 & 2032
- Table 82: South Africa GCC Telecom Market Volume (Billion) Forecast, by Application 2019 & 2032
- Table 83: Rest of Middle East & Africa GCC Telecom Market Revenue (Million) Forecast, by Application 2019 & 2032
- Table 84: Rest of Middle East & Africa GCC Telecom Market Volume (Billion) Forecast, by Application 2019 & 2032
- Table 85: Global GCC Telecom Market Revenue Million Forecast, by Overall telecom revenue 2019 & 2032
- Table 86: Global GCC Telecom Market Volume Billion Forecast, by Overall telecom revenue 2019 & 2032
- Table 87: Global GCC Telecom Market Revenue Million Forecast, by Telecom services 2019 & 2032
- Table 88: Global GCC Telecom Market Volume Billion Forecast, by Telecom services 2019 & 2032
- Table 89: Global GCC Telecom Market Revenue Million Forecast, by Telecom connectivity 2019 & 2032
- Table 90: Global GCC Telecom Market Volume Billion Forecast, by Telecom connectivity 2019 & 2032
- Table 91: Global GCC Telecom Market Revenue Million Forecast, by Country 2019 & 2032
- Table 92: Global GCC Telecom Market Volume Billion Forecast, by Country 2019 & 2032
- Table 93: China GCC Telecom Market Revenue (Million) Forecast, by Application 2019 & 2032
- Table 94: China GCC Telecom Market Volume (Billion) Forecast, by Application 2019 & 2032
- Table 95: India GCC Telecom Market Revenue (Million) Forecast, by Application 2019 & 2032
- Table 96: India GCC Telecom Market Volume (Billion) Forecast, by Application 2019 & 2032
- Table 97: Japan GCC Telecom Market Revenue (Million) Forecast, by Application 2019 & 2032
- Table 98: Japan GCC Telecom Market Volume (Billion) Forecast, by Application 2019 & 2032
- Table 99: South Korea GCC Telecom Market Revenue (Million) Forecast, by Application 2019 & 2032
- Table 100: South Korea GCC Telecom Market Volume (Billion) Forecast, by Application 2019 & 2032
- Table 101: ASEAN GCC Telecom Market Revenue (Million) Forecast, by Application 2019 & 2032
- Table 102: ASEAN GCC Telecom Market Volume (Billion) Forecast, by Application 2019 & 2032
- Table 103: Oceania GCC Telecom Market Revenue (Million) Forecast, by Application 2019 & 2032
- Table 104: Oceania GCC Telecom Market Volume (Billion) Forecast, by Application 2019 & 2032
- Table 105: Rest of Asia Pacific GCC Telecom Market Revenue (Million) Forecast, by Application 2019 & 2032
- Table 106: Rest of Asia Pacific GCC Telecom Market Volume (Billion) Forecast, by Application 2019 & 2032
Frequently Asked Questions
1. What is the projected Compound Annual Growth Rate (CAGR) of the GCC Telecom Market?
The projected CAGR is approximately 11.07%.
2. Which companies are prominent players in the GCC Telecom Market?
Key companies in the market include e& (Etisalat and), Saudi Telecom Company (STC), Ooredoo Group, Zain Group, Oman Telecommunications Company (Omantel), Emirates Integrated Telecommunications Company (Du), Mobily (Etihad Etisalat Company), Batelco (Bahrain Telecommunication Company)*List Not Exhaustive.
3. What are the main segments of the GCC Telecom Market?
The market segments include Overall telecom revenue, Telecom services, Telecom connectivity.
4. Can you provide details about the market size?
The market size is estimated to be USD 76.13 Million as of 2022.
5. What are some drivers contributing to market growth?
Huge demand for 5G; Significant penetrations of internet and smart phones; Rising digital transformation in the industries.
6. What are the notable trends driving market growth?
Mobile Network is Expected to Drive the Market.
7. Are there any restraints impacting market growth?
Huge demand for 5G; Significant penetrations of internet and smart phones; Rising digital transformation in the industries.
8. Can you provide examples of recent developments in the market?
March 2024: Zain Saudi Arabia and Nokia signed a memorandum of understanding to work together on developing 5G technology and defining a clear path for building next-generation ultra-broadband networks in Saudi Arabia. Their collaboration aims to create use cases, specify requirements, and plan deployment scenarios for 5G technologies.January 2024: e& Group announced plans to invest USD 6 billion over the next two years to enhance technology and infrastructure and boost digital solutions. e&'s aim is to provide meaningful connectivity in various emerging markets, including Saudi Arabia. The investment intends to enhance network accessibility and affordability in developing economies by expanding network coverage, improving connectivity, and ensuring access to cheaper telecommunications services.
9. What pricing options are available for accessing the report?
Pricing options include single-user, multi-user, and enterprise licenses priced at USD 3800, USD 4500, and USD 5800 respectively.
10. Is the market size provided in terms of value or volume?
The market size is provided in terms of value, measured in Million and volume, measured in Billion.
11. Are there any specific market keywords associated with the report?
Yes, the market keyword associated with the report is "GCC Telecom Market," which aids in identifying and referencing the specific market segment covered.
12. How do I determine which pricing option suits my needs best?
The pricing options vary based on user requirements and access needs. Individual users may opt for single-user licenses, while businesses requiring broader access may choose multi-user or enterprise licenses for cost-effective access to the report.
13. Are there any additional resources or data provided in the GCC Telecom Market report?
While the report offers comprehensive insights, it's advisable to review the specific contents or supplementary materials provided to ascertain if additional resources or data are available.
14. How can I stay updated on further developments or reports in the GCC Telecom Market?
To stay informed about further developments, trends, and reports in the GCC Telecom Market, consider subscribing to industry newsletters, following relevant companies and organizations, or regularly checking reputable industry news sources and publications.
Methodology
Step 1 - Identification of Relevant Samples Size from Population Database


Step 2 - Approaches for Defining Global Market Size (Value, Volume* & Price*)

Note*: In applicable scenarios
Step 3 - Data Sources
Primary Research
- Web Analytics
- Survey Reports
- Research Institute
- Latest Research Reports
- Opinion Leaders
Secondary Research
- Annual Reports
- White Paper
- Latest Press Release
- Industry Association
- Paid Database
- Investor Presentations

Step 4 - Data Triangulation
Involves using different sources of information in order to increase the validity of a study
These sources are likely to be stakeholders in a program - participants, other researchers, program staff, other community members, and so on.
Then we put all data in single framework & apply various statistical tools to find out the dynamic on the market.
During the analysis stage, feedback from the stakeholder groups would be compared to determine areas of agreement as well as areas of divergence


