
Key Insights
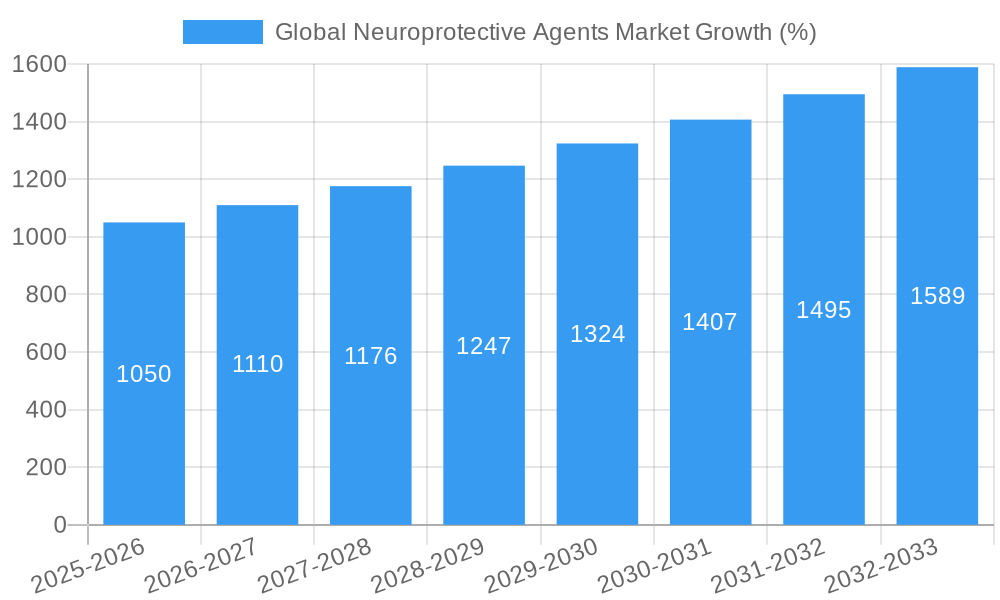
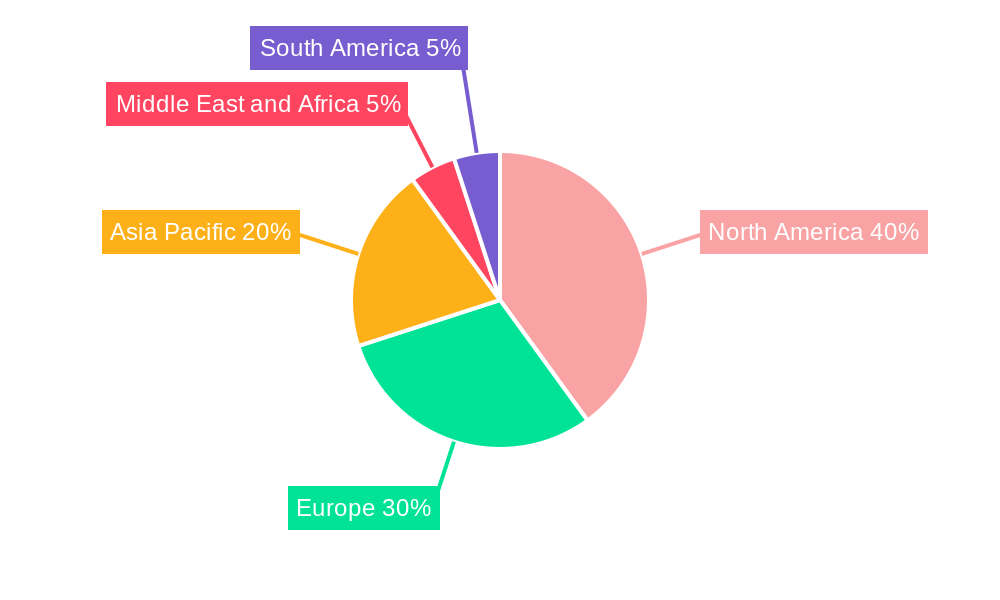
The global neuroprotective agents market is experiencing robust growth, projected to reach a substantial size by 2033, driven by a rising prevalence of neurological disorders like Alzheimer's disease, dementia, and multiple sclerosis. A 6.70% CAGR indicates a steadily expanding market, fueled by advancements in drug development, increased healthcare expenditure, and growing awareness of these debilitating conditions. The market is segmented across various distribution channels (hospital pharmacies, retail pharmacies, online pharmacies), drug classes (anesthetics, antagonists, antidepressants, cytokines), applications (Alzheimer's, dementia, epilepsy), and routes of administration (oral, topical, intravenous). The dominance of specific segments will likely shift over the forecast period, reflecting ongoing research and the emergence of novel therapies. Key players, including Sunovion Pharmaceuticals, Merck KGaA, and others, are actively engaged in research and development, contributing to market expansion through innovation and strategic collaborations. Geographic variations exist, with North America and Europe currently holding significant market shares due to higher healthcare infrastructure and advanced diagnostic capabilities. However, Asia-Pacific is projected to witness significant growth, driven by rising healthcare expenditure and an expanding geriatric population. The market faces challenges including high research and development costs, stringent regulatory approvals, and potential side effects associated with some neuroprotective agents.
Despite these restraints, the continuous rise in neurological disorders globally and the significant unmet medical needs are expected to continue driving market growth throughout the forecast period (2025-2033). The increasing focus on personalized medicine and the development of targeted therapies offer promising avenues for future growth. Furthermore, the expansion of online pharmacies provides a new dimension to market accessibility and convenience. The competitive landscape is dynamic, with both established pharmaceutical giants and emerging biotech companies vying for market share through innovation and strategic partnerships. Continuous monitoring of evolving treatment paradigms and technological breakthroughs is crucial for stakeholders to capitalize on the market's potential. Successful navigation of regulatory hurdles and the effective management of potential side effects are vital for ensuring long-term market sustainability and patient safety.
Global Neuroprotective Agents Market: A Comprehensive Report (2019-2033)
This in-depth report provides a comprehensive analysis of the global neuroprotective agents market, covering market size, segmentation, growth drivers, challenges, opportunities, and key players. The study period spans from 2019 to 2033, with 2025 serving as the base and estimated year. The report utilizes rigorous data analysis and industry expertise to deliver actionable insights for stakeholders across the pharmaceutical and healthcare sectors. The market is valued at xx Million in 2025 and is projected to reach xx Million by 2033, exhibiting a CAGR of xx% during the forecast period (2025-2033).
Global Neuroprotective Agents Market Market Concentration & Innovation
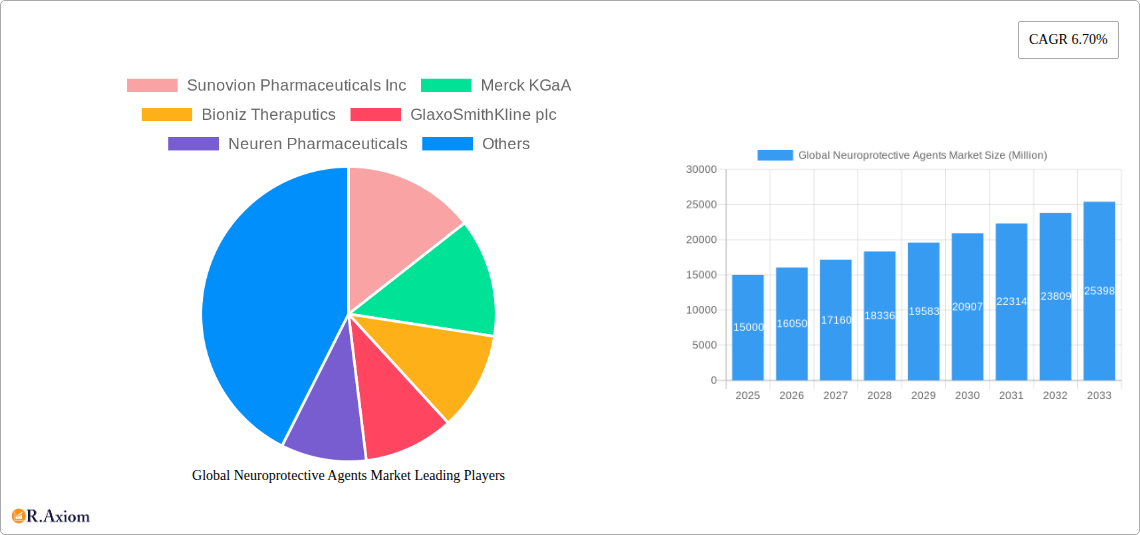
The global neuroprotective agents market exhibits a moderately concentrated landscape, with several multinational pharmaceutical companies holding significant market share. Market concentration is influenced by factors such as R&D investments, regulatory approvals, and successful product launches. Major players such as Merck KGaA, GlaxoSmithKline plc, and Pfizer Inc compete through innovation, focusing on developing novel neuroprotective agents with enhanced efficacy and safety profiles. The market share of the top 5 players is estimated to be around xx% in 2025.
Innovation in neuroprotective agents is driven by advancements in neuroscience research, particularly in understanding the mechanisms of neurodegeneration and neuroprotection. This includes the development of novel drug targets, advanced drug delivery systems, and personalized medicine approaches. The regulatory framework plays a crucial role, with stringent approval processes impacting the speed of new product introductions. The market also witnesses constant activity in mergers and acquisitions (M&A). The total value of M&A deals in the neuroprotective agents market from 2019 to 2024 is estimated at xx Million. Key examples include strategic collaborations between established pharmaceutical companies and smaller biotech firms to accelerate drug development and commercialization. Furthermore, substitute therapies, such as lifestyle modifications and alternative medicine approaches, present indirect competition, influencing market growth. Consumer preferences are increasingly shifting toward more personalized and targeted therapies, driving the demand for tailored neuroprotective agents.
- Key Factors: R&D investment, Regulatory Approvals, M&A Activity, Product Substitutes, Consumer Preferences.
- Metrics: Market share, M&A deal values (xx Million from 2019-2024).
Global Neuroprotective Agents Market Industry Trends & Insights
The global neuroprotective agents market is experiencing robust growth fueled by several key trends. The increasing prevalence of neurodegenerative diseases, such as Alzheimer's disease and Parkinson's disease, coupled with an aging global population, significantly drives market expansion. Technological advancements, particularly in drug discovery and development, are leading to the emergence of novel neuroprotective agents with improved efficacy and safety profiles. The market penetration of these newer agents is expected to be around xx% by 2033. The consumer preference for non-invasive treatments and improved patient outcomes significantly influences the market dynamics. Competitive dynamics are characterized by both intense rivalry among established players and the emergence of innovative biotech companies. This competitive landscape results in continuous innovation, improved treatment options, and potentially reduced treatment costs. The market is also influenced by healthcare policies that focus on improved access to advanced therapies.
Technological disruptions, particularly advancements in artificial intelligence (AI) and machine learning, are being integrated into drug discovery and development, accelerating the pace of innovation. Furthermore, personalized medicine approaches are gaining traction, with the development of targeted therapies tailored to individual genetic profiles and disease stages. The significant rise in awareness regarding the risks and benefits of various neuroprotective agents amongst the consumers are also a driving factor for the growth of this market.
Dominant Markets & Segments in Global Neuroprotective Agents Market
The North American region currently dominates the global neuroprotective agents market, owing to higher healthcare expenditure, advanced healthcare infrastructure, and increased prevalence of neurodegenerative disorders. Within North America, the United States holds a significant market share. Other regions, particularly Europe and Asia-Pacific, are also experiencing significant growth, driven by increasing awareness of neuroprotective agents, growing investment in healthcare, and rising prevalence of neurodegenerative diseases.
- By Distribution Channel: Hospital pharmacies currently hold the largest market share, followed by retail pharmacies and drug stores. Online pharmacies are emerging as a significant segment, driven by increased internet penetration and convenience.
- By Drug Class: Antagonists and antidepressants currently make up the largest drug class segment in this market.
- By Application: Alzheimer's disease and dementia account for a substantial portion of the market share due to high prevalence.
- By Route of Administration: Oral administration currently dominates, driven by patient convenience, but the intravenous and epidural route segments are also exhibiting significant growth.
Key Drivers:
- North America: High healthcare expenditure, advanced healthcare infrastructure, high prevalence of neurodegenerative diseases.
- Europe: Growing geriatric population, increasing healthcare expenditure, rising awareness of neuroprotective agents.
- Asia-Pacific: Increasing prevalence of neurodegenerative diseases, rising disposable incomes, growing investment in healthcare infrastructure.
Global Neuroprotective Agents Market Product Developments
Significant advancements in neuroprotective agent development involve the emergence of novel drug targets, improved drug delivery systems, and personalized medicine approaches. This includes the development of drugs that target specific pathways involved in neurodegeneration, such as amyloid-beta plaques in Alzheimer's disease. Furthermore, innovative drug delivery systems, such as targeted drug delivery and nanotechnology-based approaches, aim to improve drug efficacy and minimize side effects. The market fit for these new developments is largely driven by the unmet medical needs in the treatment of neurodegenerative diseases and the demand for effective and safe therapies.
Report Scope & Segmentation Analysis
This report segments the global neuroprotective agents market by distribution channel (Hospital Pharmacies, Retail Pharmacies, Drug Stores, Online Pharmacies), drug class (Anesthetics, Antagonists, Antidepressants, Cytokines, Others), application (Alzheimer's disease, Dementia, Epilepsy, Multiple sclerosis, Others), and route of administration (Oral, Topical, Epidural, Intravenous). Each segment is analyzed in detail, providing growth projections, market size estimates, and competitive dynamics for the forecast period (2025-2033). The market size and growth projections for each segment are estimated based on current market trends, industry forecasts, and expert opinions. Competitive analysis assesses the market share, product portfolio, and strategic initiatives of key players within each segment.
Key Drivers of Global Neuroprotective Agents Market Growth
Several key factors drive the growth of the global neuroprotective agents market. The increasing prevalence of neurodegenerative diseases, particularly Alzheimer's disease and dementia, among the aging global population is a primary driver. Technological advancements in drug discovery and development are leading to the introduction of novel and more effective neuroprotective agents. Rising healthcare expenditure and improved healthcare infrastructure in many regions also fuel market growth. Favorable regulatory policies that support the development and commercialization of new neuroprotective agents contribute to market expansion.
Challenges in the Global Neuroprotective Agents Market Sector
The global neuroprotective agents market faces several challenges. Stringent regulatory requirements for drug approval can increase the time and cost associated with bringing new products to market. Supply chain disruptions and fluctuations in raw material costs can affect the production and pricing of neuroprotective agents. Intense competition among existing pharmaceutical companies and the emergence of new players in the market create competitive pressures. Furthermore, limited reimbursement coverage and high treatment costs can limit access to neuroprotective agents for certain patient populations. These challenges impact the overall market growth and profitability of companies operating within this sector. The estimated impact of regulatory hurdles on market growth is approximately xx% in the next 5 years.
Emerging Opportunities in Global Neuroprotective Agents Market
The global neuroprotective agents market presents several promising opportunities. The growing adoption of personalized medicine, using patient-specific genetic profiles for treatment, offers significant growth potential. The development of innovative drug delivery systems to improve therapeutic efficacy and minimize side effects presents an exciting opportunity. Emerging markets in developing countries with rising healthcare expenditure are presenting new avenues for market growth. Furthermore, the development of combination therapies, combining neuroprotective agents with other therapeutic modalities, offers potential for enhanced treatment outcomes.
Leading Players in the Global Neuroprotective Agents Market Market
- Sunovion Pharmaceuticals Inc
- Merck KGaA
- Bioniz Theraputics
- GlaxoSmithKline plc
- Neuren Pharmaceuticals
- Teva Pharmaceutical Industries Ltd
- Novartis Pharmaceuticals Corporation
- Sun Pharmaceutical Industries Ltd
- Genervon Biopharmaceuticals LLC
- Hikma Pharmaceuticals PLC
- Pfizer Inc
Key Developments in Global Neuroprotective Agents Market Industry
- August 2022: BrainStorm submitted a Biologics License Application (BLA) to the Food and Drug Administration for NurOwn as a potential treatment for ALS. This development significantly impacts the ALS treatment landscape and could potentially broaden the market for neuroprotective agents.
- August 2022: Incannex Healthcare engaged contract research, development, and manufacturing firm Curia Global to scale up the manufacture of its proprietary pharmaceutical cannabis-based product IHL-216A for the treatment of concussion and traumatic brain injury. This signifies a significant step towards bringing a novel neuroprotective agent into the market, potentially expanding treatment options and market size.
Strategic Outlook for Global Neuroprotective Agents Market Market
The future of the global neuroprotective agents market appears promising, driven by several key factors. Continued advancements in neuroscience research and drug development will lead to the introduction of more effective and safer therapies for neurodegenerative diseases. The growing prevalence of neurodegenerative diseases among an aging global population will drive demand for these agents. Increased investment in research and development by pharmaceutical companies and government agencies will accelerate innovation in the field. Furthermore, favorable regulatory policies supporting the development of new neuroprotective agents will create a supportive environment for market expansion, leading to significant growth in the forecast period.
Global Neuroprotective Agents Market Segmentation
-
1. Drug Class
- 1.1. Anesthetics
- 1.2. Antagonists
- 1.3. Antidepressants
- 1.4. Cytokines
-
2. Application
- 2.1. Alzheimer's disease
- 2.2. Dementia
- 2.3. Epilepsy
- 2.4. Multiple sclerosis
-
3. Route of Administration
- 3.1. Oral
- 3.2. Topical
- 3.3. Epidural
- 3.4. Intravenous
-
4. Distribution Cahnnel
- 4.1. Hospital Pharmacies
- 4.2. Retail Pharmacies
- 4.3. Drug Stores
- 4.4. Online Pharmacies
Global Neuroprotective Agents Market Segmentation By Geography
-
1. North America
- 1.1. United States
- 1.2. Canada
- 1.3. Mexico
-
2. Europe
- 2.1. Germany
- 2.2. United Kingdom
- 2.3. France
- 2.4. Italy
- 2.5. Spain
- 2.6. Rest of Europe
-
3. Asia Pacific
- 3.1. China
- 3.2. Japan
- 3.3. India
- 3.4. Australia
- 3.5. South Korea
- 3.6. Rest of Asia Pacific
-
4. Middle East and Africa
- 4.1. GCC
- 4.2. South Africa
- 4.3. Rest of Middle East and Africa
-
5. South America
- 5.1. Brazil
- 5.2. Argentina
- 5.3. Rest of South America
Global Neuroprotective Agents Market REPORT HIGHLIGHTS
| Aspects | Details |
|---|---|
| Study Period | 2019-2033 |
| Base Year | 2024 |
| Estimated Year | 2025 |
| Forecast Period | 2025-2033 |
| Historical Period | 2019-2024 |
| Growth Rate | CAGR of 6.70% from 2019-2033 |
| Segmentation |
|
Table of Contents
- 1. Introduction
- 1.1. Research Scope
- 1.2. Market Segmentation
- 1.3. Research Methodology
- 1.4. Definitions and Assumptions
- 2. Executive Summary
- 2.1. Introduction
- 3. Market Dynamics
- 3.1. Introduction
- 3.2. Market Drivers
- 3.2.1. Increase in Incidence and Prevalence of Neurodegenerative Diseases; Increase in Stroke and Traumatic Central Nervous System Injuries; Rising Awareness for Neuroprotective Agents
- 3.3. Market Restrains
- 3.3.1. Failure of Clinical Trails in Neuroprotective Productline.; Strigent Regulatory Approvals
- 3.4. Market Trends
- 3.4.1. The Alzheimer's disease Segment is Expected to Hold a Major Market Share in the Neuroprotective Agents Market
- 4. Market Factor Analysis
- 4.1. Porters Five Forces
- 4.2. Supply/Value Chain
- 4.3. PESTEL analysis
- 4.4. Market Entropy
- 4.5. Patent/Trademark Analysis
- 5. Global Neuroprotective Agents Market Analysis, Insights and Forecast, 2019-2031
- 5.1. Market Analysis, Insights and Forecast - by Drug Class
- 5.1.1. Anesthetics
- 5.1.2. Antagonists
- 5.1.3. Antidepressants
- 5.1.4. Cytokines
- 5.2. Market Analysis, Insights and Forecast - by Application
- 5.2.1. Alzheimer's disease
- 5.2.2. Dementia
- 5.2.3. Epilepsy
- 5.2.4. Multiple sclerosis
- 5.3. Market Analysis, Insights and Forecast - by Route of Administration
- 5.3.1. Oral
- 5.3.2. Topical
- 5.3.3. Epidural
- 5.3.4. Intravenous
- 5.4. Market Analysis, Insights and Forecast - by Distribution Cahnnel
- 5.4.1. Hospital Pharmacies
- 5.4.2. Retail Pharmacies
- 5.4.3. Drug Stores
- 5.4.4. Online Pharmacies
- 5.5. Market Analysis, Insights and Forecast - by Region
- 5.5.1. North America
- 5.5.2. Europe
- 5.5.3. Asia Pacific
- 5.5.4. Middle East and Africa
- 5.5.5. South America
- 5.1. Market Analysis, Insights and Forecast - by Drug Class
- 6. North America Global Neuroprotective Agents Market Analysis, Insights and Forecast, 2019-2031
- 6.1. Market Analysis, Insights and Forecast - by Drug Class
- 6.1.1. Anesthetics
- 6.1.2. Antagonists
- 6.1.3. Antidepressants
- 6.1.4. Cytokines
- 6.2. Market Analysis, Insights and Forecast - by Application
- 6.2.1. Alzheimer's disease
- 6.2.2. Dementia
- 6.2.3. Epilepsy
- 6.2.4. Multiple sclerosis
- 6.3. Market Analysis, Insights and Forecast - by Route of Administration
- 6.3.1. Oral
- 6.3.2. Topical
- 6.3.3. Epidural
- 6.3.4. Intravenous
- 6.4. Market Analysis, Insights and Forecast - by Distribution Cahnnel
- 6.4.1. Hospital Pharmacies
- 6.4.2. Retail Pharmacies
- 6.4.3. Drug Stores
- 6.4.4. Online Pharmacies
- 6.1. Market Analysis, Insights and Forecast - by Drug Class
- 7. Europe Global Neuroprotective Agents Market Analysis, Insights and Forecast, 2019-2031
- 7.1. Market Analysis, Insights and Forecast - by Drug Class
- 7.1.1. Anesthetics
- 7.1.2. Antagonists
- 7.1.3. Antidepressants
- 7.1.4. Cytokines
- 7.2. Market Analysis, Insights and Forecast - by Application
- 7.2.1. Alzheimer's disease
- 7.2.2. Dementia
- 7.2.3. Epilepsy
- 7.2.4. Multiple sclerosis
- 7.3. Market Analysis, Insights and Forecast - by Route of Administration
- 7.3.1. Oral
- 7.3.2. Topical
- 7.3.3. Epidural
- 7.3.4. Intravenous
- 7.4. Market Analysis, Insights and Forecast - by Distribution Cahnnel
- 7.4.1. Hospital Pharmacies
- 7.4.2. Retail Pharmacies
- 7.4.3. Drug Stores
- 7.4.4. Online Pharmacies
- 7.1. Market Analysis, Insights and Forecast - by Drug Class
- 8. Asia Pacific Global Neuroprotective Agents Market Analysis, Insights and Forecast, 2019-2031
- 8.1. Market Analysis, Insights and Forecast - by Drug Class
- 8.1.1. Anesthetics
- 8.1.2. Antagonists
- 8.1.3. Antidepressants
- 8.1.4. Cytokines
- 8.2. Market Analysis, Insights and Forecast - by Application
- 8.2.1. Alzheimer's disease
- 8.2.2. Dementia
- 8.2.3. Epilepsy
- 8.2.4. Multiple sclerosis
- 8.3. Market Analysis, Insights and Forecast - by Route of Administration
- 8.3.1. Oral
- 8.3.2. Topical
- 8.3.3. Epidural
- 8.3.4. Intravenous
- 8.4. Market Analysis, Insights and Forecast - by Distribution Cahnnel
- 8.4.1. Hospital Pharmacies
- 8.4.2. Retail Pharmacies
- 8.4.3. Drug Stores
- 8.4.4. Online Pharmacies
- 8.1. Market Analysis, Insights and Forecast - by Drug Class
- 9. Middle East and Africa Global Neuroprotective Agents Market Analysis, Insights and Forecast, 2019-2031
- 9.1. Market Analysis, Insights and Forecast - by Drug Class
- 9.1.1. Anesthetics
- 9.1.2. Antagonists
- 9.1.3. Antidepressants
- 9.1.4. Cytokines
- 9.2. Market Analysis, Insights and Forecast - by Application
- 9.2.1. Alzheimer's disease
- 9.2.2. Dementia
- 9.2.3. Epilepsy
- 9.2.4. Multiple sclerosis
- 9.3. Market Analysis, Insights and Forecast - by Route of Administration
- 9.3.1. Oral
- 9.3.2. Topical
- 9.3.3. Epidural
- 9.3.4. Intravenous
- 9.4. Market Analysis, Insights and Forecast - by Distribution Cahnnel
- 9.4.1. Hospital Pharmacies
- 9.4.2. Retail Pharmacies
- 9.4.3. Drug Stores
- 9.4.4. Online Pharmacies
- 9.1. Market Analysis, Insights and Forecast - by Drug Class
- 10. South America Global Neuroprotective Agents Market Analysis, Insights and Forecast, 2019-2031
- 10.1. Market Analysis, Insights and Forecast - by Drug Class
- 10.1.1. Anesthetics
- 10.1.2. Antagonists
- 10.1.3. Antidepressants
- 10.1.4. Cytokines
- 10.2. Market Analysis, Insights and Forecast - by Application
- 10.2.1. Alzheimer's disease
- 10.2.2. Dementia
- 10.2.3. Epilepsy
- 10.2.4. Multiple sclerosis
- 10.3. Market Analysis, Insights and Forecast - by Route of Administration
- 10.3.1. Oral
- 10.3.2. Topical
- 10.3.3. Epidural
- 10.3.4. Intravenous
- 10.4. Market Analysis, Insights and Forecast - by Distribution Cahnnel
- 10.4.1. Hospital Pharmacies
- 10.4.2. Retail Pharmacies
- 10.4.3. Drug Stores
- 10.4.4. Online Pharmacies
- 10.1. Market Analysis, Insights and Forecast - by Drug Class
- 11. North America Global Neuroprotective Agents Market Analysis, Insights and Forecast, 2019-2031
- 11.1. Market Analysis, Insights and Forecast - By Country/Sub-region
- 11.1.1 United States
- 11.1.2 Canada
- 11.1.3 Mexico
- 12. Europe Global Neuroprotective Agents Market Analysis, Insights and Forecast, 2019-2031
- 12.1. Market Analysis, Insights and Forecast - By Country/Sub-region
- 12.1.1 Germany
- 12.1.2 United Kingdom
- 12.1.3 France
- 12.1.4 Italy
- 12.1.5 Spain
- 12.1.6 Rest of Europe
- 13. Asia Pacific Global Neuroprotective Agents Market Analysis, Insights and Forecast, 2019-2031
- 13.1. Market Analysis, Insights and Forecast - By Country/Sub-region
- 13.1.1 China
- 13.1.2 Japan
- 13.1.3 India
- 13.1.4 Australia
- 13.1.5 South Korea
- 13.1.6 Rest of Asia Pacific
- 14. Middle East and Africa Global Neuroprotective Agents Market Analysis, Insights and Forecast, 2019-2031
- 14.1. Market Analysis, Insights and Forecast - By Country/Sub-region
- 14.1.1 GCC
- 14.1.2 South Africa
- 14.1.3 Rest of Middle East and Africa
- 15. South America Global Neuroprotective Agents Market Analysis, Insights and Forecast, 2019-2031
- 15.1. Market Analysis, Insights and Forecast - By Country/Sub-region
- 15.1.1 Brazil
- 15.1.2 Argentina
- 15.1.3 Rest of South America
- 16. Competitive Analysis
- 16.1. Market Share Analysis 2024
- 16.2. Company Profiles
- 16.2.1 Sunovion Pharmaceuticals Inc
- 16.2.1.1. Overview
- 16.2.1.2. Products
- 16.2.1.3. SWOT Analysis
- 16.2.1.4. Recent Developments
- 16.2.1.5. Financials (Based on Availability)
- 16.2.2 Merck KGaA
- 16.2.2.1. Overview
- 16.2.2.2. Products
- 16.2.2.3. SWOT Analysis
- 16.2.2.4. Recent Developments
- 16.2.2.5. Financials (Based on Availability)
- 16.2.3 Bioniz Theraputics
- 16.2.3.1. Overview
- 16.2.3.2. Products
- 16.2.3.3. SWOT Analysis
- 16.2.3.4. Recent Developments
- 16.2.3.5. Financials (Based on Availability)
- 16.2.4 GlaxoSmithKline plc
- 16.2.4.1. Overview
- 16.2.4.2. Products
- 16.2.4.3. SWOT Analysis
- 16.2.4.4. Recent Developments
- 16.2.4.5. Financials (Based on Availability)
- 16.2.5 Neuren Pharmaceuticals
- 16.2.5.1. Overview
- 16.2.5.2. Products
- 16.2.5.3. SWOT Analysis
- 16.2.5.4. Recent Developments
- 16.2.5.5. Financials (Based on Availability)
- 16.2.6 Teva Pharmaceutical Industries Ltd
- 16.2.6.1. Overview
- 16.2.6.2. Products
- 16.2.6.3. SWOT Analysis
- 16.2.6.4. Recent Developments
- 16.2.6.5. Financials (Based on Availability)
- 16.2.7 Novartis Pharmaceuticals Corporation
- 16.2.7.1. Overview
- 16.2.7.2. Products
- 16.2.7.3. SWOT Analysis
- 16.2.7.4. Recent Developments
- 16.2.7.5. Financials (Based on Availability)
- 16.2.8 Sun Pharmaceutical Industries Ltd
- 16.2.8.1. Overview
- 16.2.8.2. Products
- 16.2.8.3. SWOT Analysis
- 16.2.8.4. Recent Developments
- 16.2.8.5. Financials (Based on Availability)
- 16.2.9 Genervon Biopharmaceuticals LLC
- 16.2.9.1. Overview
- 16.2.9.2. Products
- 16.2.9.3. SWOT Analysis
- 16.2.9.4. Recent Developments
- 16.2.9.5. Financials (Based on Availability)
- 16.2.10 Hikma Pharmaceuticals PLC
- 16.2.10.1. Overview
- 16.2.10.2. Products
- 16.2.10.3. SWOT Analysis
- 16.2.10.4. Recent Developments
- 16.2.10.5. Financials (Based on Availability)
- 16.2.11 Pfizer Inc
- 16.2.11.1. Overview
- 16.2.11.2. Products
- 16.2.11.3. SWOT Analysis
- 16.2.11.4. Recent Developments
- 16.2.11.5. Financials (Based on Availability)
- 16.2.1 Sunovion Pharmaceuticals Inc
List of Figures
- Figure 1: Global Global Neuroprotective Agents Market Revenue Breakdown (Million, %) by Region 2024 & 2032
- Figure 2: Global Global Neuroprotective Agents Market Volume Breakdown (K Unit, %) by Region 2024 & 2032
- Figure 3: North America Global Neuroprotective Agents Market Revenue (Million), by Country 2024 & 2032
- Figure 4: North America Global Neuroprotective Agents Market Volume (K Unit), by Country 2024 & 2032
- Figure 5: North America Global Neuroprotective Agents Market Revenue Share (%), by Country 2024 & 2032
- Figure 6: North America Global Neuroprotective Agents Market Volume Share (%), by Country 2024 & 2032
- Figure 7: Europe Global Neuroprotective Agents Market Revenue (Million), by Country 2024 & 2032
- Figure 8: Europe Global Neuroprotective Agents Market Volume (K Unit), by Country 2024 & 2032
- Figure 9: Europe Global Neuroprotective Agents Market Revenue Share (%), by Country 2024 & 2032
- Figure 10: Europe Global Neuroprotective Agents Market Volume Share (%), by Country 2024 & 2032
- Figure 11: Asia Pacific Global Neuroprotective Agents Market Revenue (Million), by Country 2024 & 2032
- Figure 12: Asia Pacific Global Neuroprotective Agents Market Volume (K Unit), by Country 2024 & 2032
- Figure 13: Asia Pacific Global Neuroprotective Agents Market Revenue Share (%), by Country 2024 & 2032
- Figure 14: Asia Pacific Global Neuroprotective Agents Market Volume Share (%), by Country 2024 & 2032
- Figure 15: Middle East and Africa Global Neuroprotective Agents Market Revenue (Million), by Country 2024 & 2032
- Figure 16: Middle East and Africa Global Neuroprotective Agents Market Volume (K Unit), by Country 2024 & 2032
- Figure 17: Middle East and Africa Global Neuroprotective Agents Market Revenue Share (%), by Country 2024 & 2032
- Figure 18: Middle East and Africa Global Neuroprotective Agents Market Volume Share (%), by Country 2024 & 2032
- Figure 19: South America Global Neuroprotective Agents Market Revenue (Million), by Country 2024 & 2032
- Figure 20: South America Global Neuroprotective Agents Market Volume (K Unit), by Country 2024 & 2032
- Figure 21: South America Global Neuroprotective Agents Market Revenue Share (%), by Country 2024 & 2032
- Figure 22: South America Global Neuroprotective Agents Market Volume Share (%), by Country 2024 & 2032
- Figure 23: North America Global Neuroprotective Agents Market Revenue (Million), by Drug Class 2024 & 2032
- Figure 24: North America Global Neuroprotective Agents Market Volume (K Unit), by Drug Class 2024 & 2032
- Figure 25: North America Global Neuroprotective Agents Market Revenue Share (%), by Drug Class 2024 & 2032
- Figure 26: North America Global Neuroprotective Agents Market Volume Share (%), by Drug Class 2024 & 2032
- Figure 27: North America Global Neuroprotective Agents Market Revenue (Million), by Application 2024 & 2032
- Figure 28: North America Global Neuroprotective Agents Market Volume (K Unit), by Application 2024 & 2032
- Figure 29: North America Global Neuroprotective Agents Market Revenue Share (%), by Application 2024 & 2032
- Figure 30: North America Global Neuroprotective Agents Market Volume Share (%), by Application 2024 & 2032
- Figure 31: North America Global Neuroprotective Agents Market Revenue (Million), by Route of Administration 2024 & 2032
- Figure 32: North America Global Neuroprotective Agents Market Volume (K Unit), by Route of Administration 2024 & 2032
- Figure 33: North America Global Neuroprotective Agents Market Revenue Share (%), by Route of Administration 2024 & 2032
- Figure 34: North America Global Neuroprotective Agents Market Volume Share (%), by Route of Administration 2024 & 2032
- Figure 35: North America Global Neuroprotective Agents Market Revenue (Million), by Distribution Cahnnel 2024 & 2032
- Figure 36: North America Global Neuroprotective Agents Market Volume (K Unit), by Distribution Cahnnel 2024 & 2032
- Figure 37: North America Global Neuroprotective Agents Market Revenue Share (%), by Distribution Cahnnel 2024 & 2032
- Figure 38: North America Global Neuroprotective Agents Market Volume Share (%), by Distribution Cahnnel 2024 & 2032
- Figure 39: North America Global Neuroprotective Agents Market Revenue (Million), by Country 2024 & 2032
- Figure 40: North America Global Neuroprotective Agents Market Volume (K Unit), by Country 2024 & 2032
- Figure 41: North America Global Neuroprotective Agents Market Revenue Share (%), by Country 2024 & 2032
- Figure 42: North America Global Neuroprotective Agents Market Volume Share (%), by Country 2024 & 2032
- Figure 43: Europe Global Neuroprotective Agents Market Revenue (Million), by Drug Class 2024 & 2032
- Figure 44: Europe Global Neuroprotective Agents Market Volume (K Unit), by Drug Class 2024 & 2032
- Figure 45: Europe Global Neuroprotective Agents Market Revenue Share (%), by Drug Class 2024 & 2032
- Figure 46: Europe Global Neuroprotective Agents Market Volume Share (%), by Drug Class 2024 & 2032
- Figure 47: Europe Global Neuroprotective Agents Market Revenue (Million), by Application 2024 & 2032
- Figure 48: Europe Global Neuroprotective Agents Market Volume (K Unit), by Application 2024 & 2032
- Figure 49: Europe Global Neuroprotective Agents Market Revenue Share (%), by Application 2024 & 2032
- Figure 50: Europe Global Neuroprotective Agents Market Volume Share (%), by Application 2024 & 2032
- Figure 51: Europe Global Neuroprotective Agents Market Revenue (Million), by Route of Administration 2024 & 2032
- Figure 52: Europe Global Neuroprotective Agents Market Volume (K Unit), by Route of Administration 2024 & 2032
- Figure 53: Europe Global Neuroprotective Agents Market Revenue Share (%), by Route of Administration 2024 & 2032
- Figure 54: Europe Global Neuroprotective Agents Market Volume Share (%), by Route of Administration 2024 & 2032
- Figure 55: Europe Global Neuroprotective Agents Market Revenue (Million), by Distribution Cahnnel 2024 & 2032
- Figure 56: Europe Global Neuroprotective Agents Market Volume (K Unit), by Distribution Cahnnel 2024 & 2032
- Figure 57: Europe Global Neuroprotective Agents Market Revenue Share (%), by Distribution Cahnnel 2024 & 2032
- Figure 58: Europe Global Neuroprotective Agents Market Volume Share (%), by Distribution Cahnnel 2024 & 2032
- Figure 59: Europe Global Neuroprotective Agents Market Revenue (Million), by Country 2024 & 2032
- Figure 60: Europe Global Neuroprotective Agents Market Volume (K Unit), by Country 2024 & 2032
- Figure 61: Europe Global Neuroprotective Agents Market Revenue Share (%), by Country 2024 & 2032
- Figure 62: Europe Global Neuroprotective Agents Market Volume Share (%), by Country 2024 & 2032
- Figure 63: Asia Pacific Global Neuroprotective Agents Market Revenue (Million), by Drug Class 2024 & 2032
- Figure 64: Asia Pacific Global Neuroprotective Agents Market Volume (K Unit), by Drug Class 2024 & 2032
- Figure 65: Asia Pacific Global Neuroprotective Agents Market Revenue Share (%), by Drug Class 2024 & 2032
- Figure 66: Asia Pacific Global Neuroprotective Agents Market Volume Share (%), by Drug Class 2024 & 2032
- Figure 67: Asia Pacific Global Neuroprotective Agents Market Revenue (Million), by Application 2024 & 2032
- Figure 68: Asia Pacific Global Neuroprotective Agents Market Volume (K Unit), by Application 2024 & 2032
- Figure 69: Asia Pacific Global Neuroprotective Agents Market Revenue Share (%), by Application 2024 & 2032
- Figure 70: Asia Pacific Global Neuroprotective Agents Market Volume Share (%), by Application 2024 & 2032
- Figure 71: Asia Pacific Global Neuroprotective Agents Market Revenue (Million), by Route of Administration 2024 & 2032
- Figure 72: Asia Pacific Global Neuroprotective Agents Market Volume (K Unit), by Route of Administration 2024 & 2032
- Figure 73: Asia Pacific Global Neuroprotective Agents Market Revenue Share (%), by Route of Administration 2024 & 2032
- Figure 74: Asia Pacific Global Neuroprotective Agents Market Volume Share (%), by Route of Administration 2024 & 2032
- Figure 75: Asia Pacific Global Neuroprotective Agents Market Revenue (Million), by Distribution Cahnnel 2024 & 2032
- Figure 76: Asia Pacific Global Neuroprotective Agents Market Volume (K Unit), by Distribution Cahnnel 2024 & 2032
- Figure 77: Asia Pacific Global Neuroprotective Agents Market Revenue Share (%), by Distribution Cahnnel 2024 & 2032
- Figure 78: Asia Pacific Global Neuroprotective Agents Market Volume Share (%), by Distribution Cahnnel 2024 & 2032
- Figure 79: Asia Pacific Global Neuroprotective Agents Market Revenue (Million), by Country 2024 & 2032
- Figure 80: Asia Pacific Global Neuroprotective Agents Market Volume (K Unit), by Country 2024 & 2032
- Figure 81: Asia Pacific Global Neuroprotective Agents Market Revenue Share (%), by Country 2024 & 2032
- Figure 82: Asia Pacific Global Neuroprotective Agents Market Volume Share (%), by Country 2024 & 2032
- Figure 83: Middle East and Africa Global Neuroprotective Agents Market Revenue (Million), by Drug Class 2024 & 2032
- Figure 84: Middle East and Africa Global Neuroprotective Agents Market Volume (K Unit), by Drug Class 2024 & 2032
- Figure 85: Middle East and Africa Global Neuroprotective Agents Market Revenue Share (%), by Drug Class 2024 & 2032
- Figure 86: Middle East and Africa Global Neuroprotective Agents Market Volume Share (%), by Drug Class 2024 & 2032
- Figure 87: Middle East and Africa Global Neuroprotective Agents Market Revenue (Million), by Application 2024 & 2032
- Figure 88: Middle East and Africa Global Neuroprotective Agents Market Volume (K Unit), by Application 2024 & 2032
- Figure 89: Middle East and Africa Global Neuroprotective Agents Market Revenue Share (%), by Application 2024 & 2032
- Figure 90: Middle East and Africa Global Neuroprotective Agents Market Volume Share (%), by Application 2024 & 2032
- Figure 91: Middle East and Africa Global Neuroprotective Agents Market Revenue (Million), by Route of Administration 2024 & 2032
- Figure 92: Middle East and Africa Global Neuroprotective Agents Market Volume (K Unit), by Route of Administration 2024 & 2032
- Figure 93: Middle East and Africa Global Neuroprotective Agents Market Revenue Share (%), by Route of Administration 2024 & 2032
- Figure 94: Middle East and Africa Global Neuroprotective Agents Market Volume Share (%), by Route of Administration 2024 & 2032
- Figure 95: Middle East and Africa Global Neuroprotective Agents Market Revenue (Million), by Distribution Cahnnel 2024 & 2032
- Figure 96: Middle East and Africa Global Neuroprotective Agents Market Volume (K Unit), by Distribution Cahnnel 2024 & 2032
- Figure 97: Middle East and Africa Global Neuroprotective Agents Market Revenue Share (%), by Distribution Cahnnel 2024 & 2032
- Figure 98: Middle East and Africa Global Neuroprotective Agents Market Volume Share (%), by Distribution Cahnnel 2024 & 2032
- Figure 99: Middle East and Africa Global Neuroprotective Agents Market Revenue (Million), by Country 2024 & 2032
- Figure 100: Middle East and Africa Global Neuroprotective Agents Market Volume (K Unit), by Country 2024 & 2032
- Figure 101: Middle East and Africa Global Neuroprotective Agents Market Revenue Share (%), by Country 2024 & 2032
- Figure 102: Middle East and Africa Global Neuroprotective Agents Market Volume Share (%), by Country 2024 & 2032
- Figure 103: South America Global Neuroprotective Agents Market Revenue (Million), by Drug Class 2024 & 2032
- Figure 104: South America Global Neuroprotective Agents Market Volume (K Unit), by Drug Class 2024 & 2032
- Figure 105: South America Global Neuroprotective Agents Market Revenue Share (%), by Drug Class 2024 & 2032
- Figure 106: South America Global Neuroprotective Agents Market Volume Share (%), by Drug Class 2024 & 2032
- Figure 107: South America Global Neuroprotective Agents Market Revenue (Million), by Application 2024 & 2032
- Figure 108: South America Global Neuroprotective Agents Market Volume (K Unit), by Application 2024 & 2032
- Figure 109: South America Global Neuroprotective Agents Market Revenue Share (%), by Application 2024 & 2032
- Figure 110: South America Global Neuroprotective Agents Market Volume Share (%), by Application 2024 & 2032
- Figure 111: South America Global Neuroprotective Agents Market Revenue (Million), by Route of Administration 2024 & 2032
- Figure 112: South America Global Neuroprotective Agents Market Volume (K Unit), by Route of Administration 2024 & 2032
- Figure 113: South America Global Neuroprotective Agents Market Revenue Share (%), by Route of Administration 2024 & 2032
- Figure 114: South America Global Neuroprotective Agents Market Volume Share (%), by Route of Administration 2024 & 2032
- Figure 115: South America Global Neuroprotective Agents Market Revenue (Million), by Distribution Cahnnel 2024 & 2032
- Figure 116: South America Global Neuroprotective Agents Market Volume (K Unit), by Distribution Cahnnel 2024 & 2032
- Figure 117: South America Global Neuroprotective Agents Market Revenue Share (%), by Distribution Cahnnel 2024 & 2032
- Figure 118: South America Global Neuroprotective Agents Market Volume Share (%), by Distribution Cahnnel 2024 & 2032
- Figure 119: South America Global Neuroprotective Agents Market Revenue (Million), by Country 2024 & 2032
- Figure 120: South America Global Neuroprotective Agents Market Volume (K Unit), by Country 2024 & 2032
- Figure 121: South America Global Neuroprotective Agents Market Revenue Share (%), by Country 2024 & 2032
- Figure 122: South America Global Neuroprotective Agents Market Volume Share (%), by Country 2024 & 2032
List of Tables
- Table 1: Global Neuroprotective Agents Market Revenue Million Forecast, by Region 2019 & 2032
- Table 2: Global Neuroprotective Agents Market Volume K Unit Forecast, by Region 2019 & 2032
- Table 3: Global Neuroprotective Agents Market Revenue Million Forecast, by Drug Class 2019 & 2032
- Table 4: Global Neuroprotective Agents Market Volume K Unit Forecast, by Drug Class 2019 & 2032
- Table 5: Global Neuroprotective Agents Market Revenue Million Forecast, by Application 2019 & 2032
- Table 6: Global Neuroprotective Agents Market Volume K Unit Forecast, by Application 2019 & 2032
- Table 7: Global Neuroprotective Agents Market Revenue Million Forecast, by Route of Administration 2019 & 2032
- Table 8: Global Neuroprotective Agents Market Volume K Unit Forecast, by Route of Administration 2019 & 2032
- Table 9: Global Neuroprotective Agents Market Revenue Million Forecast, by Distribution Cahnnel 2019 & 2032
- Table 10: Global Neuroprotective Agents Market Volume K Unit Forecast, by Distribution Cahnnel 2019 & 2032
- Table 11: Global Neuroprotective Agents Market Revenue Million Forecast, by Region 2019 & 2032
- Table 12: Global Neuroprotective Agents Market Volume K Unit Forecast, by Region 2019 & 2032
- Table 13: Global Neuroprotective Agents Market Revenue Million Forecast, by Country 2019 & 2032
- Table 14: Global Neuroprotective Agents Market Volume K Unit Forecast, by Country 2019 & 2032
- Table 15: United States Global Neuroprotective Agents Market Revenue (Million) Forecast, by Application 2019 & 2032
- Table 16: United States Global Neuroprotective Agents Market Volume (K Unit) Forecast, by Application 2019 & 2032
- Table 17: Canada Global Neuroprotective Agents Market Revenue (Million) Forecast, by Application 2019 & 2032
- Table 18: Canada Global Neuroprotective Agents Market Volume (K Unit) Forecast, by Application 2019 & 2032
- Table 19: Mexico Global Neuroprotective Agents Market Revenue (Million) Forecast, by Application 2019 & 2032
- Table 20: Mexico Global Neuroprotective Agents Market Volume (K Unit) Forecast, by Application 2019 & 2032
- Table 21: Global Neuroprotective Agents Market Revenue Million Forecast, by Country 2019 & 2032
- Table 22: Global Neuroprotective Agents Market Volume K Unit Forecast, by Country 2019 & 2032
- Table 23: Germany Global Neuroprotective Agents Market Revenue (Million) Forecast, by Application 2019 & 2032
- Table 24: Germany Global Neuroprotective Agents Market Volume (K Unit) Forecast, by Application 2019 & 2032
- Table 25: United Kingdom Global Neuroprotective Agents Market Revenue (Million) Forecast, by Application 2019 & 2032
- Table 26: United Kingdom Global Neuroprotective Agents Market Volume (K Unit) Forecast, by Application 2019 & 2032
- Table 27: France Global Neuroprotective Agents Market Revenue (Million) Forecast, by Application 2019 & 2032
- Table 28: France Global Neuroprotective Agents Market Volume (K Unit) Forecast, by Application 2019 & 2032
- Table 29: Italy Global Neuroprotective Agents Market Revenue (Million) Forecast, by Application 2019 & 2032
- Table 30: Italy Global Neuroprotective Agents Market Volume (K Unit) Forecast, by Application 2019 & 2032
- Table 31: Spain Global Neuroprotective Agents Market Revenue (Million) Forecast, by Application 2019 & 2032
- Table 32: Spain Global Neuroprotective Agents Market Volume (K Unit) Forecast, by Application 2019 & 2032
- Table 33: Rest of Europe Global Neuroprotective Agents Market Revenue (Million) Forecast, by Application 2019 & 2032
- Table 34: Rest of Europe Global Neuroprotective Agents Market Volume (K Unit) Forecast, by Application 2019 & 2032
- Table 35: Global Neuroprotective Agents Market Revenue Million Forecast, by Country 2019 & 2032
- Table 36: Global Neuroprotective Agents Market Volume K Unit Forecast, by Country 2019 & 2032
- Table 37: China Global Neuroprotective Agents Market Revenue (Million) Forecast, by Application 2019 & 2032
- Table 38: China Global Neuroprotective Agents Market Volume (K Unit) Forecast, by Application 2019 & 2032
- Table 39: Japan Global Neuroprotective Agents Market Revenue (Million) Forecast, by Application 2019 & 2032
- Table 40: Japan Global Neuroprotective Agents Market Volume (K Unit) Forecast, by Application 2019 & 2032
- Table 41: India Global Neuroprotective Agents Market Revenue (Million) Forecast, by Application 2019 & 2032
- Table 42: India Global Neuroprotective Agents Market Volume (K Unit) Forecast, by Application 2019 & 2032
- Table 43: Australia Global Neuroprotective Agents Market Revenue (Million) Forecast, by Application 2019 & 2032
- Table 44: Australia Global Neuroprotective Agents Market Volume (K Unit) Forecast, by Application 2019 & 2032
- Table 45: South Korea Global Neuroprotective Agents Market Revenue (Million) Forecast, by Application 2019 & 2032
- Table 46: South Korea Global Neuroprotective Agents Market Volume (K Unit) Forecast, by Application 2019 & 2032
- Table 47: Rest of Asia Pacific Global Neuroprotective Agents Market Revenue (Million) Forecast, by Application 2019 & 2032
- Table 48: Rest of Asia Pacific Global Neuroprotective Agents Market Volume (K Unit) Forecast, by Application 2019 & 2032
- Table 49: Global Neuroprotective Agents Market Revenue Million Forecast, by Country 2019 & 2032
- Table 50: Global Neuroprotective Agents Market Volume K Unit Forecast, by Country 2019 & 2032
- Table 51: GCC Global Neuroprotective Agents Market Revenue (Million) Forecast, by Application 2019 & 2032
- Table 52: GCC Global Neuroprotective Agents Market Volume (K Unit) Forecast, by Application 2019 & 2032
- Table 53: South Africa Global Neuroprotective Agents Market Revenue (Million) Forecast, by Application 2019 & 2032
- Table 54: South Africa Global Neuroprotective Agents Market Volume (K Unit) Forecast, by Application 2019 & 2032
- Table 55: Rest of Middle East and Africa Global Neuroprotective Agents Market Revenue (Million) Forecast, by Application 2019 & 2032
- Table 56: Rest of Middle East and Africa Global Neuroprotective Agents Market Volume (K Unit) Forecast, by Application 2019 & 2032
- Table 57: Global Neuroprotective Agents Market Revenue Million Forecast, by Country 2019 & 2032
- Table 58: Global Neuroprotective Agents Market Volume K Unit Forecast, by Country 2019 & 2032
- Table 59: Brazil Global Neuroprotective Agents Market Revenue (Million) Forecast, by Application 2019 & 2032
- Table 60: Brazil Global Neuroprotective Agents Market Volume (K Unit) Forecast, by Application 2019 & 2032
- Table 61: Argentina Global Neuroprotective Agents Market Revenue (Million) Forecast, by Application 2019 & 2032
- Table 62: Argentina Global Neuroprotective Agents Market Volume (K Unit) Forecast, by Application 2019 & 2032
- Table 63: Rest of South America Global Neuroprotective Agents Market Revenue (Million) Forecast, by Application 2019 & 2032
- Table 64: Rest of South America Global Neuroprotective Agents Market Volume (K Unit) Forecast, by Application 2019 & 2032
- Table 65: Global Neuroprotective Agents Market Revenue Million Forecast, by Drug Class 2019 & 2032
- Table 66: Global Neuroprotective Agents Market Volume K Unit Forecast, by Drug Class 2019 & 2032
- Table 67: Global Neuroprotective Agents Market Revenue Million Forecast, by Application 2019 & 2032
- Table 68: Global Neuroprotective Agents Market Volume K Unit Forecast, by Application 2019 & 2032
- Table 69: Global Neuroprotective Agents Market Revenue Million Forecast, by Route of Administration 2019 & 2032
- Table 70: Global Neuroprotective Agents Market Volume K Unit Forecast, by Route of Administration 2019 & 2032
- Table 71: Global Neuroprotective Agents Market Revenue Million Forecast, by Distribution Cahnnel 2019 & 2032
- Table 72: Global Neuroprotective Agents Market Volume K Unit Forecast, by Distribution Cahnnel 2019 & 2032
- Table 73: Global Neuroprotective Agents Market Revenue Million Forecast, by Country 2019 & 2032
- Table 74: Global Neuroprotective Agents Market Volume K Unit Forecast, by Country 2019 & 2032
- Table 75: United States Global Neuroprotective Agents Market Revenue (Million) Forecast, by Application 2019 & 2032
- Table 76: United States Global Neuroprotective Agents Market Volume (K Unit) Forecast, by Application 2019 & 2032
- Table 77: Canada Global Neuroprotective Agents Market Revenue (Million) Forecast, by Application 2019 & 2032
- Table 78: Canada Global Neuroprotective Agents Market Volume (K Unit) Forecast, by Application 2019 & 2032
- Table 79: Mexico Global Neuroprotective Agents Market Revenue (Million) Forecast, by Application 2019 & 2032
- Table 80: Mexico Global Neuroprotective Agents Market Volume (K Unit) Forecast, by Application 2019 & 2032
- Table 81: Global Neuroprotective Agents Market Revenue Million Forecast, by Drug Class 2019 & 2032
- Table 82: Global Neuroprotective Agents Market Volume K Unit Forecast, by Drug Class 2019 & 2032
- Table 83: Global Neuroprotective Agents Market Revenue Million Forecast, by Application 2019 & 2032
- Table 84: Global Neuroprotective Agents Market Volume K Unit Forecast, by Application 2019 & 2032
- Table 85: Global Neuroprotective Agents Market Revenue Million Forecast, by Route of Administration 2019 & 2032
- Table 86: Global Neuroprotective Agents Market Volume K Unit Forecast, by Route of Administration 2019 & 2032
- Table 87: Global Neuroprotective Agents Market Revenue Million Forecast, by Distribution Cahnnel 2019 & 2032
- Table 88: Global Neuroprotective Agents Market Volume K Unit Forecast, by Distribution Cahnnel 2019 & 2032
- Table 89: Global Neuroprotective Agents Market Revenue Million Forecast, by Country 2019 & 2032
- Table 90: Global Neuroprotective Agents Market Volume K Unit Forecast, by Country 2019 & 2032
- Table 91: Germany Global Neuroprotective Agents Market Revenue (Million) Forecast, by Application 2019 & 2032
- Table 92: Germany Global Neuroprotective Agents Market Volume (K Unit) Forecast, by Application 2019 & 2032
- Table 93: United Kingdom Global Neuroprotective Agents Market Revenue (Million) Forecast, by Application 2019 & 2032
- Table 94: United Kingdom Global Neuroprotective Agents Market Volume (K Unit) Forecast, by Application 2019 & 2032
- Table 95: France Global Neuroprotective Agents Market Revenue (Million) Forecast, by Application 2019 & 2032
- Table 96: France Global Neuroprotective Agents Market Volume (K Unit) Forecast, by Application 2019 & 2032
- Table 97: Italy Global Neuroprotective Agents Market Revenue (Million) Forecast, by Application 2019 & 2032
- Table 98: Italy Global Neuroprotective Agents Market Volume (K Unit) Forecast, by Application 2019 & 2032
- Table 99: Spain Global Neuroprotective Agents Market Revenue (Million) Forecast, by Application 2019 & 2032
- Table 100: Spain Global Neuroprotective Agents Market Volume (K Unit) Forecast, by Application 2019 & 2032
- Table 101: Rest of Europe Global Neuroprotective Agents Market Revenue (Million) Forecast, by Application 2019 & 2032
- Table 102: Rest of Europe Global Neuroprotective Agents Market Volume (K Unit) Forecast, by Application 2019 & 2032
- Table 103: Global Neuroprotective Agents Market Revenue Million Forecast, by Drug Class 2019 & 2032
- Table 104: Global Neuroprotective Agents Market Volume K Unit Forecast, by Drug Class 2019 & 2032
- Table 105: Global Neuroprotective Agents Market Revenue Million Forecast, by Application 2019 & 2032
- Table 106: Global Neuroprotective Agents Market Volume K Unit Forecast, by Application 2019 & 2032
- Table 107: Global Neuroprotective Agents Market Revenue Million Forecast, by Route of Administration 2019 & 2032
- Table 108: Global Neuroprotective Agents Market Volume K Unit Forecast, by Route of Administration 2019 & 2032
- Table 109: Global Neuroprotective Agents Market Revenue Million Forecast, by Distribution Cahnnel 2019 & 2032
- Table 110: Global Neuroprotective Agents Market Volume K Unit Forecast, by Distribution Cahnnel 2019 & 2032
- Table 111: Global Neuroprotective Agents Market Revenue Million Forecast, by Country 2019 & 2032
- Table 112: Global Neuroprotective Agents Market Volume K Unit Forecast, by Country 2019 & 2032
- Table 113: China Global Neuroprotective Agents Market Revenue (Million) Forecast, by Application 2019 & 2032
- Table 114: China Global Neuroprotective Agents Market Volume (K Unit) Forecast, by Application 2019 & 2032
- Table 115: Japan Global Neuroprotective Agents Market Revenue (Million) Forecast, by Application 2019 & 2032
- Table 116: Japan Global Neuroprotective Agents Market Volume (K Unit) Forecast, by Application 2019 & 2032
- Table 117: India Global Neuroprotective Agents Market Revenue (Million) Forecast, by Application 2019 & 2032
- Table 118: India Global Neuroprotective Agents Market Volume (K Unit) Forecast, by Application 2019 & 2032
- Table 119: Australia Global Neuroprotective Agents Market Revenue (Million) Forecast, by Application 2019 & 2032
- Table 120: Australia Global Neuroprotective Agents Market Volume (K Unit) Forecast, by Application 2019 & 2032
- Table 121: South Korea Global Neuroprotective Agents Market Revenue (Million) Forecast, by Application 2019 & 2032
- Table 122: South Korea Global Neuroprotective Agents Market Volume (K Unit) Forecast, by Application 2019 & 2032
- Table 123: Rest of Asia Pacific Global Neuroprotective Agents Market Revenue (Million) Forecast, by Application 2019 & 2032
- Table 124: Rest of Asia Pacific Global Neuroprotective Agents Market Volume (K Unit) Forecast, by Application 2019 & 2032
- Table 125: Global Neuroprotective Agents Market Revenue Million Forecast, by Drug Class 2019 & 2032
- Table 126: Global Neuroprotective Agents Market Volume K Unit Forecast, by Drug Class 2019 & 2032
- Table 127: Global Neuroprotective Agents Market Revenue Million Forecast, by Application 2019 & 2032
- Table 128: Global Neuroprotective Agents Market Volume K Unit Forecast, by Application 2019 & 2032
- Table 129: Global Neuroprotective Agents Market Revenue Million Forecast, by Route of Administration 2019 & 2032
- Table 130: Global Neuroprotective Agents Market Volume K Unit Forecast, by Route of Administration 2019 & 2032
- Table 131: Global Neuroprotective Agents Market Revenue Million Forecast, by Distribution Cahnnel 2019 & 2032
- Table 132: Global Neuroprotective Agents Market Volume K Unit Forecast, by Distribution Cahnnel 2019 & 2032
- Table 133: Global Neuroprotective Agents Market Revenue Million Forecast, by Country 2019 & 2032
- Table 134: Global Neuroprotective Agents Market Volume K Unit Forecast, by Country 2019 & 2032
- Table 135: GCC Global Neuroprotective Agents Market Revenue (Million) Forecast, by Application 2019 & 2032
- Table 136: GCC Global Neuroprotective Agents Market Volume (K Unit) Forecast, by Application 2019 & 2032
- Table 137: South Africa Global Neuroprotective Agents Market Revenue (Million) Forecast, by Application 2019 & 2032
- Table 138: South Africa Global Neuroprotective Agents Market Volume (K Unit) Forecast, by Application 2019 & 2032
- Table 139: Rest of Middle East and Africa Global Neuroprotective Agents Market Revenue (Million) Forecast, by Application 2019 & 2032
- Table 140: Rest of Middle East and Africa Global Neuroprotective Agents Market Volume (K Unit) Forecast, by Application 2019 & 2032
- Table 141: Global Neuroprotective Agents Market Revenue Million Forecast, by Drug Class 2019 & 2032
- Table 142: Global Neuroprotective Agents Market Volume K Unit Forecast, by Drug Class 2019 & 2032
- Table 143: Global Neuroprotective Agents Market Revenue Million Forecast, by Application 2019 & 2032
- Table 144: Global Neuroprotective Agents Market Volume K Unit Forecast, by Application 2019 & 2032
- Table 145: Global Neuroprotective Agents Market Revenue Million Forecast, by Route of Administration 2019 & 2032
- Table 146: Global Neuroprotective Agents Market Volume K Unit Forecast, by Route of Administration 2019 & 2032
- Table 147: Global Neuroprotective Agents Market Revenue Million Forecast, by Distribution Cahnnel 2019 & 2032
- Table 148: Global Neuroprotective Agents Market Volume K Unit Forecast, by Distribution Cahnnel 2019 & 2032
- Table 149: Global Neuroprotective Agents Market Revenue Million Forecast, by Country 2019 & 2032
- Table 150: Global Neuroprotective Agents Market Volume K Unit Forecast, by Country 2019 & 2032
- Table 151: Brazil Global Neuroprotective Agents Market Revenue (Million) Forecast, by Application 2019 & 2032
- Table 152: Brazil Global Neuroprotective Agents Market Volume (K Unit) Forecast, by Application 2019 & 2032
- Table 153: Argentina Global Neuroprotective Agents Market Revenue (Million) Forecast, by Application 2019 & 2032
- Table 154: Argentina Global Neuroprotective Agents Market Volume (K Unit) Forecast, by Application 2019 & 2032
- Table 155: Rest of South America Global Neuroprotective Agents Market Revenue (Million) Forecast, by Application 2019 & 2032
- Table 156: Rest of South America Global Neuroprotective Agents Market Volume (K Unit) Forecast, by Application 2019 & 2032
Frequently Asked Questions
1. What is the projected Compound Annual Growth Rate (CAGR) of the Global Neuroprotective Agents Market?
The projected CAGR is approximately 6.70%.
2. Which companies are prominent players in the Global Neuroprotective Agents Market?
Key companies in the market include Sunovion Pharmaceuticals Inc, Merck KGaA, Bioniz Theraputics, GlaxoSmithKline plc, Neuren Pharmaceuticals, Teva Pharmaceutical Industries Ltd, Novartis Pharmaceuticals Corporation, Sun Pharmaceutical Industries Ltd, Genervon Biopharmaceuticals LLC, Hikma Pharmaceuticals PLC, Pfizer Inc.
3. What are the main segments of the Global Neuroprotective Agents Market?
The market segments include Drug Class, Application, Route of Administration, Distribution Cahnnel.
4. Can you provide details about the market size?
The market size is estimated to be USD XX Million as of 2022.
5. What are some drivers contributing to market growth?
Increase in Incidence and Prevalence of Neurodegenerative Diseases; Increase in Stroke and Traumatic Central Nervous System Injuries; Rising Awareness for Neuroprotective Agents.
6. What are the notable trends driving market growth?
The Alzheimer's disease Segment is Expected to Hold a Major Market Share in the Neuroprotective Agents Market.
7. Are there any restraints impacting market growth?
Failure of Clinical Trails in Neuroprotective Productline.; Strigent Regulatory Approvals.
8. Can you provide examples of recent developments in the market?
In August 2022, BrainStorm submitted a Biologics License Application (BLA) to the Food and Drug Administration for NurOwn as a potential treatment for ALS.
9. What pricing options are available for accessing the report?
Pricing options include single-user, multi-user, and enterprise licenses priced at USD 4750, USD 5250, and USD 8750 respectively.
10. Is the market size provided in terms of value or volume?
The market size is provided in terms of value, measured in Million and volume, measured in K Unit.
11. Are there any specific market keywords associated with the report?
Yes, the market keyword associated with the report is "Global Neuroprotective Agents Market," which aids in identifying and referencing the specific market segment covered.
12. How do I determine which pricing option suits my needs best?
The pricing options vary based on user requirements and access needs. Individual users may opt for single-user licenses, while businesses requiring broader access may choose multi-user or enterprise licenses for cost-effective access to the report.
13. Are there any additional resources or data provided in the Global Neuroprotective Agents Market report?
While the report offers comprehensive insights, it's advisable to review the specific contents or supplementary materials provided to ascertain if additional resources or data are available.
14. How can I stay updated on further developments or reports in the Global Neuroprotective Agents Market?
To stay informed about further developments, trends, and reports in the Global Neuroprotective Agents Market, consider subscribing to industry newsletters, following relevant companies and organizations, or regularly checking reputable industry news sources and publications.
Methodology
Step 1 - Identification of Relevant Samples Size from Population Database


Step 2 - Approaches for Defining Global Market Size (Value, Volume* & Price*)

Note*: In applicable scenarios
Step 3 - Data Sources
Primary Research
- Web Analytics
- Survey Reports
- Research Institute
- Latest Research Reports
- Opinion Leaders
Secondary Research
- Annual Reports
- White Paper
- Latest Press Release
- Industry Association
- Paid Database
- Investor Presentations

Step 4 - Data Triangulation
Involves using different sources of information in order to increase the validity of a study
These sources are likely to be stakeholders in a program - participants, other researchers, program staff, other community members, and so on.
Then we put all data in single framework & apply various statistical tools to find out the dynamic on the market.
During the analysis stage, feedback from the stakeholder groups would be compared to determine areas of agreement as well as areas of divergence


