
Key Insights
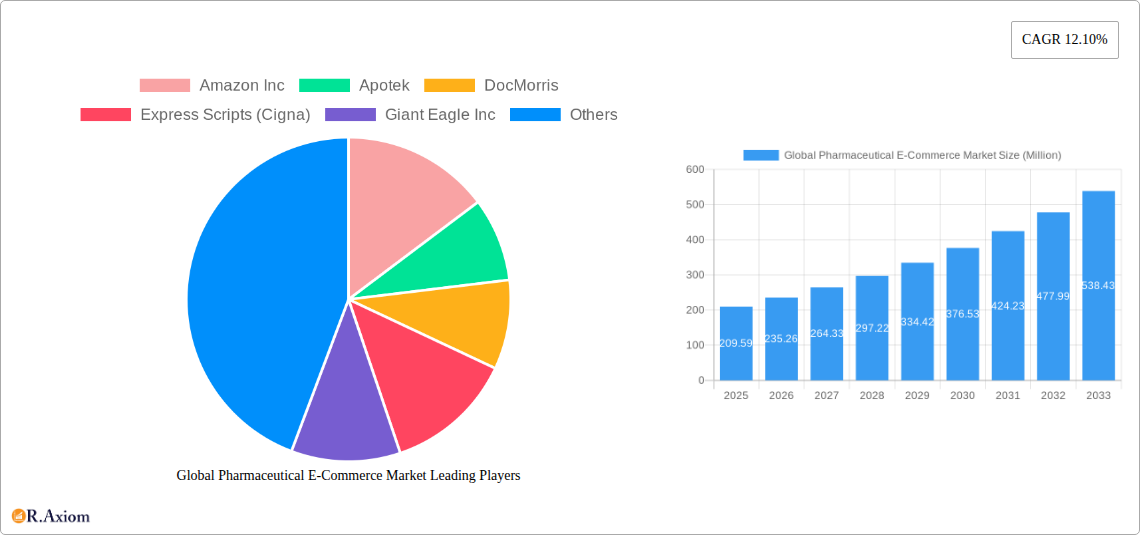
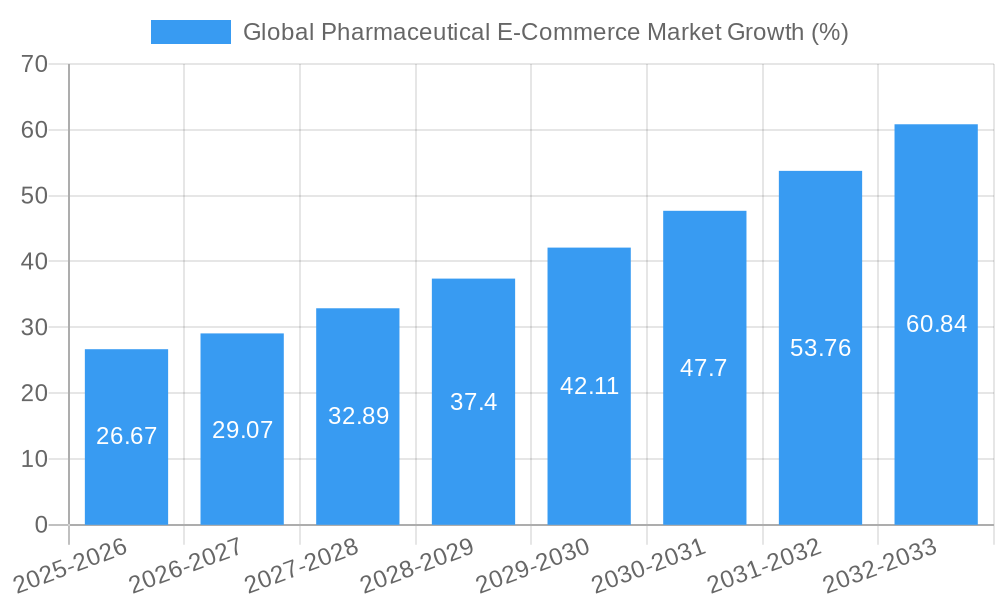
The global pharmaceutical e-commerce market is experiencing robust growth, projected to reach \$209.59 million in 2025 and maintain a Compound Annual Growth Rate (CAGR) of 12.10% from 2025 to 2033. This expansion is driven by several key factors. Increasing internet and smartphone penetration, particularly in emerging economies, is significantly broadening the market's reach. Consumers are increasingly comfortable purchasing pharmaceuticals online, drawn by the convenience of home delivery, wider product selection, and often lower prices compared to traditional brick-and-mortar pharmacies. Furthermore, the COVID-19 pandemic accelerated the adoption of telehealth and online prescription services, establishing a new norm for accessing healthcare products. Technological advancements, such as improved security measures for online transactions and robust digital platforms, are also bolstering market growth. The rise of e-pharmacies offering personalized medication management and virtual consultations further enhances consumer appeal. However, regulatory hurdles related to online pharmaceutical sales, concerns regarding counterfeit medications, and data privacy issues remain significant restraints that could impact the market's trajectory. Major players like Amazon, CVS Health, and others are strategically investing in technology and logistics to gain a competitive edge in this rapidly evolving landscape.
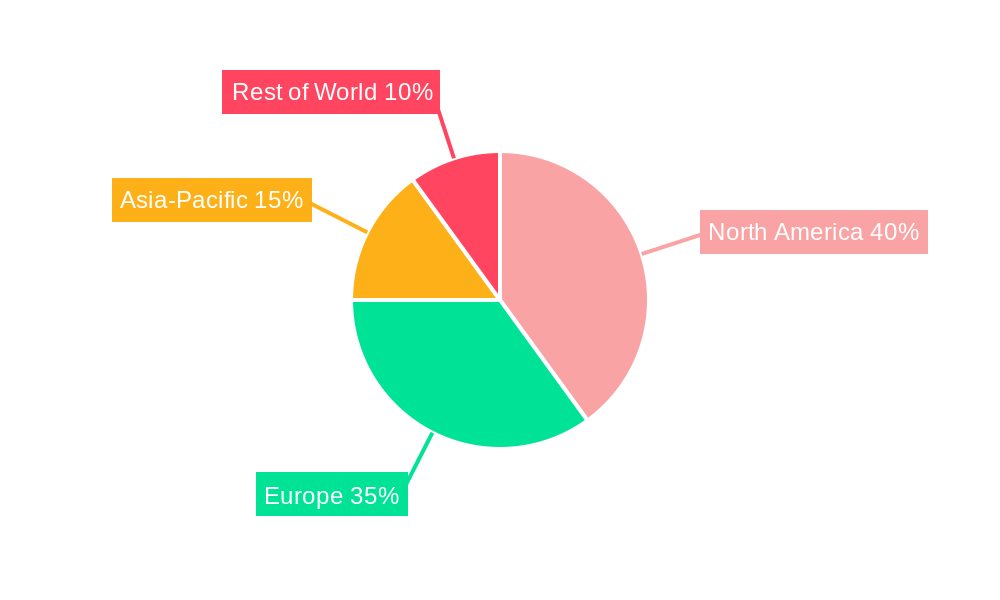
The market segmentation (detailed data not provided) likely includes prescription drugs, over-the-counter medications, and healthcare products. Geographic segmentation would show variations in market penetration and growth rates across regions, with North America and Europe currently dominating, followed by Asia-Pacific showing significant potential for future expansion driven by growing middle classes and increased digital literacy. Competition is intense, with both established pharmaceutical companies and dedicated e-pharmacies vying for market share. Successful strategies will likely focus on leveraging technology for enhanced user experience, secure delivery systems, and personalized healthcare solutions. The continued evolution of regulations and consumer preferences will shape the market's future, requiring companies to adapt and innovate to stay ahead.
Global Pharmaceutical E-Commerce Market: A Comprehensive Report (2019-2033)
This in-depth report provides a comprehensive analysis of the Global Pharmaceutical E-Commerce Market, covering market size, growth drivers, challenges, and key players. The study period spans from 2019 to 2033, with 2025 serving as the base and estimated year. The forecast period extends from 2025 to 2033, while the historical period encompasses 2019-2024. This report is essential for industry stakeholders, investors, and market entrants seeking to understand this rapidly evolving sector. The market value in 2025 is estimated at $xx Million.
Global Pharmaceutical E-Commerce Market Market Concentration & Innovation
This section analyzes the competitive landscape of the global pharmaceutical e-commerce market, examining market concentration, innovation drivers, regulatory frameworks, and key industry developments. We assess the market share of major players, including Amazon Inc, Apotek, DocMorris, Express Scripts (Cigna), Giant Eagle Inc, NetMeds, Tata 1mg, Optum Inc (UnitedHealth Group Inc), EMedStore, Walgreen Co, CVS Health, Apteka ru, Rite Aid Corp, shop-apotheke, and PharmEas. The report quantifies market concentration using metrics like the Herfindahl-Hirschman Index (HHI) and identifies key players' market share percentages. Furthermore, it delves into the impact of mergers and acquisitions (M&A) activities on market dynamics, providing an analysis of recent deals and their financial values (e.g., deal value of $xx Million).
- Market Concentration: The report will quantify market concentration using the Herfindahl-Hirschman Index (HHI) and analyze market share distribution among key players.
- Innovation Drivers: Analysis of factors driving innovation, including technological advancements (e.g., AI-powered drug discovery, telemedicine integration), evolving consumer preferences, and regulatory changes.
- Regulatory Frameworks: Evaluation of the impact of various regulatory frameworks across different geographies on market growth and competition.
- Product Substitutes: Assessment of potential substitutes and their impact on the market.
- End-User Trends: Analysis of changing consumer behavior, preferences, and purchasing patterns.
- M&A Activities: Detailed analysis of recent mergers and acquisitions, including their impact on market consolidation and competitive dynamics. This includes deal values and strategic rationale.
Global Pharmaceutical E-Commerce Market Industry Trends & Insights
This section offers a detailed analysis of industry trends shaping the global pharmaceutical e-commerce market. It explores market growth drivers, technological disruptions, consumer preferences, competitive dynamics, and emerging opportunities. We examine the Compound Annual Growth Rate (CAGR) for the forecast period and analyze market penetration rates across key segments. The impact of factors such as increasing internet and smartphone penetration, growing demand for convenient healthcare solutions, and the rising adoption of telehealth are discussed in detail.
- Market Growth Drivers: Analysis of factors driving market growth, including rising internet penetration, increased preference for online shopping, and the growing demand for convenient healthcare access.
- Technological Disruptions: Assessment of the impact of technological advancements such as AI, machine learning, and blockchain on the pharmaceutical e-commerce landscape.
- Consumer Preferences: Analysis of consumer buying habits and preferences regarding online pharmaceutical purchases, including factors influencing their choices.
- Competitive Dynamics: Evaluation of the competitive intensity, including strategies employed by key players to gain market share.
- Market Penetration: Detailed analysis of market penetration rates across various regions and segments. Growth projections are provided for each identified segment.
- CAGR Analysis: The section will present the calculated CAGR for the forecast period (2025-2033).
Dominant Markets & Segments in Global Pharmaceutical E-Commerce Market
This section identifies the leading regions, countries, and market segments within the global pharmaceutical e-commerce market. A detailed analysis of market dominance is provided, focusing on key factors contributing to this leadership. The analysis will include factors like economic policies, healthcare infrastructure, regulatory environment, and consumer behavior patterns.
- Leading Region/Country: Identification of the leading region/country based on market size, growth rate, and other relevant factors.
- Key Drivers:
- Economic Policies: Analysis of government policies and initiatives supporting or hindering e-commerce growth in the pharmaceutical sector.
- Healthcare Infrastructure: Assessment of the role of healthcare infrastructure (e.g., internet penetration, logistics) in market development.
- Regulatory Environment: Evaluation of the impact of regulatory frameworks on market growth.
- Consumer Behavior: Analysis of consumer purchasing habits and preferences within the region/country.
- Dominance Analysis: A comprehensive analysis of why this specific region/country dominates the market, including a detailed discussion of relevant factors and market trends. This section will further delve into segment-specific dominance.
Global Pharmaceutical E-Commerce Market Product Developments
This section summarizes recent product innovations, applications, and competitive advantages within the global pharmaceutical e-commerce market. It highlights technological trends shaping product development and assesses the market fit of new offerings. Examples of product innovations include advancements in online prescription services, personalized medicine delivery systems, and telepharmacy platforms. Competitive advantages will be analyzed, focusing on factors such as convenience, pricing, and customer service.
Report Scope & Segmentation Analysis
This report segments the global pharmaceutical e-commerce market based on various factors including drug type (prescription, over-the-counter), delivery method (home delivery, in-store pickup), customer type (individual consumers, healthcare providers), and geographical region. Each segment's market size, growth projections, and competitive dynamics will be analyzed. Market size projections in Million will be given for each segment.
- Drug Type Segmentation: Detailed analysis of prescription and over-the-counter drug segments. Market size and CAGR for each segment.
- Delivery Method Segmentation: Detailed analysis of home delivery and in-store pickup segments. Market size and CAGR for each segment.
- Customer Type Segmentation: Detailed analysis of individual consumers and healthcare providers segments. Market size and CAGR for each segment.
- Geographical Segmentation: Detailed analysis of regional market segments with size and CAGR projections. Examples include North America, Europe, Asia Pacific, etc.
Key Drivers of Global Pharmaceutical E-Commerce Market Growth
This section identifies and analyzes the key factors driving the growth of the global pharmaceutical e-commerce market. These drivers include technological advancements, favorable economic conditions, and supportive regulatory changes. Specific examples of these drivers are provided and their impact on market growth is assessed.
Challenges in the Global Pharmaceutical E-Commerce Market Sector
This section discusses the challenges and restraints affecting the growth of the pharmaceutical e-commerce market. These include regulatory hurdles regarding online prescription drug sales, supply chain complexities, data security concerns, and intense competition. The report will quantify the impact of these challenges on market growth, where possible.
Emerging Opportunities in Global Pharmaceutical E-Commerce Market
This section highlights emerging trends and opportunities within the pharmaceutical e-commerce market, such as the expansion into new markets, adoption of new technologies (e.g., AI-powered chatbots, virtual assistants), and evolving consumer preferences. The potential impact of these opportunities on market growth is analyzed.
Leading Players in the Global Pharmaceutical E-Commerce Market Market
- Amazon Inc
- Apotek
- DocMorris
- Express Scripts (Cigna)
- Giant Eagle Inc
- NetMeds
- Tata 1mg
- Optum Inc (UnitedHealth Group Inc)
- EMedStore
- Walgreen Co
- CVS Health
- Apteka ru
- Rite Aid Corp
- shop-apotheke
- PharmEas
Key Developments in Global Pharmaceutical E-Commerce Market Industry
- January 2024: Eli Lilly and Company launched LillyDirect for people living with obesity, migraine, and diabetes in the United States. This platform provides disease management resources and direct home delivery of select Lilly medicines for people in the United States. This development signifies a move towards direct-to-consumer engagement and personalized medicine delivery.
- March 2024: Eli Lilly partnered with Amazon Pharmacy to deliver the weight loss drug Mounjaro (and other medicines) from its direct-to-consumer website. This collaboration highlights the growing importance of strategic partnerships in expanding market reach and distribution channels.
Strategic Outlook for Global Pharmaceutical E-Commerce Market Market
The future of the global pharmaceutical e-commerce market presents significant growth potential. Continued technological advancements, increasing consumer adoption of online healthcare services, and strategic partnerships will drive market expansion. Opportunities exist in the development of personalized medicine delivery, integration with telemedicine platforms, and expansion into underserved markets. However, navigating regulatory challenges and ensuring data security will be crucial for sustained growth.
Global Pharmaceutical E-Commerce Market Segmentation
-
1. Type
- 1.1. Prescription
- 1.2. Over-the-counter (OTC)
-
2. Product Type
- 2.1. Vaccines
- 2.2. Specialty Care
- 2.3. General Medicines
- 2.4. Consumer Healthcare
-
3. Therapeutic Area
- 3.1. Diabetes
- 3.2. Immune-system Diseases
- 3.3. Cancer
- 3.4. Neurodegenerative Diseases
- 3.5. Cardiovascular Diseases
- 3.6. Other Therapeutic Areas
-
4. Market Type
- 4.1. B2B
- 4.2. B2B2B
- 4.3. B2B2C
-
5. Platform
- 5.1. Manufacturer-owned Digital Commerce
- 5.2. Distributor/Wholesaler-owned Digital Commerce
- 5.3. Manufacturer-owned Marketplace
- 5.4. Third Party Market Place
- 5.5. Retail
Global Pharmaceutical E-Commerce Market Segmentation By Geography
-
1. North America
- 1.1. United States
- 1.2. Canada
- 1.3. Mexico
-
2. Europe
- 2.1. United Kingdom
- 2.2. Germany
- 2.3. France
- 2.4. Italy
- 2.5. Spain
- 2.6. Rest of Europe
-
3. Asia Pacific
- 3.1. China
- 3.2. Japan
- 3.3. India
- 3.4. Australia
- 3.5. South Korea
- 3.6. Rest of Asia Pacific
-
4. Middle East and Africa
- 4.1. GCC
- 4.2. South Africa
- 4.3. Rest of Middle East and Africa
-
5. South America
- 5.1. Brazil
- 5.2. Argentina
- 5.3. Rest of South America
Global Pharmaceutical E-Commerce Market REPORT HIGHLIGHTS
| Aspects | Details |
|---|---|
| Study Period | 2019-2033 |
| Base Year | 2024 |
| Estimated Year | 2025 |
| Forecast Period | 2025-2033 |
| Historical Period | 2019-2024 |
| Growth Rate | CAGR of 12.10% from 2019-2033 |
| Segmentation |
|
Table of Contents
- 1. Introduction
- 1.1. Research Scope
- 1.2. Market Segmentation
- 1.3. Research Methodology
- 1.4. Definitions and Assumptions
- 2. Executive Summary
- 2.1. Introduction
- 3. Market Dynamics
- 3.1. Introduction
- 3.2. Market Drivers
- 3.2.1. Increasing Smartphone Penetration and Growing Demand for E-pharmacies; Rising Prevalence of Chronic Diseases; Convenience and Other Benefits Offered by E-pharmacies
- 3.3. Market Restrains
- 3.3.1. Increasing Smartphone Penetration and Growing Demand for E-pharmacies; Rising Prevalence of Chronic Diseases; Convenience and Other Benefits Offered by E-pharmacies
- 3.4. Market Trends
- 3.4.1. The Cancer Segment is Expected to Exhibit a Significant Growth Rate During the Forecast Period
- 4. Market Factor Analysis
- 4.1. Porters Five Forces
- 4.2. Supply/Value Chain
- 4.3. PESTEL analysis
- 4.4. Market Entropy
- 4.5. Patent/Trademark Analysis
- 5. Global Pharmaceutical E-Commerce Market Analysis, Insights and Forecast, 2019-2031
- 5.1. Market Analysis, Insights and Forecast - by Type
- 5.1.1. Prescription
- 5.1.2. Over-the-counter (OTC)
- 5.2. Market Analysis, Insights and Forecast - by Product Type
- 5.2.1. Vaccines
- 5.2.2. Specialty Care
- 5.2.3. General Medicines
- 5.2.4. Consumer Healthcare
- 5.3. Market Analysis, Insights and Forecast - by Therapeutic Area
- 5.3.1. Diabetes
- 5.3.2. Immune-system Diseases
- 5.3.3. Cancer
- 5.3.4. Neurodegenerative Diseases
- 5.3.5. Cardiovascular Diseases
- 5.3.6. Other Therapeutic Areas
- 5.4. Market Analysis, Insights and Forecast - by Market Type
- 5.4.1. B2B
- 5.4.2. B2B2B
- 5.4.3. B2B2C
- 5.5. Market Analysis, Insights and Forecast - by Platform
- 5.5.1. Manufacturer-owned Digital Commerce
- 5.5.2. Distributor/Wholesaler-owned Digital Commerce
- 5.5.3. Manufacturer-owned Marketplace
- 5.5.4. Third Party Market Place
- 5.5.5. Retail
- 5.6. Market Analysis, Insights and Forecast - by Region
- 5.6.1. North America
- 5.6.2. Europe
- 5.6.3. Asia Pacific
- 5.6.4. Middle East and Africa
- 5.6.5. South America
- 5.1. Market Analysis, Insights and Forecast - by Type
- 6. North America Global Pharmaceutical E-Commerce Market Analysis, Insights and Forecast, 2019-2031
- 6.1. Market Analysis, Insights and Forecast - by Type
- 6.1.1. Prescription
- 6.1.2. Over-the-counter (OTC)
- 6.2. Market Analysis, Insights and Forecast - by Product Type
- 6.2.1. Vaccines
- 6.2.2. Specialty Care
- 6.2.3. General Medicines
- 6.2.4. Consumer Healthcare
- 6.3. Market Analysis, Insights and Forecast - by Therapeutic Area
- 6.3.1. Diabetes
- 6.3.2. Immune-system Diseases
- 6.3.3. Cancer
- 6.3.4. Neurodegenerative Diseases
- 6.3.5. Cardiovascular Diseases
- 6.3.6. Other Therapeutic Areas
- 6.4. Market Analysis, Insights and Forecast - by Market Type
- 6.4.1. B2B
- 6.4.2. B2B2B
- 6.4.3. B2B2C
- 6.5. Market Analysis, Insights and Forecast - by Platform
- 6.5.1. Manufacturer-owned Digital Commerce
- 6.5.2. Distributor/Wholesaler-owned Digital Commerce
- 6.5.3. Manufacturer-owned Marketplace
- 6.5.4. Third Party Market Place
- 6.5.5. Retail
- 6.1. Market Analysis, Insights and Forecast - by Type
- 7. Europe Global Pharmaceutical E-Commerce Market Analysis, Insights and Forecast, 2019-2031
- 7.1. Market Analysis, Insights and Forecast - by Type
- 7.1.1. Prescription
- 7.1.2. Over-the-counter (OTC)
- 7.2. Market Analysis, Insights and Forecast - by Product Type
- 7.2.1. Vaccines
- 7.2.2. Specialty Care
- 7.2.3. General Medicines
- 7.2.4. Consumer Healthcare
- 7.3. Market Analysis, Insights and Forecast - by Therapeutic Area
- 7.3.1. Diabetes
- 7.3.2. Immune-system Diseases
- 7.3.3. Cancer
- 7.3.4. Neurodegenerative Diseases
- 7.3.5. Cardiovascular Diseases
- 7.3.6. Other Therapeutic Areas
- 7.4. Market Analysis, Insights and Forecast - by Market Type
- 7.4.1. B2B
- 7.4.2. B2B2B
- 7.4.3. B2B2C
- 7.5. Market Analysis, Insights and Forecast - by Platform
- 7.5.1. Manufacturer-owned Digital Commerce
- 7.5.2. Distributor/Wholesaler-owned Digital Commerce
- 7.5.3. Manufacturer-owned Marketplace
- 7.5.4. Third Party Market Place
- 7.5.5. Retail
- 7.1. Market Analysis, Insights and Forecast - by Type
- 8. Asia Pacific Global Pharmaceutical E-Commerce Market Analysis, Insights and Forecast, 2019-2031
- 8.1. Market Analysis, Insights and Forecast - by Type
- 8.1.1. Prescription
- 8.1.2. Over-the-counter (OTC)
- 8.2. Market Analysis, Insights and Forecast - by Product Type
- 8.2.1. Vaccines
- 8.2.2. Specialty Care
- 8.2.3. General Medicines
- 8.2.4. Consumer Healthcare
- 8.3. Market Analysis, Insights and Forecast - by Therapeutic Area
- 8.3.1. Diabetes
- 8.3.2. Immune-system Diseases
- 8.3.3. Cancer
- 8.3.4. Neurodegenerative Diseases
- 8.3.5. Cardiovascular Diseases
- 8.3.6. Other Therapeutic Areas
- 8.4. Market Analysis, Insights and Forecast - by Market Type
- 8.4.1. B2B
- 8.4.2. B2B2B
- 8.4.3. B2B2C
- 8.5. Market Analysis, Insights and Forecast - by Platform
- 8.5.1. Manufacturer-owned Digital Commerce
- 8.5.2. Distributor/Wholesaler-owned Digital Commerce
- 8.5.3. Manufacturer-owned Marketplace
- 8.5.4. Third Party Market Place
- 8.5.5. Retail
- 8.1. Market Analysis, Insights and Forecast - by Type
- 9. Middle East and Africa Global Pharmaceutical E-Commerce Market Analysis, Insights and Forecast, 2019-2031
- 9.1. Market Analysis, Insights and Forecast - by Type
- 9.1.1. Prescription
- 9.1.2. Over-the-counter (OTC)
- 9.2. Market Analysis, Insights and Forecast - by Product Type
- 9.2.1. Vaccines
- 9.2.2. Specialty Care
- 9.2.3. General Medicines
- 9.2.4. Consumer Healthcare
- 9.3. Market Analysis, Insights and Forecast - by Therapeutic Area
- 9.3.1. Diabetes
- 9.3.2. Immune-system Diseases
- 9.3.3. Cancer
- 9.3.4. Neurodegenerative Diseases
- 9.3.5. Cardiovascular Diseases
- 9.3.6. Other Therapeutic Areas
- 9.4. Market Analysis, Insights and Forecast - by Market Type
- 9.4.1. B2B
- 9.4.2. B2B2B
- 9.4.3. B2B2C
- 9.5. Market Analysis, Insights and Forecast - by Platform
- 9.5.1. Manufacturer-owned Digital Commerce
- 9.5.2. Distributor/Wholesaler-owned Digital Commerce
- 9.5.3. Manufacturer-owned Marketplace
- 9.5.4. Third Party Market Place
- 9.5.5. Retail
- 9.1. Market Analysis, Insights and Forecast - by Type
- 10. South America Global Pharmaceutical E-Commerce Market Analysis, Insights and Forecast, 2019-2031
- 10.1. Market Analysis, Insights and Forecast - by Type
- 10.1.1. Prescription
- 10.1.2. Over-the-counter (OTC)
- 10.2. Market Analysis, Insights and Forecast - by Product Type
- 10.2.1. Vaccines
- 10.2.2. Specialty Care
- 10.2.3. General Medicines
- 10.2.4. Consumer Healthcare
- 10.3. Market Analysis, Insights and Forecast - by Therapeutic Area
- 10.3.1. Diabetes
- 10.3.2. Immune-system Diseases
- 10.3.3. Cancer
- 10.3.4. Neurodegenerative Diseases
- 10.3.5. Cardiovascular Diseases
- 10.3.6. Other Therapeutic Areas
- 10.4. Market Analysis, Insights and Forecast - by Market Type
- 10.4.1. B2B
- 10.4.2. B2B2B
- 10.4.3. B2B2C
- 10.5. Market Analysis, Insights and Forecast - by Platform
- 10.5.1. Manufacturer-owned Digital Commerce
- 10.5.2. Distributor/Wholesaler-owned Digital Commerce
- 10.5.3. Manufacturer-owned Marketplace
- 10.5.4. Third Party Market Place
- 10.5.5. Retail
- 10.1. Market Analysis, Insights and Forecast - by Type
- 11. Competitive Analysis
- 11.1. Market Share Analysis 2024
- 11.2. Company Profiles
- 11.2.1 Amazon Inc
- 11.2.1.1. Overview
- 11.2.1.2. Products
- 11.2.1.3. SWOT Analysis
- 11.2.1.4. Recent Developments
- 11.2.1.5. Financials (Based on Availability)
- 11.2.2 Apotek
- 11.2.2.1. Overview
- 11.2.2.2. Products
- 11.2.2.3. SWOT Analysis
- 11.2.2.4. Recent Developments
- 11.2.2.5. Financials (Based on Availability)
- 11.2.3 DocMorris
- 11.2.3.1. Overview
- 11.2.3.2. Products
- 11.2.3.3. SWOT Analysis
- 11.2.3.4. Recent Developments
- 11.2.3.5. Financials (Based on Availability)
- 11.2.4 Express Scripts (Cigna)
- 11.2.4.1. Overview
- 11.2.4.2. Products
- 11.2.4.3. SWOT Analysis
- 11.2.4.4. Recent Developments
- 11.2.4.5. Financials (Based on Availability)
- 11.2.5 Giant Eagle Inc
- 11.2.5.1. Overview
- 11.2.5.2. Products
- 11.2.5.3. SWOT Analysis
- 11.2.5.4. Recent Developments
- 11.2.5.5. Financials (Based on Availability)
- 11.2.6 NetMeds
- 11.2.6.1. Overview
- 11.2.6.2. Products
- 11.2.6.3. SWOT Analysis
- 11.2.6.4. Recent Developments
- 11.2.6.5. Financials (Based on Availability)
- 11.2.7 Tata 1mg
- 11.2.7.1. Overview
- 11.2.7.2. Products
- 11.2.7.3. SWOT Analysis
- 11.2.7.4. Recent Developments
- 11.2.7.5. Financials (Based on Availability)
- 11.2.8 �Optum Inc �(UnitedHealth Group Inc )
- 11.2.8.1. Overview
- 11.2.8.2. Products
- 11.2.8.3. SWOT Analysis
- 11.2.8.4. Recent Developments
- 11.2.8.5. Financials (Based on Availability)
- 11.2.9 EMedStore
- 11.2.9.1. Overview
- 11.2.9.2. Products
- 11.2.9.3. SWOT Analysis
- 11.2.9.4. Recent Developments
- 11.2.9.5. Financials (Based on Availability)
- 11.2.10 Walgreen Co
- 11.2.10.1. Overview
- 11.2.10.2. Products
- 11.2.10.3. SWOT Analysis
- 11.2.10.4. Recent Developments
- 11.2.10.5. Financials (Based on Availability)
- 11.2.11 CVS Health
- 11.2.11.1. Overview
- 11.2.11.2. Products
- 11.2.11.3. SWOT Analysis
- 11.2.11.4. Recent Developments
- 11.2.11.5. Financials (Based on Availability)
- 11.2.12 �Apteka ru
- 11.2.12.1. Overview
- 11.2.12.2. Products
- 11.2.12.3. SWOT Analysis
- 11.2.12.4. Recent Developments
- 11.2.12.5. Financials (Based on Availability)
- 11.2.13 Rite Aid Corp
- 11.2.13.1. Overview
- 11.2.13.2. Products
- 11.2.13.3. SWOT Analysis
- 11.2.13.4. Recent Developments
- 11.2.13.5. Financials (Based on Availability)
- 11.2.14 shop-apotheke
- 11.2.14.1. Overview
- 11.2.14.2. Products
- 11.2.14.3. SWOT Analysis
- 11.2.14.4. Recent Developments
- 11.2.14.5. Financials (Based on Availability)
- 11.2.15 PharmEas
- 11.2.15.1. Overview
- 11.2.15.2. Products
- 11.2.15.3. SWOT Analysis
- 11.2.15.4. Recent Developments
- 11.2.15.5. Financials (Based on Availability)
- 11.2.1 Amazon Inc
List of Figures
- Figure 1: Global Global Pharmaceutical E-Commerce Market Revenue Breakdown (Million, %) by Region 2024 & 2032
- Figure 2: Global Global Pharmaceutical E-Commerce Market Volume Breakdown (Billion, %) by Region 2024 & 2032
- Figure 3: North America Global Pharmaceutical E-Commerce Market Revenue (Million), by Type 2024 & 2032
- Figure 4: North America Global Pharmaceutical E-Commerce Market Volume (Billion), by Type 2024 & 2032
- Figure 5: North America Global Pharmaceutical E-Commerce Market Revenue Share (%), by Type 2024 & 2032
- Figure 6: North America Global Pharmaceutical E-Commerce Market Volume Share (%), by Type 2024 & 2032
- Figure 7: North America Global Pharmaceutical E-Commerce Market Revenue (Million), by Product Type 2024 & 2032
- Figure 8: North America Global Pharmaceutical E-Commerce Market Volume (Billion), by Product Type 2024 & 2032
- Figure 9: North America Global Pharmaceutical E-Commerce Market Revenue Share (%), by Product Type 2024 & 2032
- Figure 10: North America Global Pharmaceutical E-Commerce Market Volume Share (%), by Product Type 2024 & 2032
- Figure 11: North America Global Pharmaceutical E-Commerce Market Revenue (Million), by Therapeutic Area 2024 & 2032
- Figure 12: North America Global Pharmaceutical E-Commerce Market Volume (Billion), by Therapeutic Area 2024 & 2032
- Figure 13: North America Global Pharmaceutical E-Commerce Market Revenue Share (%), by Therapeutic Area 2024 & 2032
- Figure 14: North America Global Pharmaceutical E-Commerce Market Volume Share (%), by Therapeutic Area 2024 & 2032
- Figure 15: North America Global Pharmaceutical E-Commerce Market Revenue (Million), by Market Type 2024 & 2032
- Figure 16: North America Global Pharmaceutical E-Commerce Market Volume (Billion), by Market Type 2024 & 2032
- Figure 17: North America Global Pharmaceutical E-Commerce Market Revenue Share (%), by Market Type 2024 & 2032
- Figure 18: North America Global Pharmaceutical E-Commerce Market Volume Share (%), by Market Type 2024 & 2032
- Figure 19: North America Global Pharmaceutical E-Commerce Market Revenue (Million), by Platform 2024 & 2032
- Figure 20: North America Global Pharmaceutical E-Commerce Market Volume (Billion), by Platform 2024 & 2032
- Figure 21: North America Global Pharmaceutical E-Commerce Market Revenue Share (%), by Platform 2024 & 2032
- Figure 22: North America Global Pharmaceutical E-Commerce Market Volume Share (%), by Platform 2024 & 2032
- Figure 23: North America Global Pharmaceutical E-Commerce Market Revenue (Million), by Country 2024 & 2032
- Figure 24: North America Global Pharmaceutical E-Commerce Market Volume (Billion), by Country 2024 & 2032
- Figure 25: North America Global Pharmaceutical E-Commerce Market Revenue Share (%), by Country 2024 & 2032
- Figure 26: North America Global Pharmaceutical E-Commerce Market Volume Share (%), by Country 2024 & 2032
- Figure 27: Europe Global Pharmaceutical E-Commerce Market Revenue (Million), by Type 2024 & 2032
- Figure 28: Europe Global Pharmaceutical E-Commerce Market Volume (Billion), by Type 2024 & 2032
- Figure 29: Europe Global Pharmaceutical E-Commerce Market Revenue Share (%), by Type 2024 & 2032
- Figure 30: Europe Global Pharmaceutical E-Commerce Market Volume Share (%), by Type 2024 & 2032
- Figure 31: Europe Global Pharmaceutical E-Commerce Market Revenue (Million), by Product Type 2024 & 2032
- Figure 32: Europe Global Pharmaceutical E-Commerce Market Volume (Billion), by Product Type 2024 & 2032
- Figure 33: Europe Global Pharmaceutical E-Commerce Market Revenue Share (%), by Product Type 2024 & 2032
- Figure 34: Europe Global Pharmaceutical E-Commerce Market Volume Share (%), by Product Type 2024 & 2032
- Figure 35: Europe Global Pharmaceutical E-Commerce Market Revenue (Million), by Therapeutic Area 2024 & 2032
- Figure 36: Europe Global Pharmaceutical E-Commerce Market Volume (Billion), by Therapeutic Area 2024 & 2032
- Figure 37: Europe Global Pharmaceutical E-Commerce Market Revenue Share (%), by Therapeutic Area 2024 & 2032
- Figure 38: Europe Global Pharmaceutical E-Commerce Market Volume Share (%), by Therapeutic Area 2024 & 2032
- Figure 39: Europe Global Pharmaceutical E-Commerce Market Revenue (Million), by Market Type 2024 & 2032
- Figure 40: Europe Global Pharmaceutical E-Commerce Market Volume (Billion), by Market Type 2024 & 2032
- Figure 41: Europe Global Pharmaceutical E-Commerce Market Revenue Share (%), by Market Type 2024 & 2032
- Figure 42: Europe Global Pharmaceutical E-Commerce Market Volume Share (%), by Market Type 2024 & 2032
- Figure 43: Europe Global Pharmaceutical E-Commerce Market Revenue (Million), by Platform 2024 & 2032
- Figure 44: Europe Global Pharmaceutical E-Commerce Market Volume (Billion), by Platform 2024 & 2032
- Figure 45: Europe Global Pharmaceutical E-Commerce Market Revenue Share (%), by Platform 2024 & 2032
- Figure 46: Europe Global Pharmaceutical E-Commerce Market Volume Share (%), by Platform 2024 & 2032
- Figure 47: Europe Global Pharmaceutical E-Commerce Market Revenue (Million), by Country 2024 & 2032
- Figure 48: Europe Global Pharmaceutical E-Commerce Market Volume (Billion), by Country 2024 & 2032
- Figure 49: Europe Global Pharmaceutical E-Commerce Market Revenue Share (%), by Country 2024 & 2032
- Figure 50: Europe Global Pharmaceutical E-Commerce Market Volume Share (%), by Country 2024 & 2032
- Figure 51: Asia Pacific Global Pharmaceutical E-Commerce Market Revenue (Million), by Type 2024 & 2032
- Figure 52: Asia Pacific Global Pharmaceutical E-Commerce Market Volume (Billion), by Type 2024 & 2032
- Figure 53: Asia Pacific Global Pharmaceutical E-Commerce Market Revenue Share (%), by Type 2024 & 2032
- Figure 54: Asia Pacific Global Pharmaceutical E-Commerce Market Volume Share (%), by Type 2024 & 2032
- Figure 55: Asia Pacific Global Pharmaceutical E-Commerce Market Revenue (Million), by Product Type 2024 & 2032
- Figure 56: Asia Pacific Global Pharmaceutical E-Commerce Market Volume (Billion), by Product Type 2024 & 2032
- Figure 57: Asia Pacific Global Pharmaceutical E-Commerce Market Revenue Share (%), by Product Type 2024 & 2032
- Figure 58: Asia Pacific Global Pharmaceutical E-Commerce Market Volume Share (%), by Product Type 2024 & 2032
- Figure 59: Asia Pacific Global Pharmaceutical E-Commerce Market Revenue (Million), by Therapeutic Area 2024 & 2032
- Figure 60: Asia Pacific Global Pharmaceutical E-Commerce Market Volume (Billion), by Therapeutic Area 2024 & 2032
- Figure 61: Asia Pacific Global Pharmaceutical E-Commerce Market Revenue Share (%), by Therapeutic Area 2024 & 2032
- Figure 62: Asia Pacific Global Pharmaceutical E-Commerce Market Volume Share (%), by Therapeutic Area 2024 & 2032
- Figure 63: Asia Pacific Global Pharmaceutical E-Commerce Market Revenue (Million), by Market Type 2024 & 2032
- Figure 64: Asia Pacific Global Pharmaceutical E-Commerce Market Volume (Billion), by Market Type 2024 & 2032
- Figure 65: Asia Pacific Global Pharmaceutical E-Commerce Market Revenue Share (%), by Market Type 2024 & 2032
- Figure 66: Asia Pacific Global Pharmaceutical E-Commerce Market Volume Share (%), by Market Type 2024 & 2032
- Figure 67: Asia Pacific Global Pharmaceutical E-Commerce Market Revenue (Million), by Platform 2024 & 2032
- Figure 68: Asia Pacific Global Pharmaceutical E-Commerce Market Volume (Billion), by Platform 2024 & 2032
- Figure 69: Asia Pacific Global Pharmaceutical E-Commerce Market Revenue Share (%), by Platform 2024 & 2032
- Figure 70: Asia Pacific Global Pharmaceutical E-Commerce Market Volume Share (%), by Platform 2024 & 2032
- Figure 71: Asia Pacific Global Pharmaceutical E-Commerce Market Revenue (Million), by Country 2024 & 2032
- Figure 72: Asia Pacific Global Pharmaceutical E-Commerce Market Volume (Billion), by Country 2024 & 2032
- Figure 73: Asia Pacific Global Pharmaceutical E-Commerce Market Revenue Share (%), by Country 2024 & 2032
- Figure 74: Asia Pacific Global Pharmaceutical E-Commerce Market Volume Share (%), by Country 2024 & 2032
- Figure 75: Middle East and Africa Global Pharmaceutical E-Commerce Market Revenue (Million), by Type 2024 & 2032
- Figure 76: Middle East and Africa Global Pharmaceutical E-Commerce Market Volume (Billion), by Type 2024 & 2032
- Figure 77: Middle East and Africa Global Pharmaceutical E-Commerce Market Revenue Share (%), by Type 2024 & 2032
- Figure 78: Middle East and Africa Global Pharmaceutical E-Commerce Market Volume Share (%), by Type 2024 & 2032
- Figure 79: Middle East and Africa Global Pharmaceutical E-Commerce Market Revenue (Million), by Product Type 2024 & 2032
- Figure 80: Middle East and Africa Global Pharmaceutical E-Commerce Market Volume (Billion), by Product Type 2024 & 2032
- Figure 81: Middle East and Africa Global Pharmaceutical E-Commerce Market Revenue Share (%), by Product Type 2024 & 2032
- Figure 82: Middle East and Africa Global Pharmaceutical E-Commerce Market Volume Share (%), by Product Type 2024 & 2032
- Figure 83: Middle East and Africa Global Pharmaceutical E-Commerce Market Revenue (Million), by Therapeutic Area 2024 & 2032
- Figure 84: Middle East and Africa Global Pharmaceutical E-Commerce Market Volume (Billion), by Therapeutic Area 2024 & 2032
- Figure 85: Middle East and Africa Global Pharmaceutical E-Commerce Market Revenue Share (%), by Therapeutic Area 2024 & 2032
- Figure 86: Middle East and Africa Global Pharmaceutical E-Commerce Market Volume Share (%), by Therapeutic Area 2024 & 2032
- Figure 87: Middle East and Africa Global Pharmaceutical E-Commerce Market Revenue (Million), by Market Type 2024 & 2032
- Figure 88: Middle East and Africa Global Pharmaceutical E-Commerce Market Volume (Billion), by Market Type 2024 & 2032
- Figure 89: Middle East and Africa Global Pharmaceutical E-Commerce Market Revenue Share (%), by Market Type 2024 & 2032
- Figure 90: Middle East and Africa Global Pharmaceutical E-Commerce Market Volume Share (%), by Market Type 2024 & 2032
- Figure 91: Middle East and Africa Global Pharmaceutical E-Commerce Market Revenue (Million), by Platform 2024 & 2032
- Figure 92: Middle East and Africa Global Pharmaceutical E-Commerce Market Volume (Billion), by Platform 2024 & 2032
- Figure 93: Middle East and Africa Global Pharmaceutical E-Commerce Market Revenue Share (%), by Platform 2024 & 2032
- Figure 94: Middle East and Africa Global Pharmaceutical E-Commerce Market Volume Share (%), by Platform 2024 & 2032
- Figure 95: Middle East and Africa Global Pharmaceutical E-Commerce Market Revenue (Million), by Country 2024 & 2032
- Figure 96: Middle East and Africa Global Pharmaceutical E-Commerce Market Volume (Billion), by Country 2024 & 2032
- Figure 97: Middle East and Africa Global Pharmaceutical E-Commerce Market Revenue Share (%), by Country 2024 & 2032
- Figure 98: Middle East and Africa Global Pharmaceutical E-Commerce Market Volume Share (%), by Country 2024 & 2032
- Figure 99: South America Global Pharmaceutical E-Commerce Market Revenue (Million), by Type 2024 & 2032
- Figure 100: South America Global Pharmaceutical E-Commerce Market Volume (Billion), by Type 2024 & 2032
- Figure 101: South America Global Pharmaceutical E-Commerce Market Revenue Share (%), by Type 2024 & 2032
- Figure 102: South America Global Pharmaceutical E-Commerce Market Volume Share (%), by Type 2024 & 2032
- Figure 103: South America Global Pharmaceutical E-Commerce Market Revenue (Million), by Product Type 2024 & 2032
- Figure 104: South America Global Pharmaceutical E-Commerce Market Volume (Billion), by Product Type 2024 & 2032
- Figure 105: South America Global Pharmaceutical E-Commerce Market Revenue Share (%), by Product Type 2024 & 2032
- Figure 106: South America Global Pharmaceutical E-Commerce Market Volume Share (%), by Product Type 2024 & 2032
- Figure 107: South America Global Pharmaceutical E-Commerce Market Revenue (Million), by Therapeutic Area 2024 & 2032
- Figure 108: South America Global Pharmaceutical E-Commerce Market Volume (Billion), by Therapeutic Area 2024 & 2032
- Figure 109: South America Global Pharmaceutical E-Commerce Market Revenue Share (%), by Therapeutic Area 2024 & 2032
- Figure 110: South America Global Pharmaceutical E-Commerce Market Volume Share (%), by Therapeutic Area 2024 & 2032
- Figure 111: South America Global Pharmaceutical E-Commerce Market Revenue (Million), by Market Type 2024 & 2032
- Figure 112: South America Global Pharmaceutical E-Commerce Market Volume (Billion), by Market Type 2024 & 2032
- Figure 113: South America Global Pharmaceutical E-Commerce Market Revenue Share (%), by Market Type 2024 & 2032
- Figure 114: South America Global Pharmaceutical E-Commerce Market Volume Share (%), by Market Type 2024 & 2032
- Figure 115: South America Global Pharmaceutical E-Commerce Market Revenue (Million), by Platform 2024 & 2032
- Figure 116: South America Global Pharmaceutical E-Commerce Market Volume (Billion), by Platform 2024 & 2032
- Figure 117: South America Global Pharmaceutical E-Commerce Market Revenue Share (%), by Platform 2024 & 2032
- Figure 118: South America Global Pharmaceutical E-Commerce Market Volume Share (%), by Platform 2024 & 2032
- Figure 119: South America Global Pharmaceutical E-Commerce Market Revenue (Million), by Country 2024 & 2032
- Figure 120: South America Global Pharmaceutical E-Commerce Market Volume (Billion), by Country 2024 & 2032
- Figure 121: South America Global Pharmaceutical E-Commerce Market Revenue Share (%), by Country 2024 & 2032
- Figure 122: South America Global Pharmaceutical E-Commerce Market Volume Share (%), by Country 2024 & 2032
List of Tables
- Table 1: Global Pharmaceutical E-Commerce Market Revenue Million Forecast, by Region 2019 & 2032
- Table 2: Global Pharmaceutical E-Commerce Market Volume Billion Forecast, by Region 2019 & 2032
- Table 3: Global Pharmaceutical E-Commerce Market Revenue Million Forecast, by Type 2019 & 2032
- Table 4: Global Pharmaceutical E-Commerce Market Volume Billion Forecast, by Type 2019 & 2032
- Table 5: Global Pharmaceutical E-Commerce Market Revenue Million Forecast, by Product Type 2019 & 2032
- Table 6: Global Pharmaceutical E-Commerce Market Volume Billion Forecast, by Product Type 2019 & 2032
- Table 7: Global Pharmaceutical E-Commerce Market Revenue Million Forecast, by Therapeutic Area 2019 & 2032
- Table 8: Global Pharmaceutical E-Commerce Market Volume Billion Forecast, by Therapeutic Area 2019 & 2032
- Table 9: Global Pharmaceutical E-Commerce Market Revenue Million Forecast, by Market Type 2019 & 2032
- Table 10: Global Pharmaceutical E-Commerce Market Volume Billion Forecast, by Market Type 2019 & 2032
- Table 11: Global Pharmaceutical E-Commerce Market Revenue Million Forecast, by Platform 2019 & 2032
- Table 12: Global Pharmaceutical E-Commerce Market Volume Billion Forecast, by Platform 2019 & 2032
- Table 13: Global Pharmaceutical E-Commerce Market Revenue Million Forecast, by Region 2019 & 2032
- Table 14: Global Pharmaceutical E-Commerce Market Volume Billion Forecast, by Region 2019 & 2032
- Table 15: Global Pharmaceutical E-Commerce Market Revenue Million Forecast, by Type 2019 & 2032
- Table 16: Global Pharmaceutical E-Commerce Market Volume Billion Forecast, by Type 2019 & 2032
- Table 17: Global Pharmaceutical E-Commerce Market Revenue Million Forecast, by Product Type 2019 & 2032
- Table 18: Global Pharmaceutical E-Commerce Market Volume Billion Forecast, by Product Type 2019 & 2032
- Table 19: Global Pharmaceutical E-Commerce Market Revenue Million Forecast, by Therapeutic Area 2019 & 2032
- Table 20: Global Pharmaceutical E-Commerce Market Volume Billion Forecast, by Therapeutic Area 2019 & 2032
- Table 21: Global Pharmaceutical E-Commerce Market Revenue Million Forecast, by Market Type 2019 & 2032
- Table 22: Global Pharmaceutical E-Commerce Market Volume Billion Forecast, by Market Type 2019 & 2032
- Table 23: Global Pharmaceutical E-Commerce Market Revenue Million Forecast, by Platform 2019 & 2032
- Table 24: Global Pharmaceutical E-Commerce Market Volume Billion Forecast, by Platform 2019 & 2032
- Table 25: Global Pharmaceutical E-Commerce Market Revenue Million Forecast, by Country 2019 & 2032
- Table 26: Global Pharmaceutical E-Commerce Market Volume Billion Forecast, by Country 2019 & 2032
- Table 27: United States Global Pharmaceutical E-Commerce Market Revenue (Million) Forecast, by Application 2019 & 2032
- Table 28: United States Global Pharmaceutical E-Commerce Market Volume (Billion) Forecast, by Application 2019 & 2032
- Table 29: Canada Global Pharmaceutical E-Commerce Market Revenue (Million) Forecast, by Application 2019 & 2032
- Table 30: Canada Global Pharmaceutical E-Commerce Market Volume (Billion) Forecast, by Application 2019 & 2032
- Table 31: Mexico Global Pharmaceutical E-Commerce Market Revenue (Million) Forecast, by Application 2019 & 2032
- Table 32: Mexico Global Pharmaceutical E-Commerce Market Volume (Billion) Forecast, by Application 2019 & 2032
- Table 33: Global Pharmaceutical E-Commerce Market Revenue Million Forecast, by Type 2019 & 2032
- Table 34: Global Pharmaceutical E-Commerce Market Volume Billion Forecast, by Type 2019 & 2032
- Table 35: Global Pharmaceutical E-Commerce Market Revenue Million Forecast, by Product Type 2019 & 2032
- Table 36: Global Pharmaceutical E-Commerce Market Volume Billion Forecast, by Product Type 2019 & 2032
- Table 37: Global Pharmaceutical E-Commerce Market Revenue Million Forecast, by Therapeutic Area 2019 & 2032
- Table 38: Global Pharmaceutical E-Commerce Market Volume Billion Forecast, by Therapeutic Area 2019 & 2032
- Table 39: Global Pharmaceutical E-Commerce Market Revenue Million Forecast, by Market Type 2019 & 2032
- Table 40: Global Pharmaceutical E-Commerce Market Volume Billion Forecast, by Market Type 2019 & 2032
- Table 41: Global Pharmaceutical E-Commerce Market Revenue Million Forecast, by Platform 2019 & 2032
- Table 42: Global Pharmaceutical E-Commerce Market Volume Billion Forecast, by Platform 2019 & 2032
- Table 43: Global Pharmaceutical E-Commerce Market Revenue Million Forecast, by Country 2019 & 2032
- Table 44: Global Pharmaceutical E-Commerce Market Volume Billion Forecast, by Country 2019 & 2032
- Table 45: United Kingdom Global Pharmaceutical E-Commerce Market Revenue (Million) Forecast, by Application 2019 & 2032
- Table 46: United Kingdom Global Pharmaceutical E-Commerce Market Volume (Billion) Forecast, by Application 2019 & 2032
- Table 47: Germany Global Pharmaceutical E-Commerce Market Revenue (Million) Forecast, by Application 2019 & 2032
- Table 48: Germany Global Pharmaceutical E-Commerce Market Volume (Billion) Forecast, by Application 2019 & 2032
- Table 49: France Global Pharmaceutical E-Commerce Market Revenue (Million) Forecast, by Application 2019 & 2032
- Table 50: France Global Pharmaceutical E-Commerce Market Volume (Billion) Forecast, by Application 2019 & 2032
- Table 51: Italy Global Pharmaceutical E-Commerce Market Revenue (Million) Forecast, by Application 2019 & 2032
- Table 52: Italy Global Pharmaceutical E-Commerce Market Volume (Billion) Forecast, by Application 2019 & 2032
- Table 53: Spain Global Pharmaceutical E-Commerce Market Revenue (Million) Forecast, by Application 2019 & 2032
- Table 54: Spain Global Pharmaceutical E-Commerce Market Volume (Billion) Forecast, by Application 2019 & 2032
- Table 55: Rest of Europe Global Pharmaceutical E-Commerce Market Revenue (Million) Forecast, by Application 2019 & 2032
- Table 56: Rest of Europe Global Pharmaceutical E-Commerce Market Volume (Billion) Forecast, by Application 2019 & 2032
- Table 57: Global Pharmaceutical E-Commerce Market Revenue Million Forecast, by Type 2019 & 2032
- Table 58: Global Pharmaceutical E-Commerce Market Volume Billion Forecast, by Type 2019 & 2032
- Table 59: Global Pharmaceutical E-Commerce Market Revenue Million Forecast, by Product Type 2019 & 2032
- Table 60: Global Pharmaceutical E-Commerce Market Volume Billion Forecast, by Product Type 2019 & 2032
- Table 61: Global Pharmaceutical E-Commerce Market Revenue Million Forecast, by Therapeutic Area 2019 & 2032
- Table 62: Global Pharmaceutical E-Commerce Market Volume Billion Forecast, by Therapeutic Area 2019 & 2032
- Table 63: Global Pharmaceutical E-Commerce Market Revenue Million Forecast, by Market Type 2019 & 2032
- Table 64: Global Pharmaceutical E-Commerce Market Volume Billion Forecast, by Market Type 2019 & 2032
- Table 65: Global Pharmaceutical E-Commerce Market Revenue Million Forecast, by Platform 2019 & 2032
- Table 66: Global Pharmaceutical E-Commerce Market Volume Billion Forecast, by Platform 2019 & 2032
- Table 67: Global Pharmaceutical E-Commerce Market Revenue Million Forecast, by Country 2019 & 2032
- Table 68: Global Pharmaceutical E-Commerce Market Volume Billion Forecast, by Country 2019 & 2032
- Table 69: China Global Pharmaceutical E-Commerce Market Revenue (Million) Forecast, by Application 2019 & 2032
- Table 70: China Global Pharmaceutical E-Commerce Market Volume (Billion) Forecast, by Application 2019 & 2032
- Table 71: Japan Global Pharmaceutical E-Commerce Market Revenue (Million) Forecast, by Application 2019 & 2032
- Table 72: Japan Global Pharmaceutical E-Commerce Market Volume (Billion) Forecast, by Application 2019 & 2032
- Table 73: India Global Pharmaceutical E-Commerce Market Revenue (Million) Forecast, by Application 2019 & 2032
- Table 74: India Global Pharmaceutical E-Commerce Market Volume (Billion) Forecast, by Application 2019 & 2032
- Table 75: Australia Global Pharmaceutical E-Commerce Market Revenue (Million) Forecast, by Application 2019 & 2032
- Table 76: Australia Global Pharmaceutical E-Commerce Market Volume (Billion) Forecast, by Application 2019 & 2032
- Table 77: South Korea Global Pharmaceutical E-Commerce Market Revenue (Million) Forecast, by Application 2019 & 2032
- Table 78: South Korea Global Pharmaceutical E-Commerce Market Volume (Billion) Forecast, by Application 2019 & 2032
- Table 79: Rest of Asia Pacific Global Pharmaceutical E-Commerce Market Revenue (Million) Forecast, by Application 2019 & 2032
- Table 80: Rest of Asia Pacific Global Pharmaceutical E-Commerce Market Volume (Billion) Forecast, by Application 2019 & 2032
- Table 81: Global Pharmaceutical E-Commerce Market Revenue Million Forecast, by Type 2019 & 2032
- Table 82: Global Pharmaceutical E-Commerce Market Volume Billion Forecast, by Type 2019 & 2032
- Table 83: Global Pharmaceutical E-Commerce Market Revenue Million Forecast, by Product Type 2019 & 2032
- Table 84: Global Pharmaceutical E-Commerce Market Volume Billion Forecast, by Product Type 2019 & 2032
- Table 85: Global Pharmaceutical E-Commerce Market Revenue Million Forecast, by Therapeutic Area 2019 & 2032
- Table 86: Global Pharmaceutical E-Commerce Market Volume Billion Forecast, by Therapeutic Area 2019 & 2032
- Table 87: Global Pharmaceutical E-Commerce Market Revenue Million Forecast, by Market Type 2019 & 2032
- Table 88: Global Pharmaceutical E-Commerce Market Volume Billion Forecast, by Market Type 2019 & 2032
- Table 89: Global Pharmaceutical E-Commerce Market Revenue Million Forecast, by Platform 2019 & 2032
- Table 90: Global Pharmaceutical E-Commerce Market Volume Billion Forecast, by Platform 2019 & 2032
- Table 91: Global Pharmaceutical E-Commerce Market Revenue Million Forecast, by Country 2019 & 2032
- Table 92: Global Pharmaceutical E-Commerce Market Volume Billion Forecast, by Country 2019 & 2032
- Table 93: GCC Global Pharmaceutical E-Commerce Market Revenue (Million) Forecast, by Application 2019 & 2032
- Table 94: GCC Global Pharmaceutical E-Commerce Market Volume (Billion) Forecast, by Application 2019 & 2032
- Table 95: South Africa Global Pharmaceutical E-Commerce Market Revenue (Million) Forecast, by Application 2019 & 2032
- Table 96: South Africa Global Pharmaceutical E-Commerce Market Volume (Billion) Forecast, by Application 2019 & 2032
- Table 97: Rest of Middle East and Africa Global Pharmaceutical E-Commerce Market Revenue (Million) Forecast, by Application 2019 & 2032
- Table 98: Rest of Middle East and Africa Global Pharmaceutical E-Commerce Market Volume (Billion) Forecast, by Application 2019 & 2032
- Table 99: Global Pharmaceutical E-Commerce Market Revenue Million Forecast, by Type 2019 & 2032
- Table 100: Global Pharmaceutical E-Commerce Market Volume Billion Forecast, by Type 2019 & 2032
- Table 101: Global Pharmaceutical E-Commerce Market Revenue Million Forecast, by Product Type 2019 & 2032
- Table 102: Global Pharmaceutical E-Commerce Market Volume Billion Forecast, by Product Type 2019 & 2032
- Table 103: Global Pharmaceutical E-Commerce Market Revenue Million Forecast, by Therapeutic Area 2019 & 2032
- Table 104: Global Pharmaceutical E-Commerce Market Volume Billion Forecast, by Therapeutic Area 2019 & 2032
- Table 105: Global Pharmaceutical E-Commerce Market Revenue Million Forecast, by Market Type 2019 & 2032
- Table 106: Global Pharmaceutical E-Commerce Market Volume Billion Forecast, by Market Type 2019 & 2032
- Table 107: Global Pharmaceutical E-Commerce Market Revenue Million Forecast, by Platform 2019 & 2032
- Table 108: Global Pharmaceutical E-Commerce Market Volume Billion Forecast, by Platform 2019 & 2032
- Table 109: Global Pharmaceutical E-Commerce Market Revenue Million Forecast, by Country 2019 & 2032
- Table 110: Global Pharmaceutical E-Commerce Market Volume Billion Forecast, by Country 2019 & 2032
- Table 111: Brazil Global Pharmaceutical E-Commerce Market Revenue (Million) Forecast, by Application 2019 & 2032
- Table 112: Brazil Global Pharmaceutical E-Commerce Market Volume (Billion) Forecast, by Application 2019 & 2032
- Table 113: Argentina Global Pharmaceutical E-Commerce Market Revenue (Million) Forecast, by Application 2019 & 2032
- Table 114: Argentina Global Pharmaceutical E-Commerce Market Volume (Billion) Forecast, by Application 2019 & 2032
- Table 115: Rest of South America Global Pharmaceutical E-Commerce Market Revenue (Million) Forecast, by Application 2019 & 2032
- Table 116: Rest of South America Global Pharmaceutical E-Commerce Market Volume (Billion) Forecast, by Application 2019 & 2032
Frequently Asked Questions
1. What is the projected Compound Annual Growth Rate (CAGR) of the Global Pharmaceutical E-Commerce Market?
The projected CAGR is approximately 12.10%.
2. Which companies are prominent players in the Global Pharmaceutical E-Commerce Market?
Key companies in the market include Amazon Inc, Apotek, DocMorris, Express Scripts (Cigna), Giant Eagle Inc, NetMeds, Tata 1mg, �Optum Inc �(UnitedHealth Group Inc ), EMedStore, Walgreen Co, CVS Health, �Apteka ru, Rite Aid Corp, shop-apotheke, PharmEas.
3. What are the main segments of the Global Pharmaceutical E-Commerce Market?
The market segments include Type, Product Type, Therapeutic Area, Market Type, Platform.
4. Can you provide details about the market size?
The market size is estimated to be USD 209.59 Million as of 2022.
5. What are some drivers contributing to market growth?
Increasing Smartphone Penetration and Growing Demand for E-pharmacies; Rising Prevalence of Chronic Diseases; Convenience and Other Benefits Offered by E-pharmacies.
6. What are the notable trends driving market growth?
The Cancer Segment is Expected to Exhibit a Significant Growth Rate During the Forecast Period.
7. Are there any restraints impacting market growth?
Increasing Smartphone Penetration and Growing Demand for E-pharmacies; Rising Prevalence of Chronic Diseases; Convenience and Other Benefits Offered by E-pharmacies.
8. Can you provide examples of recent developments in the market?
March 2024: Eli Lilly partnered with Amazon Pharmacy to deliver the weight loss drug Zepbound and other medicines from its direct-to-consumer website.
9. What pricing options are available for accessing the report?
Pricing options include single-user, multi-user, and enterprise licenses priced at USD 4750, USD 5250, and USD 8750 respectively.
10. Is the market size provided in terms of value or volume?
The market size is provided in terms of value, measured in Million and volume, measured in Billion.
11. Are there any specific market keywords associated with the report?
Yes, the market keyword associated with the report is "Global Pharmaceutical E-Commerce Market," which aids in identifying and referencing the specific market segment covered.
12. How do I determine which pricing option suits my needs best?
The pricing options vary based on user requirements and access needs. Individual users may opt for single-user licenses, while businesses requiring broader access may choose multi-user or enterprise licenses for cost-effective access to the report.
13. Are there any additional resources or data provided in the Global Pharmaceutical E-Commerce Market report?
While the report offers comprehensive insights, it's advisable to review the specific contents or supplementary materials provided to ascertain if additional resources or data are available.
14. How can I stay updated on further developments or reports in the Global Pharmaceutical E-Commerce Market?
To stay informed about further developments, trends, and reports in the Global Pharmaceutical E-Commerce Market, consider subscribing to industry newsletters, following relevant companies and organizations, or regularly checking reputable industry news sources and publications.
Methodology
Step 1 - Identification of Relevant Samples Size from Population Database


Step 2 - Approaches for Defining Global Market Size (Value, Volume* & Price*)

Note*: In applicable scenarios
Step 3 - Data Sources
Primary Research
- Web Analytics
- Survey Reports
- Research Institute
- Latest Research Reports
- Opinion Leaders
Secondary Research
- Annual Reports
- White Paper
- Latest Press Release
- Industry Association
- Paid Database
- Investor Presentations

Step 4 - Data Triangulation
Involves using different sources of information in order to increase the validity of a study
These sources are likely to be stakeholders in a program - participants, other researchers, program staff, other community members, and so on.
Then we put all data in single framework & apply various statistical tools to find out the dynamic on the market.
During the analysis stage, feedback from the stakeholder groups would be compared to determine areas of agreement as well as areas of divergence


