
Key Insights
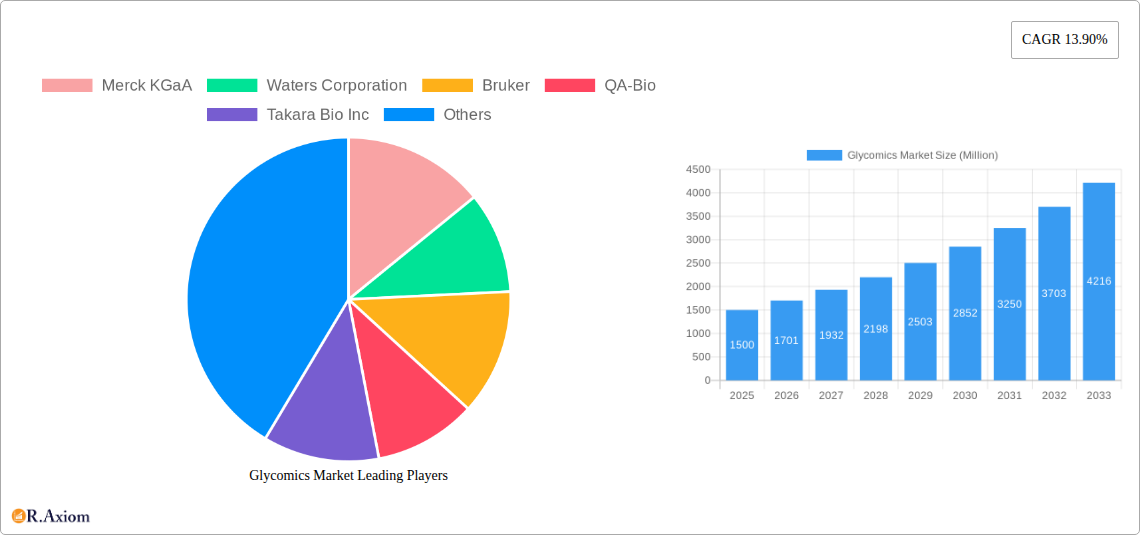
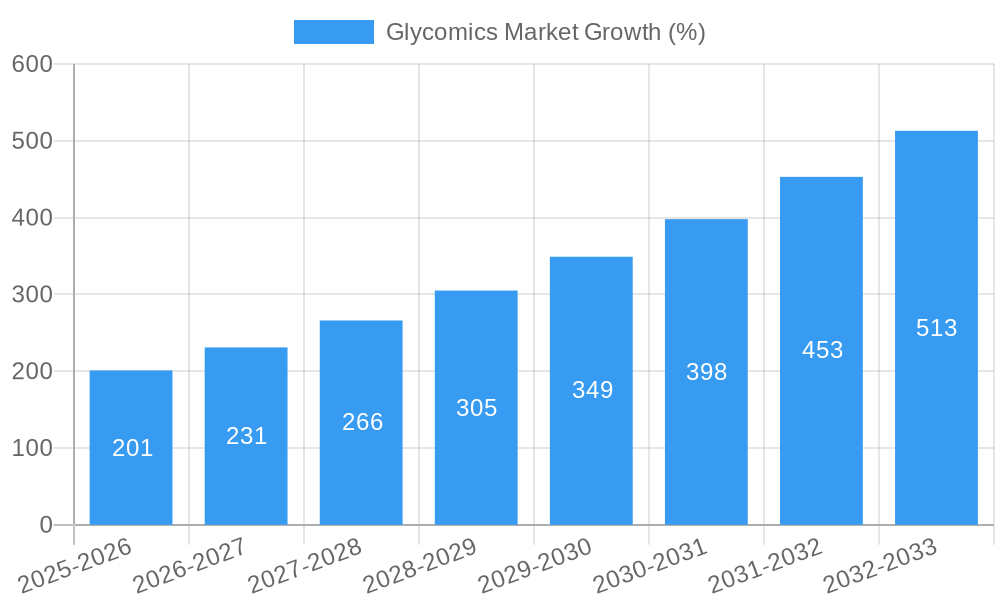
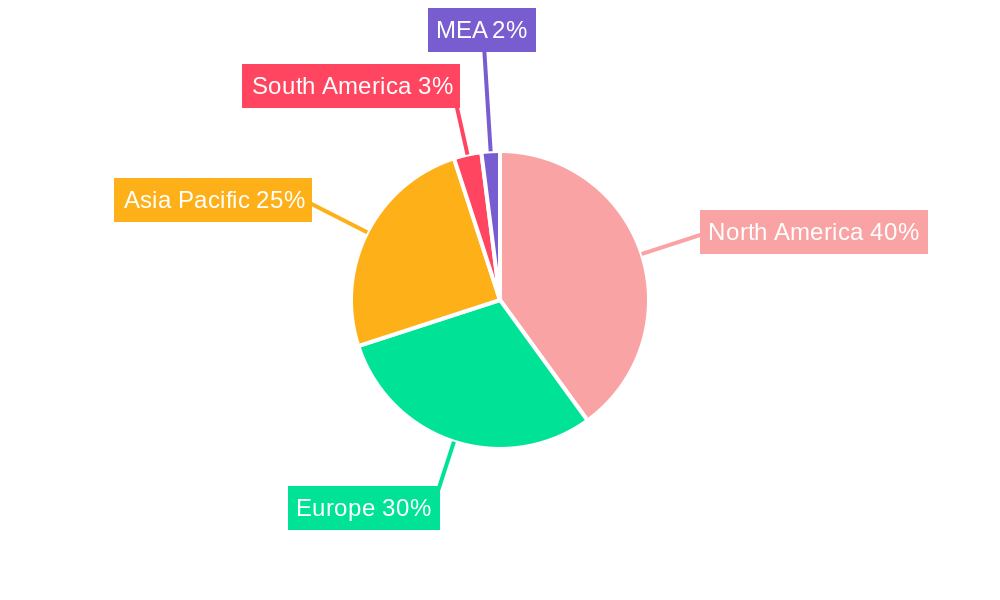
The global glycomics market is experiencing robust growth, driven by the increasing prevalence of chronic diseases like cancer and diabetes, the rising demand for personalized medicine, and advancements in glycomics technologies. The market's compound annual growth rate (CAGR) of 13.90% from 2019 to 2024 suggests a significant expansion, projected to continue through 2033. Key market segments include instruments, reagents and kits, and enzymes, which are utilized across drug development, diagnostics, and other applications. North America currently holds a significant market share due to the presence of major research institutions and pharmaceutical companies, along with robust funding for research and development in this area. However, the Asia-Pacific region is anticipated to witness the fastest growth, propelled by increasing healthcare spending and a growing awareness of glycomics' importance in disease management. The market is segmented further by application, with drug development and diagnostics representing the largest segments. Competitive players such as Merck KGaA, Waters Corporation, and Thermo Fisher Scientific are driving innovation and expansion through continuous product development and strategic acquisitions. Challenges faced by the market include the high cost of glycomics analysis and the complexity of glycan structures, which can hinder widespread adoption. Nevertheless, ongoing technological advancements are expected to alleviate some of these barriers and contribute to the market’s continued growth.
The substantial growth projections for the glycomics market are further bolstered by the escalating demand for efficient diagnostic tools and targeted therapies for complex diseases. The increasing integration of glycomics with other ‘omics’ technologies, such as genomics and proteomics, is also opening new avenues for research and development. This multi-omics approach allows for a more comprehensive understanding of disease mechanisms, paving the way for more effective treatments and improved patient outcomes. This, in turn, stimulates further investment and growth within the glycomics sector. Continued government support and funding for glycomics research, coupled with an increasing focus on personalized medicine tailored to individual glycan profiles, are major contributing factors to the market's promising future. The competitive landscape is dynamic, with both established players and emerging companies continuously striving to innovate and capture market share.
This comprehensive report provides an in-depth analysis of the global glycomics market, offering actionable insights for stakeholders across the value chain. The study covers the period from 2019 to 2033, with 2025 serving as the base year and estimated year. The report segments the market by product type (Instruments, Reagents and Kits, Enzymes) and application (Drug Development, Diagnostics, Other Applications), providing detailed market size estimations and growth projections. Key players like Merck KGaA, Waters Corporation, and others are profiled, offering competitive landscape analysis and strategic recommendations.
Glycomics Market Market Concentration & Innovation
The glycomics market exhibits a moderately concentrated structure, with a handful of major players holding significant market share. Merck KGaA, Waters Corporation, and Thermo Fisher Scientific Inc. collectively account for approximately xx% of the global market in 2025, driven by their strong technological capabilities and extensive product portfolios. However, the market is also witnessing the entry of several smaller players, particularly in the reagents and kits segment. Innovation is a key driver, with significant investments in developing advanced analytical techniques like mass spectrometry and microarrays. Regulatory frameworks, particularly in the diagnostic application area, play a crucial role in shaping market growth. The industry witnesses significant M&A activity, with an estimated xx Million in deal values in 2024. Several factors influence the market, including:
- Market Share Dynamics: The top 5 players in 2025 hold approximately xx% market share.
- M&A Activity: Deal values in 2024 were estimated at xx Million, representing a xx% increase compared to 2023.
- Regulatory Landscape: Stringent regulatory approvals drive innovation and impact market access.
- Product Substitutes: Emerging technologies such as next-generation sequencing offer potential substitutes.
- End-User Trends: Growing demand for personalized medicine fuels the adoption of glycomics technologies.
Glycomics Market Industry Trends & Insights
The global glycomics market is experiencing robust growth, driven by several key factors. The increasing prevalence of chronic diseases such as cancer and diabetes, coupled with the rising demand for personalized medicine, is fueling the demand for glycomics-based diagnostics and therapeutics. Technological advancements in mass spectrometry and other analytical techniques are enabling higher throughput and more precise glycan analysis, enhancing market penetration. The market's CAGR from 2025-2033 is projected to be xx%, driven by factors such as:
- Rising prevalence of chronic diseases
- Growing demand for personalized medicine
- Technological advancements in glycan analysis techniques
- Increased research and development activities in glycomics
- Growing government initiatives and funding for research in glycomics
The competitive landscape is characterized by both established players and emerging companies vying for market share. Strategic partnerships, collaborations, and acquisitions are prevalent strategies employed by companies to expand their product offerings and market reach. Market penetration is expected to reach xx% by 2033 in key markets.
Dominant Markets & Segments in Glycomics Market
The North American region dominates the global glycomics market, holding the largest market share in 2025 due to factors such as:
Well-established healthcare infrastructure: Advanced research facilities and well-funded R&D programs contribute to higher market penetration.
High prevalence of chronic diseases: The region has a higher prevalence of diseases like cancer and diabetes, driving the demand for glycomics-based diagnostics and therapeutics.
Favorable regulatory environment: The regulatory landscape in North America supports the development and commercialization of glycomics-based products.
By Product Type: The reagents and kits segment holds the largest market share, driven by the rising demand for accurate and reliable glycan analysis techniques.
By Application: The drug development segment is expected to witness the fastest growth during the forecast period due to increasing focus on developing glycan-based therapeutics.
Within North America, the United States dominates, primarily due to extensive R&D investments and the presence of numerous research institutions. Other regions, such as Europe and Asia Pacific, are also experiencing significant growth, although at a slower pace compared to North America.
Glycomics Market Product Developments
Significant advancements are occurring in glycomics technologies, including the development of novel instrumentation for high-throughput glycan analysis, improved reagents and kits for glycan purification and labeling, and advanced bioinformatics tools for data analysis. These innovations are improving the accuracy, sensitivity, and speed of glycan analysis, leading to better diagnostic and therapeutic applications and a stronger market fit. The focus is increasingly on automation and miniaturization to make the technology more accessible and cost-effective.
Report Scope & Segmentation Analysis
The report provides a detailed segmentation analysis of the glycomics market based on product type and application.
- By Product Type: Instruments, Reagents & Kits, and Enzymes. Each segment's growth projections, market size, and competitive dynamics are analyzed.
- By Application: Drug Development, Diagnostics, and Other Applications. This section details the market size, growth rates, and key factors driving growth in each application area. The competitive landscape within each segment is analyzed, highlighting key players and their market strategies.
Key Drivers of Glycomics Market Growth
Several factors drive the growth of the glycomics market, including:
- Technological advancements: Innovations in analytical techniques, such as mass spectrometry and microarrays, enhance the accuracy and efficiency of glycan analysis.
- Rising prevalence of chronic diseases: The growing incidence of chronic conditions like cancer and diabetes increases the demand for glycomics-based diagnostics and therapeutics.
- Government funding and initiatives: Increased government support for glycomics research and development fuels innovation and market expansion.
Challenges in the Glycomics Market Sector
Challenges in the glycomics market include:
- High cost of instrumentation and reagents: The cost of advanced equipment and specialized reagents can limit market access, particularly for smaller players.
- Complex glycan structures: The complex nature of glycans poses analytical challenges, requiring sophisticated techniques and expertise.
- Lack of standardized methodologies: The absence of widely accepted standardized protocols for glycan analysis can hinder data comparability and interpretation.
Emerging Opportunities in Glycomics Market
Emerging opportunities in the glycomics market include:
- Development of novel glycan-based therapeutics: Glycans hold immense potential as therapeutic targets and drug delivery vehicles.
- Expansion into new applications: Glycomics technology can be applied to diverse fields, such as personalized medicine, food science, and environmental monitoring.
- Development of point-of-care diagnostic tools: Portable and rapid glycomics-based diagnostic tests can improve accessibility and efficiency of diagnostics.
Leading Players in the Glycomics Market Market
- Merck KGaA
- Waters Corporation
- Bruker
- QA-Bio
- Takara Bio Inc
- Agilent Technologies Inc
- New England Biolabs Inc
- Shimadzu Corporation
- Danaher (SCIEX)
- ThermoFisher Scientific Inc
Key Developments in Glycomics Market Industry
- January 2023: Company X launched a new high-throughput glycan analysis platform.
- March 2024: Company Y acquired Company Z, expanding its product portfolio in the glycomics market.
- June 2025: New regulatory guidelines were released, impacting market access for glycomics-based diagnostics. (Further bullet points detailing other key developments can be added here.)
Strategic Outlook for Glycomics Market Market
The glycomics market is poised for significant growth in the coming years, driven by several factors including the increasing prevalence of chronic diseases, technological advancements, and growing government funding. The focus on personalized medicine and the development of novel glycan-based therapeutics present significant opportunities for companies to capture market share and drive revenue growth. The market is expected to continue its expansion, with significant opportunities in both developed and developing markets.
Glycomics Market Segmentation
-
1. Product Type
- 1.1. Instruments
- 1.2. Reagents and Kits
- 1.3. Enzymes
-
2. Application
- 2.1. Drug Development
- 2.2. Diagnostics
- 2.3. Other Applications
Glycomics Market Segmentation By Geography
-
1. North America
- 1.1. United States
- 1.2. Canada
- 1.3. Mexico
-
2. Europe
- 2.1. Germany
- 2.2. United Kingdom
- 2.3. France
- 2.4. Italy
- 2.5. Spain
- 2.6. Rest of Europe
-
3. Asia Pacific
- 3.1. China
- 3.2. Japan
- 3.3. India
- 3.4. Australia
- 3.5. South Korea
- 3.6. Rest of Asia Pacific
- 4. Rest of the World
Glycomics Market REPORT HIGHLIGHTS
| Aspects | Details |
|---|---|
| Study Period | 2019-2033 |
| Base Year | 2024 |
| Estimated Year | 2025 |
| Forecast Period | 2025-2033 |
| Historical Period | 2019-2024 |
| Growth Rate | CAGR of 13.90% from 2019-2033 |
| Segmentation |
|
Table of Contents
- 1. Introduction
- 1.1. Research Scope
- 1.2. Market Segmentation
- 1.3. Research Methodology
- 1.4. Definitions and Assumptions
- 2. Executive Summary
- 2.1. Introduction
- 3. Market Dynamics
- 3.1. Introduction
- 3.2. Market Drivers
- 3.2.1. ; Increasing Research and Development Activities in Glycomics; Technological Advancements in Products
- 3.3. Market Restrains
- 3.3.1. ; Complexity of Glycomics Coupled With The High Cost Involved in the Process
- 3.4. Market Trends
- 3.4.1. Drug Discovery and Development Segment is Expected to Hold a Major Market Share in the Glycomics Market
- 4. Market Factor Analysis
- 4.1. Porters Five Forces
- 4.2. Supply/Value Chain
- 4.3. PESTEL analysis
- 4.4. Market Entropy
- 4.5. Patent/Trademark Analysis
- 5. Global Glycomics Market Analysis, Insights and Forecast, 2019-2031
- 5.1. Market Analysis, Insights and Forecast - by Product Type
- 5.1.1. Instruments
- 5.1.2. Reagents and Kits
- 5.1.3. Enzymes
- 5.2. Market Analysis, Insights and Forecast - by Application
- 5.2.1. Drug Development
- 5.2.2. Diagnostics
- 5.2.3. Other Applications
- 5.3. Market Analysis, Insights and Forecast - by Region
- 5.3.1. North America
- 5.3.2. Europe
- 5.3.3. Asia Pacific
- 5.3.4. Rest of the World
- 5.1. Market Analysis, Insights and Forecast - by Product Type
- 6. North America Glycomics Market Analysis, Insights and Forecast, 2019-2031
- 6.1. Market Analysis, Insights and Forecast - by Product Type
- 6.1.1. Instruments
- 6.1.2. Reagents and Kits
- 6.1.3. Enzymes
- 6.2. Market Analysis, Insights and Forecast - by Application
- 6.2.1. Drug Development
- 6.2.2. Diagnostics
- 6.2.3. Other Applications
- 6.1. Market Analysis, Insights and Forecast - by Product Type
- 7. Europe Glycomics Market Analysis, Insights and Forecast, 2019-2031
- 7.1. Market Analysis, Insights and Forecast - by Product Type
- 7.1.1. Instruments
- 7.1.2. Reagents and Kits
- 7.1.3. Enzymes
- 7.2. Market Analysis, Insights and Forecast - by Application
- 7.2.1. Drug Development
- 7.2.2. Diagnostics
- 7.2.3. Other Applications
- 7.1. Market Analysis, Insights and Forecast - by Product Type
- 8. Asia Pacific Glycomics Market Analysis, Insights and Forecast, 2019-2031
- 8.1. Market Analysis, Insights and Forecast - by Product Type
- 8.1.1. Instruments
- 8.1.2. Reagents and Kits
- 8.1.3. Enzymes
- 8.2. Market Analysis, Insights and Forecast - by Application
- 8.2.1. Drug Development
- 8.2.2. Diagnostics
- 8.2.3. Other Applications
- 8.1. Market Analysis, Insights and Forecast - by Product Type
- 9. Rest of the World Glycomics Market Analysis, Insights and Forecast, 2019-2031
- 9.1. Market Analysis, Insights and Forecast - by Product Type
- 9.1.1. Instruments
- 9.1.2. Reagents and Kits
- 9.1.3. Enzymes
- 9.2. Market Analysis, Insights and Forecast - by Application
- 9.2.1. Drug Development
- 9.2.2. Diagnostics
- 9.2.3. Other Applications
- 9.1. Market Analysis, Insights and Forecast - by Product Type
- 10. North America Glycomics Market Analysis, Insights and Forecast, 2019-2031
- 10.1. Market Analysis, Insights and Forecast - By Country/Sub-region
- 10.1.1 United States
- 10.1.2 Canada
- 10.1.3 Mexico
- 11. Europe Glycomics Market Analysis, Insights and Forecast, 2019-2031
- 11.1. Market Analysis, Insights and Forecast - By Country/Sub-region
- 11.1.1 Germany
- 11.1.2 United Kingdom
- 11.1.3 France
- 11.1.4 Spain
- 11.1.5 Italy
- 11.1.6 Spain
- 11.1.7 Belgium
- 11.1.8 Netherland
- 11.1.9 Nordics
- 11.1.10 Rest of Europe
- 12. Asia Pacific Glycomics Market Analysis, Insights and Forecast, 2019-2031
- 12.1. Market Analysis, Insights and Forecast - By Country/Sub-region
- 12.1.1 China
- 12.1.2 Japan
- 12.1.3 India
- 12.1.4 South Korea
- 12.1.5 Southeast Asia
- 12.1.6 Australia
- 12.1.7 Indonesia
- 12.1.8 Phillipes
- 12.1.9 Singapore
- 12.1.10 Thailandc
- 12.1.11 Rest of Asia Pacific
- 13. South America Glycomics Market Analysis, Insights and Forecast, 2019-2031
- 13.1. Market Analysis, Insights and Forecast - By Country/Sub-region
- 13.1.1 Brazil
- 13.1.2 Argentina
- 13.1.3 Peru
- 13.1.4 Chile
- 13.1.5 Colombia
- 13.1.6 Ecuador
- 13.1.7 Venezuela
- 13.1.8 Rest of South America
- 14. North America Glycomics Market Analysis, Insights and Forecast, 2019-2031
- 14.1. Market Analysis, Insights and Forecast - By Country/Sub-region
- 14.1.1 United States
- 14.1.2 Canada
- 14.1.3 Mexico
- 15. MEA Glycomics Market Analysis, Insights and Forecast, 2019-2031
- 15.1. Market Analysis, Insights and Forecast - By Country/Sub-region
- 15.1.1 United Arab Emirates
- 15.1.2 Saudi Arabia
- 15.1.3 South Africa
- 15.1.4 Rest of Middle East and Africa
- 16. Competitive Analysis
- 16.1. Global Market Share Analysis 2024
- 16.2. Company Profiles
- 16.2.1 Merck KGaA
- 16.2.1.1. Overview
- 16.2.1.2. Products
- 16.2.1.3. SWOT Analysis
- 16.2.1.4. Recent Developments
- 16.2.1.5. Financials (Based on Availability)
- 16.2.2 Waters Corporation
- 16.2.2.1. Overview
- 16.2.2.2. Products
- 16.2.2.3. SWOT Analysis
- 16.2.2.4. Recent Developments
- 16.2.2.5. Financials (Based on Availability)
- 16.2.3 Bruker
- 16.2.3.1. Overview
- 16.2.3.2. Products
- 16.2.3.3. SWOT Analysis
- 16.2.3.4. Recent Developments
- 16.2.3.5. Financials (Based on Availability)
- 16.2.4 QA-Bio
- 16.2.4.1. Overview
- 16.2.4.2. Products
- 16.2.4.3. SWOT Analysis
- 16.2.4.4. Recent Developments
- 16.2.4.5. Financials (Based on Availability)
- 16.2.5 Takara Bio Inc
- 16.2.5.1. Overview
- 16.2.5.2. Products
- 16.2.5.3. SWOT Analysis
- 16.2.5.4. Recent Developments
- 16.2.5.5. Financials (Based on Availability)
- 16.2.6 Agilent Technologies Inc
- 16.2.6.1. Overview
- 16.2.6.2. Products
- 16.2.6.3. SWOT Analysis
- 16.2.6.4. Recent Developments
- 16.2.6.5. Financials (Based on Availability)
- 16.2.7 New England Biolabs Inc
- 16.2.7.1. Overview
- 16.2.7.2. Products
- 16.2.7.3. SWOT Analysis
- 16.2.7.4. Recent Developments
- 16.2.7.5. Financials (Based on Availability)
- 16.2.8 Shimadzu Corporation
- 16.2.8.1. Overview
- 16.2.8.2. Products
- 16.2.8.3. SWOT Analysis
- 16.2.8.4. Recent Developments
- 16.2.8.5. Financials (Based on Availability)
- 16.2.9 Danaher (SCIEX)
- 16.2.9.1. Overview
- 16.2.9.2. Products
- 16.2.9.3. SWOT Analysis
- 16.2.9.4. Recent Developments
- 16.2.9.5. Financials (Based on Availability)
- 16.2.10 ThermoFisher Scientific Inc
- 16.2.10.1. Overview
- 16.2.10.2. Products
- 16.2.10.3. SWOT Analysis
- 16.2.10.4. Recent Developments
- 16.2.10.5. Financials (Based on Availability)
- 16.2.1 Merck KGaA
List of Figures
- Figure 1: Global Glycomics Market Revenue Breakdown (Million, %) by Region 2024 & 2032
- Figure 2: Global Glycomics Market Volume Breakdown (K Unit, %) by Region 2024 & 2032
- Figure 3: North America Glycomics Market Revenue (Million), by Country 2024 & 2032
- Figure 4: North America Glycomics Market Volume (K Unit), by Country 2024 & 2032
- Figure 5: North America Glycomics Market Revenue Share (%), by Country 2024 & 2032
- Figure 6: North America Glycomics Market Volume Share (%), by Country 2024 & 2032
- Figure 7: Europe Glycomics Market Revenue (Million), by Country 2024 & 2032
- Figure 8: Europe Glycomics Market Volume (K Unit), by Country 2024 & 2032
- Figure 9: Europe Glycomics Market Revenue Share (%), by Country 2024 & 2032
- Figure 10: Europe Glycomics Market Volume Share (%), by Country 2024 & 2032
- Figure 11: Asia Pacific Glycomics Market Revenue (Million), by Country 2024 & 2032
- Figure 12: Asia Pacific Glycomics Market Volume (K Unit), by Country 2024 & 2032
- Figure 13: Asia Pacific Glycomics Market Revenue Share (%), by Country 2024 & 2032
- Figure 14: Asia Pacific Glycomics Market Volume Share (%), by Country 2024 & 2032
- Figure 15: South America Glycomics Market Revenue (Million), by Country 2024 & 2032
- Figure 16: South America Glycomics Market Volume (K Unit), by Country 2024 & 2032
- Figure 17: South America Glycomics Market Revenue Share (%), by Country 2024 & 2032
- Figure 18: South America Glycomics Market Volume Share (%), by Country 2024 & 2032
- Figure 19: North America Glycomics Market Revenue (Million), by Country 2024 & 2032
- Figure 20: North America Glycomics Market Volume (K Unit), by Country 2024 & 2032
- Figure 21: North America Glycomics Market Revenue Share (%), by Country 2024 & 2032
- Figure 22: North America Glycomics Market Volume Share (%), by Country 2024 & 2032
- Figure 23: MEA Glycomics Market Revenue (Million), by Country 2024 & 2032
- Figure 24: MEA Glycomics Market Volume (K Unit), by Country 2024 & 2032
- Figure 25: MEA Glycomics Market Revenue Share (%), by Country 2024 & 2032
- Figure 26: MEA Glycomics Market Volume Share (%), by Country 2024 & 2032
- Figure 27: North America Glycomics Market Revenue (Million), by Product Type 2024 & 2032
- Figure 28: North America Glycomics Market Volume (K Unit), by Product Type 2024 & 2032
- Figure 29: North America Glycomics Market Revenue Share (%), by Product Type 2024 & 2032
- Figure 30: North America Glycomics Market Volume Share (%), by Product Type 2024 & 2032
- Figure 31: North America Glycomics Market Revenue (Million), by Application 2024 & 2032
- Figure 32: North America Glycomics Market Volume (K Unit), by Application 2024 & 2032
- Figure 33: North America Glycomics Market Revenue Share (%), by Application 2024 & 2032
- Figure 34: North America Glycomics Market Volume Share (%), by Application 2024 & 2032
- Figure 35: North America Glycomics Market Revenue (Million), by Country 2024 & 2032
- Figure 36: North America Glycomics Market Volume (K Unit), by Country 2024 & 2032
- Figure 37: North America Glycomics Market Revenue Share (%), by Country 2024 & 2032
- Figure 38: North America Glycomics Market Volume Share (%), by Country 2024 & 2032
- Figure 39: Europe Glycomics Market Revenue (Million), by Product Type 2024 & 2032
- Figure 40: Europe Glycomics Market Volume (K Unit), by Product Type 2024 & 2032
- Figure 41: Europe Glycomics Market Revenue Share (%), by Product Type 2024 & 2032
- Figure 42: Europe Glycomics Market Volume Share (%), by Product Type 2024 & 2032
- Figure 43: Europe Glycomics Market Revenue (Million), by Application 2024 & 2032
- Figure 44: Europe Glycomics Market Volume (K Unit), by Application 2024 & 2032
- Figure 45: Europe Glycomics Market Revenue Share (%), by Application 2024 & 2032
- Figure 46: Europe Glycomics Market Volume Share (%), by Application 2024 & 2032
- Figure 47: Europe Glycomics Market Revenue (Million), by Country 2024 & 2032
- Figure 48: Europe Glycomics Market Volume (K Unit), by Country 2024 & 2032
- Figure 49: Europe Glycomics Market Revenue Share (%), by Country 2024 & 2032
- Figure 50: Europe Glycomics Market Volume Share (%), by Country 2024 & 2032
- Figure 51: Asia Pacific Glycomics Market Revenue (Million), by Product Type 2024 & 2032
- Figure 52: Asia Pacific Glycomics Market Volume (K Unit), by Product Type 2024 & 2032
- Figure 53: Asia Pacific Glycomics Market Revenue Share (%), by Product Type 2024 & 2032
- Figure 54: Asia Pacific Glycomics Market Volume Share (%), by Product Type 2024 & 2032
- Figure 55: Asia Pacific Glycomics Market Revenue (Million), by Application 2024 & 2032
- Figure 56: Asia Pacific Glycomics Market Volume (K Unit), by Application 2024 & 2032
- Figure 57: Asia Pacific Glycomics Market Revenue Share (%), by Application 2024 & 2032
- Figure 58: Asia Pacific Glycomics Market Volume Share (%), by Application 2024 & 2032
- Figure 59: Asia Pacific Glycomics Market Revenue (Million), by Country 2024 & 2032
- Figure 60: Asia Pacific Glycomics Market Volume (K Unit), by Country 2024 & 2032
- Figure 61: Asia Pacific Glycomics Market Revenue Share (%), by Country 2024 & 2032
- Figure 62: Asia Pacific Glycomics Market Volume Share (%), by Country 2024 & 2032
- Figure 63: Rest of the World Glycomics Market Revenue (Million), by Product Type 2024 & 2032
- Figure 64: Rest of the World Glycomics Market Volume (K Unit), by Product Type 2024 & 2032
- Figure 65: Rest of the World Glycomics Market Revenue Share (%), by Product Type 2024 & 2032
- Figure 66: Rest of the World Glycomics Market Volume Share (%), by Product Type 2024 & 2032
- Figure 67: Rest of the World Glycomics Market Revenue (Million), by Application 2024 & 2032
- Figure 68: Rest of the World Glycomics Market Volume (K Unit), by Application 2024 & 2032
- Figure 69: Rest of the World Glycomics Market Revenue Share (%), by Application 2024 & 2032
- Figure 70: Rest of the World Glycomics Market Volume Share (%), by Application 2024 & 2032
- Figure 71: Rest of the World Glycomics Market Revenue (Million), by Country 2024 & 2032
- Figure 72: Rest of the World Glycomics Market Volume (K Unit), by Country 2024 & 2032
- Figure 73: Rest of the World Glycomics Market Revenue Share (%), by Country 2024 & 2032
- Figure 74: Rest of the World Glycomics Market Volume Share (%), by Country 2024 & 2032
List of Tables
- Table 1: Global Glycomics Market Revenue Million Forecast, by Region 2019 & 2032
- Table 2: Global Glycomics Market Volume K Unit Forecast, by Region 2019 & 2032
- Table 3: Global Glycomics Market Revenue Million Forecast, by Product Type 2019 & 2032
- Table 4: Global Glycomics Market Volume K Unit Forecast, by Product Type 2019 & 2032
- Table 5: Global Glycomics Market Revenue Million Forecast, by Application 2019 & 2032
- Table 6: Global Glycomics Market Volume K Unit Forecast, by Application 2019 & 2032
- Table 7: Global Glycomics Market Revenue Million Forecast, by Region 2019 & 2032
- Table 8: Global Glycomics Market Volume K Unit Forecast, by Region 2019 & 2032
- Table 9: Global Glycomics Market Revenue Million Forecast, by Country 2019 & 2032
- Table 10: Global Glycomics Market Volume K Unit Forecast, by Country 2019 & 2032
- Table 11: United States Glycomics Market Revenue (Million) Forecast, by Application 2019 & 2032
- Table 12: United States Glycomics Market Volume (K Unit) Forecast, by Application 2019 & 2032
- Table 13: Canada Glycomics Market Revenue (Million) Forecast, by Application 2019 & 2032
- Table 14: Canada Glycomics Market Volume (K Unit) Forecast, by Application 2019 & 2032
- Table 15: Mexico Glycomics Market Revenue (Million) Forecast, by Application 2019 & 2032
- Table 16: Mexico Glycomics Market Volume (K Unit) Forecast, by Application 2019 & 2032
- Table 17: Global Glycomics Market Revenue Million Forecast, by Country 2019 & 2032
- Table 18: Global Glycomics Market Volume K Unit Forecast, by Country 2019 & 2032
- Table 19: Germany Glycomics Market Revenue (Million) Forecast, by Application 2019 & 2032
- Table 20: Germany Glycomics Market Volume (K Unit) Forecast, by Application 2019 & 2032
- Table 21: United Kingdom Glycomics Market Revenue (Million) Forecast, by Application 2019 & 2032
- Table 22: United Kingdom Glycomics Market Volume (K Unit) Forecast, by Application 2019 & 2032
- Table 23: France Glycomics Market Revenue (Million) Forecast, by Application 2019 & 2032
- Table 24: France Glycomics Market Volume (K Unit) Forecast, by Application 2019 & 2032
- Table 25: Spain Glycomics Market Revenue (Million) Forecast, by Application 2019 & 2032
- Table 26: Spain Glycomics Market Volume (K Unit) Forecast, by Application 2019 & 2032
- Table 27: Italy Glycomics Market Revenue (Million) Forecast, by Application 2019 & 2032
- Table 28: Italy Glycomics Market Volume (K Unit) Forecast, by Application 2019 & 2032
- Table 29: Spain Glycomics Market Revenue (Million) Forecast, by Application 2019 & 2032
- Table 30: Spain Glycomics Market Volume (K Unit) Forecast, by Application 2019 & 2032
- Table 31: Belgium Glycomics Market Revenue (Million) Forecast, by Application 2019 & 2032
- Table 32: Belgium Glycomics Market Volume (K Unit) Forecast, by Application 2019 & 2032
- Table 33: Netherland Glycomics Market Revenue (Million) Forecast, by Application 2019 & 2032
- Table 34: Netherland Glycomics Market Volume (K Unit) Forecast, by Application 2019 & 2032
- Table 35: Nordics Glycomics Market Revenue (Million) Forecast, by Application 2019 & 2032
- Table 36: Nordics Glycomics Market Volume (K Unit) Forecast, by Application 2019 & 2032
- Table 37: Rest of Europe Glycomics Market Revenue (Million) Forecast, by Application 2019 & 2032
- Table 38: Rest of Europe Glycomics Market Volume (K Unit) Forecast, by Application 2019 & 2032
- Table 39: Global Glycomics Market Revenue Million Forecast, by Country 2019 & 2032
- Table 40: Global Glycomics Market Volume K Unit Forecast, by Country 2019 & 2032
- Table 41: China Glycomics Market Revenue (Million) Forecast, by Application 2019 & 2032
- Table 42: China Glycomics Market Volume (K Unit) Forecast, by Application 2019 & 2032
- Table 43: Japan Glycomics Market Revenue (Million) Forecast, by Application 2019 & 2032
- Table 44: Japan Glycomics Market Volume (K Unit) Forecast, by Application 2019 & 2032
- Table 45: India Glycomics Market Revenue (Million) Forecast, by Application 2019 & 2032
- Table 46: India Glycomics Market Volume (K Unit) Forecast, by Application 2019 & 2032
- Table 47: South Korea Glycomics Market Revenue (Million) Forecast, by Application 2019 & 2032
- Table 48: South Korea Glycomics Market Volume (K Unit) Forecast, by Application 2019 & 2032
- Table 49: Southeast Asia Glycomics Market Revenue (Million) Forecast, by Application 2019 & 2032
- Table 50: Southeast Asia Glycomics Market Volume (K Unit) Forecast, by Application 2019 & 2032
- Table 51: Australia Glycomics Market Revenue (Million) Forecast, by Application 2019 & 2032
- Table 52: Australia Glycomics Market Volume (K Unit) Forecast, by Application 2019 & 2032
- Table 53: Indonesia Glycomics Market Revenue (Million) Forecast, by Application 2019 & 2032
- Table 54: Indonesia Glycomics Market Volume (K Unit) Forecast, by Application 2019 & 2032
- Table 55: Phillipes Glycomics Market Revenue (Million) Forecast, by Application 2019 & 2032
- Table 56: Phillipes Glycomics Market Volume (K Unit) Forecast, by Application 2019 & 2032
- Table 57: Singapore Glycomics Market Revenue (Million) Forecast, by Application 2019 & 2032
- Table 58: Singapore Glycomics Market Volume (K Unit) Forecast, by Application 2019 & 2032
- Table 59: Thailandc Glycomics Market Revenue (Million) Forecast, by Application 2019 & 2032
- Table 60: Thailandc Glycomics Market Volume (K Unit) Forecast, by Application 2019 & 2032
- Table 61: Rest of Asia Pacific Glycomics Market Revenue (Million) Forecast, by Application 2019 & 2032
- Table 62: Rest of Asia Pacific Glycomics Market Volume (K Unit) Forecast, by Application 2019 & 2032
- Table 63: Global Glycomics Market Revenue Million Forecast, by Country 2019 & 2032
- Table 64: Global Glycomics Market Volume K Unit Forecast, by Country 2019 & 2032
- Table 65: Brazil Glycomics Market Revenue (Million) Forecast, by Application 2019 & 2032
- Table 66: Brazil Glycomics Market Volume (K Unit) Forecast, by Application 2019 & 2032
- Table 67: Argentina Glycomics Market Revenue (Million) Forecast, by Application 2019 & 2032
- Table 68: Argentina Glycomics Market Volume (K Unit) Forecast, by Application 2019 & 2032
- Table 69: Peru Glycomics Market Revenue (Million) Forecast, by Application 2019 & 2032
- Table 70: Peru Glycomics Market Volume (K Unit) Forecast, by Application 2019 & 2032
- Table 71: Chile Glycomics Market Revenue (Million) Forecast, by Application 2019 & 2032
- Table 72: Chile Glycomics Market Volume (K Unit) Forecast, by Application 2019 & 2032
- Table 73: Colombia Glycomics Market Revenue (Million) Forecast, by Application 2019 & 2032
- Table 74: Colombia Glycomics Market Volume (K Unit) Forecast, by Application 2019 & 2032
- Table 75: Ecuador Glycomics Market Revenue (Million) Forecast, by Application 2019 & 2032
- Table 76: Ecuador Glycomics Market Volume (K Unit) Forecast, by Application 2019 & 2032
- Table 77: Venezuela Glycomics Market Revenue (Million) Forecast, by Application 2019 & 2032
- Table 78: Venezuela Glycomics Market Volume (K Unit) Forecast, by Application 2019 & 2032
- Table 79: Rest of South America Glycomics Market Revenue (Million) Forecast, by Application 2019 & 2032
- Table 80: Rest of South America Glycomics Market Volume (K Unit) Forecast, by Application 2019 & 2032
- Table 81: Global Glycomics Market Revenue Million Forecast, by Country 2019 & 2032
- Table 82: Global Glycomics Market Volume K Unit Forecast, by Country 2019 & 2032
- Table 83: United States Glycomics Market Revenue (Million) Forecast, by Application 2019 & 2032
- Table 84: United States Glycomics Market Volume (K Unit) Forecast, by Application 2019 & 2032
- Table 85: Canada Glycomics Market Revenue (Million) Forecast, by Application 2019 & 2032
- Table 86: Canada Glycomics Market Volume (K Unit) Forecast, by Application 2019 & 2032
- Table 87: Mexico Glycomics Market Revenue (Million) Forecast, by Application 2019 & 2032
- Table 88: Mexico Glycomics Market Volume (K Unit) Forecast, by Application 2019 & 2032
- Table 89: Global Glycomics Market Revenue Million Forecast, by Country 2019 & 2032
- Table 90: Global Glycomics Market Volume K Unit Forecast, by Country 2019 & 2032
- Table 91: United Arab Emirates Glycomics Market Revenue (Million) Forecast, by Application 2019 & 2032
- Table 92: United Arab Emirates Glycomics Market Volume (K Unit) Forecast, by Application 2019 & 2032
- Table 93: Saudi Arabia Glycomics Market Revenue (Million) Forecast, by Application 2019 & 2032
- Table 94: Saudi Arabia Glycomics Market Volume (K Unit) Forecast, by Application 2019 & 2032
- Table 95: South Africa Glycomics Market Revenue (Million) Forecast, by Application 2019 & 2032
- Table 96: South Africa Glycomics Market Volume (K Unit) Forecast, by Application 2019 & 2032
- Table 97: Rest of Middle East and Africa Glycomics Market Revenue (Million) Forecast, by Application 2019 & 2032
- Table 98: Rest of Middle East and Africa Glycomics Market Volume (K Unit) Forecast, by Application 2019 & 2032
- Table 99: Global Glycomics Market Revenue Million Forecast, by Product Type 2019 & 2032
- Table 100: Global Glycomics Market Volume K Unit Forecast, by Product Type 2019 & 2032
- Table 101: Global Glycomics Market Revenue Million Forecast, by Application 2019 & 2032
- Table 102: Global Glycomics Market Volume K Unit Forecast, by Application 2019 & 2032
- Table 103: Global Glycomics Market Revenue Million Forecast, by Country 2019 & 2032
- Table 104: Global Glycomics Market Volume K Unit Forecast, by Country 2019 & 2032
- Table 105: United States Glycomics Market Revenue (Million) Forecast, by Application 2019 & 2032
- Table 106: United States Glycomics Market Volume (K Unit) Forecast, by Application 2019 & 2032
- Table 107: Canada Glycomics Market Revenue (Million) Forecast, by Application 2019 & 2032
- Table 108: Canada Glycomics Market Volume (K Unit) Forecast, by Application 2019 & 2032
- Table 109: Mexico Glycomics Market Revenue (Million) Forecast, by Application 2019 & 2032
- Table 110: Mexico Glycomics Market Volume (K Unit) Forecast, by Application 2019 & 2032
- Table 111: Global Glycomics Market Revenue Million Forecast, by Product Type 2019 & 2032
- Table 112: Global Glycomics Market Volume K Unit Forecast, by Product Type 2019 & 2032
- Table 113: Global Glycomics Market Revenue Million Forecast, by Application 2019 & 2032
- Table 114: Global Glycomics Market Volume K Unit Forecast, by Application 2019 & 2032
- Table 115: Global Glycomics Market Revenue Million Forecast, by Country 2019 & 2032
- Table 116: Global Glycomics Market Volume K Unit Forecast, by Country 2019 & 2032
- Table 117: Germany Glycomics Market Revenue (Million) Forecast, by Application 2019 & 2032
- Table 118: Germany Glycomics Market Volume (K Unit) Forecast, by Application 2019 & 2032
- Table 119: United Kingdom Glycomics Market Revenue (Million) Forecast, by Application 2019 & 2032
- Table 120: United Kingdom Glycomics Market Volume (K Unit) Forecast, by Application 2019 & 2032
- Table 121: France Glycomics Market Revenue (Million) Forecast, by Application 2019 & 2032
- Table 122: France Glycomics Market Volume (K Unit) Forecast, by Application 2019 & 2032
- Table 123: Italy Glycomics Market Revenue (Million) Forecast, by Application 2019 & 2032
- Table 124: Italy Glycomics Market Volume (K Unit) Forecast, by Application 2019 & 2032
- Table 125: Spain Glycomics Market Revenue (Million) Forecast, by Application 2019 & 2032
- Table 126: Spain Glycomics Market Volume (K Unit) Forecast, by Application 2019 & 2032
- Table 127: Rest of Europe Glycomics Market Revenue (Million) Forecast, by Application 2019 & 2032
- Table 128: Rest of Europe Glycomics Market Volume (K Unit) Forecast, by Application 2019 & 2032
- Table 129: Global Glycomics Market Revenue Million Forecast, by Product Type 2019 & 2032
- Table 130: Global Glycomics Market Volume K Unit Forecast, by Product Type 2019 & 2032
- Table 131: Global Glycomics Market Revenue Million Forecast, by Application 2019 & 2032
- Table 132: Global Glycomics Market Volume K Unit Forecast, by Application 2019 & 2032
- Table 133: Global Glycomics Market Revenue Million Forecast, by Country 2019 & 2032
- Table 134: Global Glycomics Market Volume K Unit Forecast, by Country 2019 & 2032
- Table 135: China Glycomics Market Revenue (Million) Forecast, by Application 2019 & 2032
- Table 136: China Glycomics Market Volume (K Unit) Forecast, by Application 2019 & 2032
- Table 137: Japan Glycomics Market Revenue (Million) Forecast, by Application 2019 & 2032
- Table 138: Japan Glycomics Market Volume (K Unit) Forecast, by Application 2019 & 2032
- Table 139: India Glycomics Market Revenue (Million) Forecast, by Application 2019 & 2032
- Table 140: India Glycomics Market Volume (K Unit) Forecast, by Application 2019 & 2032
- Table 141: Australia Glycomics Market Revenue (Million) Forecast, by Application 2019 & 2032
- Table 142: Australia Glycomics Market Volume (K Unit) Forecast, by Application 2019 & 2032
- Table 143: South Korea Glycomics Market Revenue (Million) Forecast, by Application 2019 & 2032
- Table 144: South Korea Glycomics Market Volume (K Unit) Forecast, by Application 2019 & 2032
- Table 145: Rest of Asia Pacific Glycomics Market Revenue (Million) Forecast, by Application 2019 & 2032
- Table 146: Rest of Asia Pacific Glycomics Market Volume (K Unit) Forecast, by Application 2019 & 2032
- Table 147: Global Glycomics Market Revenue Million Forecast, by Product Type 2019 & 2032
- Table 148: Global Glycomics Market Volume K Unit Forecast, by Product Type 2019 & 2032
- Table 149: Global Glycomics Market Revenue Million Forecast, by Application 2019 & 2032
- Table 150: Global Glycomics Market Volume K Unit Forecast, by Application 2019 & 2032
- Table 151: Global Glycomics Market Revenue Million Forecast, by Country 2019 & 2032
- Table 152: Global Glycomics Market Volume K Unit Forecast, by Country 2019 & 2032
Frequently Asked Questions
1. What is the projected Compound Annual Growth Rate (CAGR) of the Glycomics Market?
The projected CAGR is approximately 13.90%.
2. Which companies are prominent players in the Glycomics Market?
Key companies in the market include Merck KGaA, Waters Corporation, Bruker, QA-Bio, Takara Bio Inc, Agilent Technologies Inc, New England Biolabs Inc, Shimadzu Corporation, Danaher (SCIEX), ThermoFisher Scientific Inc.
3. What are the main segments of the Glycomics Market?
The market segments include Product Type, Application.
4. Can you provide details about the market size?
The market size is estimated to be USD XX Million as of 2022.
5. What are some drivers contributing to market growth?
; Increasing Research and Development Activities in Glycomics; Technological Advancements in Products.
6. What are the notable trends driving market growth?
Drug Discovery and Development Segment is Expected to Hold a Major Market Share in the Glycomics Market.
7. Are there any restraints impacting market growth?
; Complexity of Glycomics Coupled With The High Cost Involved in the Process.
8. Can you provide examples of recent developments in the market?
N/A
9. What pricing options are available for accessing the report?
Pricing options include single-user, multi-user, and enterprise licenses priced at USD 4750, USD 5250, and USD 8750 respectively.
10. Is the market size provided in terms of value or volume?
The market size is provided in terms of value, measured in Million and volume, measured in K Unit.
11. Are there any specific market keywords associated with the report?
Yes, the market keyword associated with the report is "Glycomics Market," which aids in identifying and referencing the specific market segment covered.
12. How do I determine which pricing option suits my needs best?
The pricing options vary based on user requirements and access needs. Individual users may opt for single-user licenses, while businesses requiring broader access may choose multi-user or enterprise licenses for cost-effective access to the report.
13. Are there any additional resources or data provided in the Glycomics Market report?
While the report offers comprehensive insights, it's advisable to review the specific contents or supplementary materials provided to ascertain if additional resources or data are available.
14. How can I stay updated on further developments or reports in the Glycomics Market?
To stay informed about further developments, trends, and reports in the Glycomics Market, consider subscribing to industry newsletters, following relevant companies and organizations, or regularly checking reputable industry news sources and publications.
Methodology
Step 1 - Identification of Relevant Samples Size from Population Database


Step 2 - Approaches for Defining Global Market Size (Value, Volume* & Price*)

Note*: In applicable scenarios
Step 3 - Data Sources
Primary Research
- Web Analytics
- Survey Reports
- Research Institute
- Latest Research Reports
- Opinion Leaders
Secondary Research
- Annual Reports
- White Paper
- Latest Press Release
- Industry Association
- Paid Database
- Investor Presentations

Step 4 - Data Triangulation
Involves using different sources of information in order to increase the validity of a study
These sources are likely to be stakeholders in a program - participants, other researchers, program staff, other community members, and so on.
Then we put all data in single framework & apply various statistical tools to find out the dynamic on the market.
During the analysis stage, feedback from the stakeholder groups would be compared to determine areas of agreement as well as areas of divergence


