
Key Insights
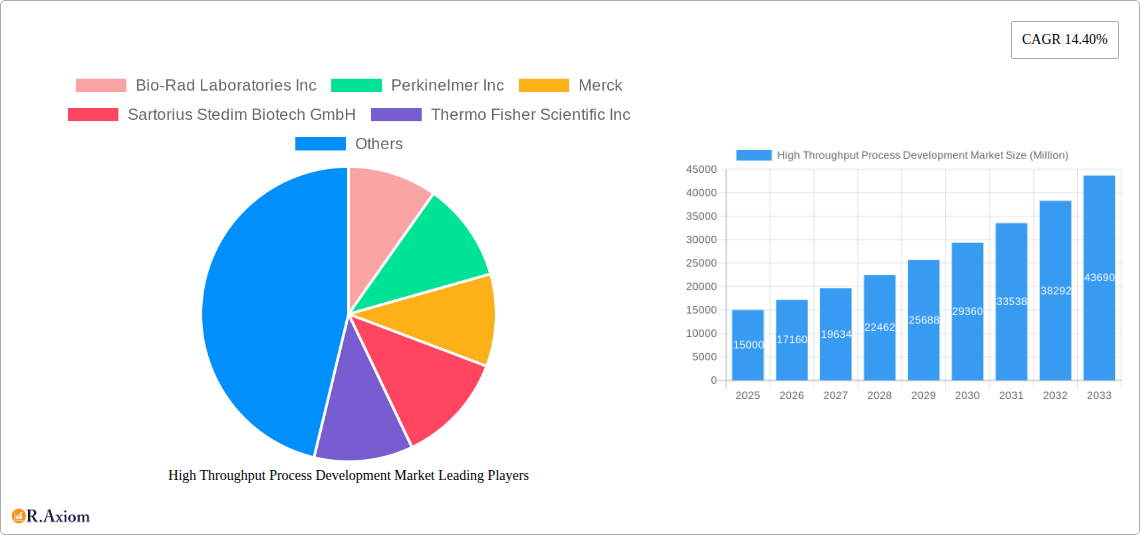
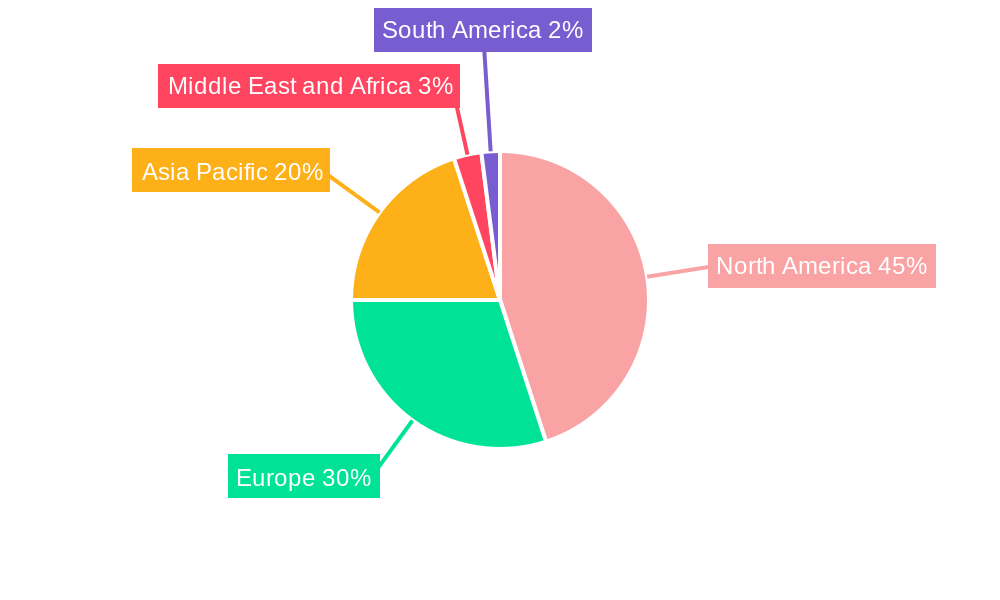
The High Throughput Process Development (HTPD) market is experiencing robust growth, driven by the increasing demand for faster and more efficient drug discovery and development processes within the biopharmaceutical and biotechnology sectors. The market's expansion is fueled by several key factors, including the rising prevalence of chronic diseases necessitating innovative therapies, the growing adoption of automation and advanced technologies like chromatography and UV-Vis spectroscopy for process optimization, and a significant increase in outsourcing to Contract Research Organizations (CROs). The market is segmented by product and services (consumables, instruments, services, software), technology (chromatography, UV-Vis spectroscopy, and other technologies), and end-user (biopharmaceutical companies, CROs, and other end-users). North America currently holds a dominant market share, attributed to the presence of major pharmaceutical companies and advanced research infrastructure, however, the Asia-Pacific region is projected to witness the fastest growth due to burgeoning R&D investments and increasing government support for the biopharmaceutical industry. Companies like Bio-Rad Laboratories, PerkinElmer, Merck, and Thermo Fisher Scientific are key players, continuously innovating and expanding their product portfolios to meet the evolving needs of the HTPD market.
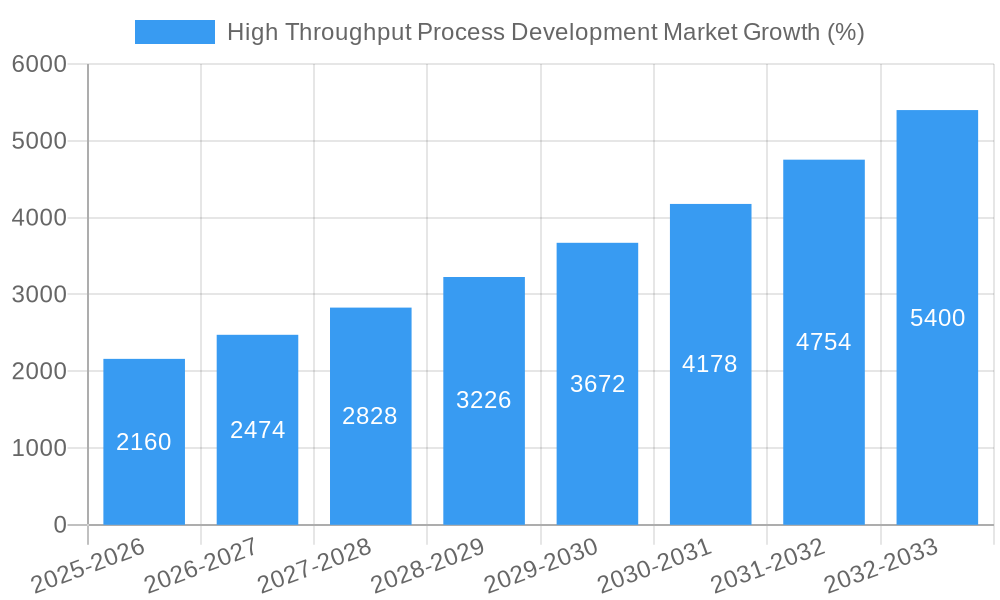
The 14.40% CAGR signifies a substantial and sustained growth trajectory for the HTPD market. This indicates a significant opportunity for both established players and new entrants. However, market restraints include high initial investment costs associated with HTPD technologies, the need for skilled personnel to operate complex equipment, and potential regulatory hurdles for new drug approvals. Despite these challenges, the ongoing advancements in automation, artificial intelligence, and data analytics are expected to further streamline HTPD workflows, leading to enhanced efficiency and reduced development timelines. This, in turn, will propel the market's continued expansion throughout the forecast period (2025-2033). The competitive landscape will likely witness increased mergers, acquisitions, and strategic partnerships to capitalize on this growth.
High Throughput Process Development Market: A Comprehensive Report (2019-2033)
This comprehensive report provides an in-depth analysis of the High Throughput Process Development Market, offering valuable insights for stakeholders across the biopharmaceutical and biotechnology industries. The report covers the period 2019-2033, with 2025 as the base and estimated year, and forecasts extending to 2033. The market is segmented by product and services type, technology, and end-user, revealing key trends and growth opportunities. Major players like Bio-Rad Laboratories Inc, Perkinelmer Inc, Merck, Sartorius Stedim Biotech GmbH, Thermo Fisher Scientific Inc, Tecan Group AG, Eppendorf SE, Danaher Corporation, Agilent Technologies Inc, and General Electric Company (GE Healthcare) are profiled, showcasing their market positions and strategic initiatives.
High Throughput Process Development Market Market Concentration & Innovation
The High Throughput Process Development market exhibits a moderately concentrated landscape, with a handful of multinational corporations holding significant market share. However, the presence of several smaller, specialized companies fosters innovation and competition. The market share of the top five players is estimated to be around xx% in 2025. Innovation is driven primarily by the need for faster, more efficient drug development processes, along with increasing demand for personalized medicine. Regulatory frameworks, such as those from the FDA, influence the adoption of new technologies and processes. Product substitutes are limited, primarily involving traditional, lower-throughput methods, but their market penetration is declining due to efficiency and cost considerations. End-user trends indicate a growing preference for outsourcing process development to Contract Research Organizations (CROs). M&A activity has been significant, with deal values exceeding $xx Million in the last five years, reflecting the consolidation and expansion within the industry. Key M&A activities often involve the acquisition of smaller, specialized companies by larger players to gain access to novel technologies or expand their service portfolios.
High Throughput Process Development Market Industry Trends & Insights
The High Throughput Process Development market is experiencing robust growth, with a projected Compound Annual Growth Rate (CAGR) of xx% during the forecast period (2025-2033). This growth is fueled by several factors, including the increasing demand for new drugs and biologics, advancements in automation and data analytics, and the rising adoption of high-throughput screening (HTS) techniques. Technological disruptions, such as the integration of artificial intelligence (AI) and machine learning (ML) in process optimization, are accelerating market expansion. Consumer preferences are shifting towards faster turnaround times and cost-effective solutions, driving the demand for innovative high-throughput technologies. Competitive dynamics are marked by both intense rivalry among established players and the emergence of innovative startups, leading to continuous improvement in technology and services. Market penetration of high-throughput technologies is expected to reach xx% by 2033.
Dominant Markets & Segments in High Throughput Process Development Market
Leading Region: North America currently dominates the market, driven by robust R&D spending in the biopharmaceutical industry and a strong regulatory environment. Europe follows as a significant market, while the Asia-Pacific region shows promising growth potential due to increasing healthcare expenditure and a rising number of biopharmaceutical companies.
Dominant Segment (By Product and Services Type): Instruments currently hold the largest market share due to the crucial role of automation equipment in high-throughput processes. Consumables represent a steadily growing segment.
Dominant Segment (By Technology): Chromatography is the dominant technology due to its widespread applicability in biomolecule separation and purification.
Dominant Segment (By End-user): Biopharmaceutical and Biotechnology Companies constitute the largest segment, followed by Contract Research Organizations (CROs).
Key Drivers for Dominance:
- North America: Strong R&D funding, established biopharmaceutical industry, and supportive regulatory environment.
- Instruments: Essential for automation, efficiency, and throughput.
- Chromatography: Versatility and established reliability in biomolecule separation and analysis.
- Biopharmaceutical Companies: High demand for efficient process development to accelerate drug discovery and commercialization.
High Throughput Process Development Market Product Developments
Recent product innovations include advancements in automation, miniaturization, and data analytics capabilities. New instruments and software platforms are designed for enhanced throughput, improved data management, and seamless integration with other laboratory systems. These innovations offer significant competitive advantages by accelerating research, reducing costs, and improving the overall efficiency of process development. The integration of AI and ML algorithms in data analysis is a crucial trend, enabling faster optimization of process parameters and increased predictive power.
Report Scope & Segmentation Analysis
The report segments the market by:
By Product and Services Type: Consumables (market size $xx Million in 2025, projected growth xx%), Instruments ($xx Million, xx%), Services ($xx Million, xx%), Software ($xx Million, xx%). Each segment is characterized by specific competitive dynamics and growth trajectories.
By Technology: Chromatography ($xx Million, xx%), Ultraviolet-visible Spectroscopy ($xx Million, xx%), Other Technologies ($xx Million, xx%). Technological advancements and market preferences dictate the varying growth rates within this segmentation.
By End-user: Biopharmaceutical and Biotechnology Companies ($xx Million, xx%), Contract Research Organizations ($xx Million, xx%), Other End-users ($xx Million, xx%). Different end-users have distinct needs and purchasing behaviors, affecting market size and growth.
Key Drivers of High Throughput Process Development Market Growth
Several factors contribute to the market's growth:
- Technological Advancements: Automation, miniaturization, and integration of AI/ML are improving efficiency and throughput.
- Increased R&D Spending: The biopharmaceutical industry's investment in drug discovery and development fuels market demand.
- Stringent Regulatory Requirements: The need for efficient and compliant processes drives the adoption of high-throughput technologies.
Challenges in the High Throughput Process Development Market Sector
The market faces challenges such as:
- High Initial Investment Costs: The purchase and implementation of high-throughput systems can be expensive, limiting access for smaller companies.
- Data Management Complexity: The generation and analysis of large datasets require sophisticated software and expertise.
- Competition: The market is competitive, with established players and innovative newcomers vying for market share.
Emerging Opportunities in High Throughput Process Development Market
Emerging opportunities include:
- Expansion in Emerging Markets: Growing healthcare spending in developing economies presents significant market potential.
- Personalized Medicine: The development of personalized therapies requires high-throughput platforms for efficient drug screening and development.
- Continuous Process Monitoring: Real-time process monitoring solutions leveraging advanced analytics enhance efficiency and optimization.
Leading Players in the High Throughput Process Development Market Market
- Bio-Rad Laboratories Inc
- Perkinelmer Inc
- Merck
- Sartorius Stedim Biotech GmbH
- Thermo Fisher Scientific Inc
- Tecan Group AG
- Eppendorf SE
- Danaher Corporation
- Agilent Technologies Inc
- General Electric Company (GE Healthcare)
Key Developments in High Throughput Process Development Market Industry
October 2022: Ginkgo Bioworks collaborated with Merck, leveraging Ginkgo's expertise in high-throughput screening and process development to optimize biocatalyst production. This collaboration signifies the increasing importance of partnerships in driving innovation.
September 2022: Fujifilm Diosynth Biotechnologies expanded its high-throughput process development facility in Billingham, UK, indicating growing investment in large-scale manufacturing capabilities. This expansion reflects the industry's shift towards efficient and scalable production methods.
Strategic Outlook for High Throughput Process Development Market Market
The High Throughput Process Development market is poised for continued growth, driven by technological advancements and increasing demand for efficient drug discovery and development. Strategic partnerships, acquisitions, and investments in automation and data analytics will be critical for success in this dynamic market. The integration of AI and ML will continue to transform process optimization, leading to faster development cycles and reduced costs. The market presents significant opportunities for companies that can adapt to evolving technological trends and meet the ever-growing demand for faster, more efficient drug development.
High Throughput Process Development Market Segmentation
-
1. Product and Services Type
- 1.1. Consumables
- 1.2. Instruments
- 1.3. Software
-
2. Technology
- 2.1. Chromatography
- 2.2. Ultraviolet-visible Spectroscopy
- 2.3. Other Technologies
-
3. End-user
- 3.1. Biopharmaceutical and Biotechnology Companies
- 3.2. Contract Research Organizations
- 3.3. Other End-users
High Throughput Process Development Market Segmentation By Geography
-
1. North America
- 1.1. United States
- 1.2. Canada
- 1.3. Mexico
-
2. Europe
- 2.1. Germany
- 2.2. United Kingdom
- 2.3. France
- 2.4. Italy
- 2.5. Spain
- 2.6. Rest of Europe
-
3. Asia Pacific
- 3.1. China
- 3.2. Japan
- 3.3. India
- 3.4. Australia
- 3.5. South Korea
- 3.6. Rest of Asia Pacific
-
4. Middle East and Africa
- 4.1. GCC
- 4.2. South Africa
- 4.3. Rest of Middle East and Africa
-
5. South America
- 5.1. Brazil
- 5.2. Argentina
- 5.3. Rest of South America
High Throughput Process Development Market REPORT HIGHLIGHTS
| Aspects | Details |
|---|---|
| Study Period | 2019-2033 |
| Base Year | 2024 |
| Estimated Year | 2025 |
| Forecast Period | 2025-2033 |
| Historical Period | 2019-2024 |
| Growth Rate | CAGR of 14.40% from 2019-2033 |
| Segmentation |
|
Table of Contents
- 1. Introduction
- 1.1. Research Scope
- 1.2. Market Segmentation
- 1.3. Research Methodology
- 1.4. Definitions and Assumptions
- 2. Executive Summary
- 2.1. Introduction
- 3. Market Dynamics
- 3.1. Introduction
- 3.2. Market Drivers
- 3.2.1. Surge in Research and Development Activities for Newer Drug Targets; Growth in Pressure to Lower the Manufacturing Costs in Biopharmaceutical and Biotechnology Companies
- 3.3. Market Restrains
- 3.3.1. High Cost of Advanced Technologies and Lack of Adequate Infrastructure
- 3.4. Market Trends
- 3.4.1. Biopharmaceutical & Biotechnology Companies Segment Expected to Witness Significant Growth
- 4. Market Factor Analysis
- 4.1. Porters Five Forces
- 4.2. Supply/Value Chain
- 4.3. PESTEL analysis
- 4.4. Market Entropy
- 4.5. Patent/Trademark Analysis
- 5. Global High Throughput Process Development Market Analysis, Insights and Forecast, 2019-2031
- 5.1. Market Analysis, Insights and Forecast - by Product and Services Type
- 5.1.1. Consumables
- 5.1.2. Instruments
- 5.1.3. Software
- 5.2. Market Analysis, Insights and Forecast - by Technology
- 5.2.1. Chromatography
- 5.2.2. Ultraviolet-visible Spectroscopy
- 5.2.3. Other Technologies
- 5.3. Market Analysis, Insights and Forecast - by End-user
- 5.3.1. Biopharmaceutical and Biotechnology Companies
- 5.3.2. Contract Research Organizations
- 5.3.3. Other End-users
- 5.4. Market Analysis, Insights and Forecast - by Region
- 5.4.1. North America
- 5.4.2. Europe
- 5.4.3. Asia Pacific
- 5.4.4. Middle East and Africa
- 5.4.5. South America
- 5.1. Market Analysis, Insights and Forecast - by Product and Services Type
- 6. North America High Throughput Process Development Market Analysis, Insights and Forecast, 2019-2031
- 6.1. Market Analysis, Insights and Forecast - by Product and Services Type
- 6.1.1. Consumables
- 6.1.2. Instruments
- 6.1.3. Software
- 6.2. Market Analysis, Insights and Forecast - by Technology
- 6.2.1. Chromatography
- 6.2.2. Ultraviolet-visible Spectroscopy
- 6.2.3. Other Technologies
- 6.3. Market Analysis, Insights and Forecast - by End-user
- 6.3.1. Biopharmaceutical and Biotechnology Companies
- 6.3.2. Contract Research Organizations
- 6.3.3. Other End-users
- 6.1. Market Analysis, Insights and Forecast - by Product and Services Type
- 7. Europe High Throughput Process Development Market Analysis, Insights and Forecast, 2019-2031
- 7.1. Market Analysis, Insights and Forecast - by Product and Services Type
- 7.1.1. Consumables
- 7.1.2. Instruments
- 7.1.3. Software
- 7.2. Market Analysis, Insights and Forecast - by Technology
- 7.2.1. Chromatography
- 7.2.2. Ultraviolet-visible Spectroscopy
- 7.2.3. Other Technologies
- 7.3. Market Analysis, Insights and Forecast - by End-user
- 7.3.1. Biopharmaceutical and Biotechnology Companies
- 7.3.2. Contract Research Organizations
- 7.3.3. Other End-users
- 7.1. Market Analysis, Insights and Forecast - by Product and Services Type
- 8. Asia Pacific High Throughput Process Development Market Analysis, Insights and Forecast, 2019-2031
- 8.1. Market Analysis, Insights and Forecast - by Product and Services Type
- 8.1.1. Consumables
- 8.1.2. Instruments
- 8.1.3. Software
- 8.2. Market Analysis, Insights and Forecast - by Technology
- 8.2.1. Chromatography
- 8.2.2. Ultraviolet-visible Spectroscopy
- 8.2.3. Other Technologies
- 8.3. Market Analysis, Insights and Forecast - by End-user
- 8.3.1. Biopharmaceutical and Biotechnology Companies
- 8.3.2. Contract Research Organizations
- 8.3.3. Other End-users
- 8.1. Market Analysis, Insights and Forecast - by Product and Services Type
- 9. Middle East and Africa High Throughput Process Development Market Analysis, Insights and Forecast, 2019-2031
- 9.1. Market Analysis, Insights and Forecast - by Product and Services Type
- 9.1.1. Consumables
- 9.1.2. Instruments
- 9.1.3. Software
- 9.2. Market Analysis, Insights and Forecast - by Technology
- 9.2.1. Chromatography
- 9.2.2. Ultraviolet-visible Spectroscopy
- 9.2.3. Other Technologies
- 9.3. Market Analysis, Insights and Forecast - by End-user
- 9.3.1. Biopharmaceutical and Biotechnology Companies
- 9.3.2. Contract Research Organizations
- 9.3.3. Other End-users
- 9.1. Market Analysis, Insights and Forecast - by Product and Services Type
- 10. South America High Throughput Process Development Market Analysis, Insights and Forecast, 2019-2031
- 10.1. Market Analysis, Insights and Forecast - by Product and Services Type
- 10.1.1. Consumables
- 10.1.2. Instruments
- 10.1.3. Software
- 10.2. Market Analysis, Insights and Forecast - by Technology
- 10.2.1. Chromatography
- 10.2.2. Ultraviolet-visible Spectroscopy
- 10.2.3. Other Technologies
- 10.3. Market Analysis, Insights and Forecast - by End-user
- 10.3.1. Biopharmaceutical and Biotechnology Companies
- 10.3.2. Contract Research Organizations
- 10.3.3. Other End-users
- 10.1. Market Analysis, Insights and Forecast - by Product and Services Type
- 11. North America High Throughput Process Development Market Analysis, Insights and Forecast, 2019-2031
- 11.1. Market Analysis, Insights and Forecast - By Country/Sub-region
- 11.1.1 United States
- 11.1.2 Canada
- 11.1.3 Mexico
- 12. Europe High Throughput Process Development Market Analysis, Insights and Forecast, 2019-2031
- 12.1. Market Analysis, Insights and Forecast - By Country/Sub-region
- 12.1.1 Germany
- 12.1.2 United Kingdom
- 12.1.3 France
- 12.1.4 Italy
- 12.1.5 Spain
- 12.1.6 Rest of Europe
- 13. Asia Pacific High Throughput Process Development Market Analysis, Insights and Forecast, 2019-2031
- 13.1. Market Analysis, Insights and Forecast - By Country/Sub-region
- 13.1.1 China
- 13.1.2 Japan
- 13.1.3 India
- 13.1.4 Australia
- 13.1.5 South Korea
- 13.1.6 Rest of Asia Pacific
- 14. Middle East and Africa High Throughput Process Development Market Analysis, Insights and Forecast, 2019-2031
- 14.1. Market Analysis, Insights and Forecast - By Country/Sub-region
- 14.1.1 GCC
- 14.1.2 South Africa
- 14.1.3 Rest of Middle East and Africa
- 15. South America High Throughput Process Development Market Analysis, Insights and Forecast, 2019-2031
- 15.1. Market Analysis, Insights and Forecast - By Country/Sub-region
- 15.1.1 Brazil
- 15.1.2 Argentina
- 15.1.3 Rest of South America
- 16. Competitive Analysis
- 16.1. Global Market Share Analysis 2024
- 16.2. Company Profiles
- 16.2.1 Bio-Rad Laboratories Inc
- 16.2.1.1. Overview
- 16.2.1.2. Products
- 16.2.1.3. SWOT Analysis
- 16.2.1.4. Recent Developments
- 16.2.1.5. Financials (Based on Availability)
- 16.2.2 Perkinelmer Inc
- 16.2.2.1. Overview
- 16.2.2.2. Products
- 16.2.2.3. SWOT Analysis
- 16.2.2.4. Recent Developments
- 16.2.2.5. Financials (Based on Availability)
- 16.2.3 Merck
- 16.2.3.1. Overview
- 16.2.3.2. Products
- 16.2.3.3. SWOT Analysis
- 16.2.3.4. Recent Developments
- 16.2.3.5. Financials (Based on Availability)
- 16.2.4 Sartorius Stedim Biotech GmbH
- 16.2.4.1. Overview
- 16.2.4.2. Products
- 16.2.4.3. SWOT Analysis
- 16.2.4.4. Recent Developments
- 16.2.4.5. Financials (Based on Availability)
- 16.2.5 Thermo Fisher Scientific Inc
- 16.2.5.1. Overview
- 16.2.5.2. Products
- 16.2.5.3. SWOT Analysis
- 16.2.5.4. Recent Developments
- 16.2.5.5. Financials (Based on Availability)
- 16.2.6 Tecan Group AG*List Not Exhaustive
- 16.2.6.1. Overview
- 16.2.6.2. Products
- 16.2.6.3. SWOT Analysis
- 16.2.6.4. Recent Developments
- 16.2.6.5. Financials (Based on Availability)
- 16.2.7 Eppendorf SE
- 16.2.7.1. Overview
- 16.2.7.2. Products
- 16.2.7.3. SWOT Analysis
- 16.2.7.4. Recent Developments
- 16.2.7.5. Financials (Based on Availability)
- 16.2.8 Danaher Corporation
- 16.2.8.1. Overview
- 16.2.8.2. Products
- 16.2.8.3. SWOT Analysis
- 16.2.8.4. Recent Developments
- 16.2.8.5. Financials (Based on Availability)
- 16.2.9 Agilent Technologies Inc
- 16.2.9.1. Overview
- 16.2.9.2. Products
- 16.2.9.3. SWOT Analysis
- 16.2.9.4. Recent Developments
- 16.2.9.5. Financials (Based on Availability)
- 16.2.10 General Electric Company (GE Healthcare)
- 16.2.10.1. Overview
- 16.2.10.2. Products
- 16.2.10.3. SWOT Analysis
- 16.2.10.4. Recent Developments
- 16.2.10.5. Financials (Based on Availability)
- 16.2.1 Bio-Rad Laboratories Inc
List of Figures
- Figure 1: Global High Throughput Process Development Market Revenue Breakdown (Million, %) by Region 2024 & 2032
- Figure 2: North America High Throughput Process Development Market Revenue (Million), by Country 2024 & 2032
- Figure 3: North America High Throughput Process Development Market Revenue Share (%), by Country 2024 & 2032
- Figure 4: Europe High Throughput Process Development Market Revenue (Million), by Country 2024 & 2032
- Figure 5: Europe High Throughput Process Development Market Revenue Share (%), by Country 2024 & 2032
- Figure 6: Asia Pacific High Throughput Process Development Market Revenue (Million), by Country 2024 & 2032
- Figure 7: Asia Pacific High Throughput Process Development Market Revenue Share (%), by Country 2024 & 2032
- Figure 8: Middle East and Africa High Throughput Process Development Market Revenue (Million), by Country 2024 & 2032
- Figure 9: Middle East and Africa High Throughput Process Development Market Revenue Share (%), by Country 2024 & 2032
- Figure 10: South America High Throughput Process Development Market Revenue (Million), by Country 2024 & 2032
- Figure 11: South America High Throughput Process Development Market Revenue Share (%), by Country 2024 & 2032
- Figure 12: North America High Throughput Process Development Market Revenue (Million), by Product and Services Type 2024 & 2032
- Figure 13: North America High Throughput Process Development Market Revenue Share (%), by Product and Services Type 2024 & 2032
- Figure 14: North America High Throughput Process Development Market Revenue (Million), by Technology 2024 & 2032
- Figure 15: North America High Throughput Process Development Market Revenue Share (%), by Technology 2024 & 2032
- Figure 16: North America High Throughput Process Development Market Revenue (Million), by End-user 2024 & 2032
- Figure 17: North America High Throughput Process Development Market Revenue Share (%), by End-user 2024 & 2032
- Figure 18: North America High Throughput Process Development Market Revenue (Million), by Country 2024 & 2032
- Figure 19: North America High Throughput Process Development Market Revenue Share (%), by Country 2024 & 2032
- Figure 20: Europe High Throughput Process Development Market Revenue (Million), by Product and Services Type 2024 & 2032
- Figure 21: Europe High Throughput Process Development Market Revenue Share (%), by Product and Services Type 2024 & 2032
- Figure 22: Europe High Throughput Process Development Market Revenue (Million), by Technology 2024 & 2032
- Figure 23: Europe High Throughput Process Development Market Revenue Share (%), by Technology 2024 & 2032
- Figure 24: Europe High Throughput Process Development Market Revenue (Million), by End-user 2024 & 2032
- Figure 25: Europe High Throughput Process Development Market Revenue Share (%), by End-user 2024 & 2032
- Figure 26: Europe High Throughput Process Development Market Revenue (Million), by Country 2024 & 2032
- Figure 27: Europe High Throughput Process Development Market Revenue Share (%), by Country 2024 & 2032
- Figure 28: Asia Pacific High Throughput Process Development Market Revenue (Million), by Product and Services Type 2024 & 2032
- Figure 29: Asia Pacific High Throughput Process Development Market Revenue Share (%), by Product and Services Type 2024 & 2032
- Figure 30: Asia Pacific High Throughput Process Development Market Revenue (Million), by Technology 2024 & 2032
- Figure 31: Asia Pacific High Throughput Process Development Market Revenue Share (%), by Technology 2024 & 2032
- Figure 32: Asia Pacific High Throughput Process Development Market Revenue (Million), by End-user 2024 & 2032
- Figure 33: Asia Pacific High Throughput Process Development Market Revenue Share (%), by End-user 2024 & 2032
- Figure 34: Asia Pacific High Throughput Process Development Market Revenue (Million), by Country 2024 & 2032
- Figure 35: Asia Pacific High Throughput Process Development Market Revenue Share (%), by Country 2024 & 2032
- Figure 36: Middle East and Africa High Throughput Process Development Market Revenue (Million), by Product and Services Type 2024 & 2032
- Figure 37: Middle East and Africa High Throughput Process Development Market Revenue Share (%), by Product and Services Type 2024 & 2032
- Figure 38: Middle East and Africa High Throughput Process Development Market Revenue (Million), by Technology 2024 & 2032
- Figure 39: Middle East and Africa High Throughput Process Development Market Revenue Share (%), by Technology 2024 & 2032
- Figure 40: Middle East and Africa High Throughput Process Development Market Revenue (Million), by End-user 2024 & 2032
- Figure 41: Middle East and Africa High Throughput Process Development Market Revenue Share (%), by End-user 2024 & 2032
- Figure 42: Middle East and Africa High Throughput Process Development Market Revenue (Million), by Country 2024 & 2032
- Figure 43: Middle East and Africa High Throughput Process Development Market Revenue Share (%), by Country 2024 & 2032
- Figure 44: South America High Throughput Process Development Market Revenue (Million), by Product and Services Type 2024 & 2032
- Figure 45: South America High Throughput Process Development Market Revenue Share (%), by Product and Services Type 2024 & 2032
- Figure 46: South America High Throughput Process Development Market Revenue (Million), by Technology 2024 & 2032
- Figure 47: South America High Throughput Process Development Market Revenue Share (%), by Technology 2024 & 2032
- Figure 48: South America High Throughput Process Development Market Revenue (Million), by End-user 2024 & 2032
- Figure 49: South America High Throughput Process Development Market Revenue Share (%), by End-user 2024 & 2032
- Figure 50: South America High Throughput Process Development Market Revenue (Million), by Country 2024 & 2032
- Figure 51: South America High Throughput Process Development Market Revenue Share (%), by Country 2024 & 2032
List of Tables
- Table 1: Global High Throughput Process Development Market Revenue Million Forecast, by Region 2019 & 2032
- Table 2: Global High Throughput Process Development Market Revenue Million Forecast, by Product and Services Type 2019 & 2032
- Table 3: Global High Throughput Process Development Market Revenue Million Forecast, by Technology 2019 & 2032
- Table 4: Global High Throughput Process Development Market Revenue Million Forecast, by End-user 2019 & 2032
- Table 5: Global High Throughput Process Development Market Revenue Million Forecast, by Region 2019 & 2032
- Table 6: Global High Throughput Process Development Market Revenue Million Forecast, by Country 2019 & 2032
- Table 7: United States High Throughput Process Development Market Revenue (Million) Forecast, by Application 2019 & 2032
- Table 8: Canada High Throughput Process Development Market Revenue (Million) Forecast, by Application 2019 & 2032
- Table 9: Mexico High Throughput Process Development Market Revenue (Million) Forecast, by Application 2019 & 2032
- Table 10: Global High Throughput Process Development Market Revenue Million Forecast, by Country 2019 & 2032
- Table 11: Germany High Throughput Process Development Market Revenue (Million) Forecast, by Application 2019 & 2032
- Table 12: United Kingdom High Throughput Process Development Market Revenue (Million) Forecast, by Application 2019 & 2032
- Table 13: France High Throughput Process Development Market Revenue (Million) Forecast, by Application 2019 & 2032
- Table 14: Italy High Throughput Process Development Market Revenue (Million) Forecast, by Application 2019 & 2032
- Table 15: Spain High Throughput Process Development Market Revenue (Million) Forecast, by Application 2019 & 2032
- Table 16: Rest of Europe High Throughput Process Development Market Revenue (Million) Forecast, by Application 2019 & 2032
- Table 17: Global High Throughput Process Development Market Revenue Million Forecast, by Country 2019 & 2032
- Table 18: China High Throughput Process Development Market Revenue (Million) Forecast, by Application 2019 & 2032
- Table 19: Japan High Throughput Process Development Market Revenue (Million) Forecast, by Application 2019 & 2032
- Table 20: India High Throughput Process Development Market Revenue (Million) Forecast, by Application 2019 & 2032
- Table 21: Australia High Throughput Process Development Market Revenue (Million) Forecast, by Application 2019 & 2032
- Table 22: South Korea High Throughput Process Development Market Revenue (Million) Forecast, by Application 2019 & 2032
- Table 23: Rest of Asia Pacific High Throughput Process Development Market Revenue (Million) Forecast, by Application 2019 & 2032
- Table 24: Global High Throughput Process Development Market Revenue Million Forecast, by Country 2019 & 2032
- Table 25: GCC High Throughput Process Development Market Revenue (Million) Forecast, by Application 2019 & 2032
- Table 26: South Africa High Throughput Process Development Market Revenue (Million) Forecast, by Application 2019 & 2032
- Table 27: Rest of Middle East and Africa High Throughput Process Development Market Revenue (Million) Forecast, by Application 2019 & 2032
- Table 28: Global High Throughput Process Development Market Revenue Million Forecast, by Country 2019 & 2032
- Table 29: Brazil High Throughput Process Development Market Revenue (Million) Forecast, by Application 2019 & 2032
- Table 30: Argentina High Throughput Process Development Market Revenue (Million) Forecast, by Application 2019 & 2032
- Table 31: Rest of South America High Throughput Process Development Market Revenue (Million) Forecast, by Application 2019 & 2032
- Table 32: Global High Throughput Process Development Market Revenue Million Forecast, by Product and Services Type 2019 & 2032
- Table 33: Global High Throughput Process Development Market Revenue Million Forecast, by Technology 2019 & 2032
- Table 34: Global High Throughput Process Development Market Revenue Million Forecast, by End-user 2019 & 2032
- Table 35: Global High Throughput Process Development Market Revenue Million Forecast, by Country 2019 & 2032
- Table 36: United States High Throughput Process Development Market Revenue (Million) Forecast, by Application 2019 & 2032
- Table 37: Canada High Throughput Process Development Market Revenue (Million) Forecast, by Application 2019 & 2032
- Table 38: Mexico High Throughput Process Development Market Revenue (Million) Forecast, by Application 2019 & 2032
- Table 39: Global High Throughput Process Development Market Revenue Million Forecast, by Product and Services Type 2019 & 2032
- Table 40: Global High Throughput Process Development Market Revenue Million Forecast, by Technology 2019 & 2032
- Table 41: Global High Throughput Process Development Market Revenue Million Forecast, by End-user 2019 & 2032
- Table 42: Global High Throughput Process Development Market Revenue Million Forecast, by Country 2019 & 2032
- Table 43: Germany High Throughput Process Development Market Revenue (Million) Forecast, by Application 2019 & 2032
- Table 44: United Kingdom High Throughput Process Development Market Revenue (Million) Forecast, by Application 2019 & 2032
- Table 45: France High Throughput Process Development Market Revenue (Million) Forecast, by Application 2019 & 2032
- Table 46: Italy High Throughput Process Development Market Revenue (Million) Forecast, by Application 2019 & 2032
- Table 47: Spain High Throughput Process Development Market Revenue (Million) Forecast, by Application 2019 & 2032
- Table 48: Rest of Europe High Throughput Process Development Market Revenue (Million) Forecast, by Application 2019 & 2032
- Table 49: Global High Throughput Process Development Market Revenue Million Forecast, by Product and Services Type 2019 & 2032
- Table 50: Global High Throughput Process Development Market Revenue Million Forecast, by Technology 2019 & 2032
- Table 51: Global High Throughput Process Development Market Revenue Million Forecast, by End-user 2019 & 2032
- Table 52: Global High Throughput Process Development Market Revenue Million Forecast, by Country 2019 & 2032
- Table 53: China High Throughput Process Development Market Revenue (Million) Forecast, by Application 2019 & 2032
- Table 54: Japan High Throughput Process Development Market Revenue (Million) Forecast, by Application 2019 & 2032
- Table 55: India High Throughput Process Development Market Revenue (Million) Forecast, by Application 2019 & 2032
- Table 56: Australia High Throughput Process Development Market Revenue (Million) Forecast, by Application 2019 & 2032
- Table 57: South Korea High Throughput Process Development Market Revenue (Million) Forecast, by Application 2019 & 2032
- Table 58: Rest of Asia Pacific High Throughput Process Development Market Revenue (Million) Forecast, by Application 2019 & 2032
- Table 59: Global High Throughput Process Development Market Revenue Million Forecast, by Product and Services Type 2019 & 2032
- Table 60: Global High Throughput Process Development Market Revenue Million Forecast, by Technology 2019 & 2032
- Table 61: Global High Throughput Process Development Market Revenue Million Forecast, by End-user 2019 & 2032
- Table 62: Global High Throughput Process Development Market Revenue Million Forecast, by Country 2019 & 2032
- Table 63: GCC High Throughput Process Development Market Revenue (Million) Forecast, by Application 2019 & 2032
- Table 64: South Africa High Throughput Process Development Market Revenue (Million) Forecast, by Application 2019 & 2032
- Table 65: Rest of Middle East and Africa High Throughput Process Development Market Revenue (Million) Forecast, by Application 2019 & 2032
- Table 66: Global High Throughput Process Development Market Revenue Million Forecast, by Product and Services Type 2019 & 2032
- Table 67: Global High Throughput Process Development Market Revenue Million Forecast, by Technology 2019 & 2032
- Table 68: Global High Throughput Process Development Market Revenue Million Forecast, by End-user 2019 & 2032
- Table 69: Global High Throughput Process Development Market Revenue Million Forecast, by Country 2019 & 2032
- Table 70: Brazil High Throughput Process Development Market Revenue (Million) Forecast, by Application 2019 & 2032
- Table 71: Argentina High Throughput Process Development Market Revenue (Million) Forecast, by Application 2019 & 2032
- Table 72: Rest of South America High Throughput Process Development Market Revenue (Million) Forecast, by Application 2019 & 2032
Frequently Asked Questions
1. What is the projected Compound Annual Growth Rate (CAGR) of the High Throughput Process Development Market?
The projected CAGR is approximately 14.40%.
2. Which companies are prominent players in the High Throughput Process Development Market?
Key companies in the market include Bio-Rad Laboratories Inc, Perkinelmer Inc, Merck, Sartorius Stedim Biotech GmbH, Thermo Fisher Scientific Inc, Tecan Group AG*List Not Exhaustive, Eppendorf SE, Danaher Corporation, Agilent Technologies Inc, General Electric Company (GE Healthcare).
3. What are the main segments of the High Throughput Process Development Market?
The market segments include Product and Services Type, Technology, End-user.
4. Can you provide details about the market size?
The market size is estimated to be USD XX Million as of 2022.
5. What are some drivers contributing to market growth?
Surge in Research and Development Activities for Newer Drug Targets; Growth in Pressure to Lower the Manufacturing Costs in Biopharmaceutical and Biotechnology Companies.
6. What are the notable trends driving market growth?
Biopharmaceutical & Biotechnology Companies Segment Expected to Witness Significant Growth.
7. Are there any restraints impacting market growth?
High Cost of Advanced Technologies and Lack of Adequate Infrastructure.
8. Can you provide examples of recent developments in the market?
October 2022: Ginkgo Bioworks collaborated with Merck. This collaboration leveraged Ginkgo's extensive experience in cell engineering and enzyme design and its capabilities in automated high-throughput screening, manufacturing process development/optimization, bioinformatics, and analytics to deliver optimal strains for the expression of targeted biocatalysts.
9. What pricing options are available for accessing the report?
Pricing options include single-user, multi-user, and enterprise licenses priced at USD 4750, USD 5250, and USD 8750 respectively.
10. Is the market size provided in terms of value or volume?
The market size is provided in terms of value, measured in Million.
11. Are there any specific market keywords associated with the report?
Yes, the market keyword associated with the report is "High Throughput Process Development Market," which aids in identifying and referencing the specific market segment covered.
12. How do I determine which pricing option suits my needs best?
The pricing options vary based on user requirements and access needs. Individual users may opt for single-user licenses, while businesses requiring broader access may choose multi-user or enterprise licenses for cost-effective access to the report.
13. Are there any additional resources or data provided in the High Throughput Process Development Market report?
While the report offers comprehensive insights, it's advisable to review the specific contents or supplementary materials provided to ascertain if additional resources or data are available.
14. How can I stay updated on further developments or reports in the High Throughput Process Development Market?
To stay informed about further developments, trends, and reports in the High Throughput Process Development Market, consider subscribing to industry newsletters, following relevant companies and organizations, or regularly checking reputable industry news sources and publications.
Methodology
Step 1 - Identification of Relevant Samples Size from Population Database


Step 2 - Approaches for Defining Global Market Size (Value, Volume* & Price*)

Note*: In applicable scenarios
Step 3 - Data Sources
Primary Research
- Web Analytics
- Survey Reports
- Research Institute
- Latest Research Reports
- Opinion Leaders
Secondary Research
- Annual Reports
- White Paper
- Latest Press Release
- Industry Association
- Paid Database
- Investor Presentations

Step 4 - Data Triangulation
Involves using different sources of information in order to increase the validity of a study
These sources are likely to be stakeholders in a program - participants, other researchers, program staff, other community members, and so on.
Then we put all data in single framework & apply various statistical tools to find out the dynamic on the market.
During the analysis stage, feedback from the stakeholder groups would be compared to determine areas of agreement as well as areas of divergence


