
Key Insights
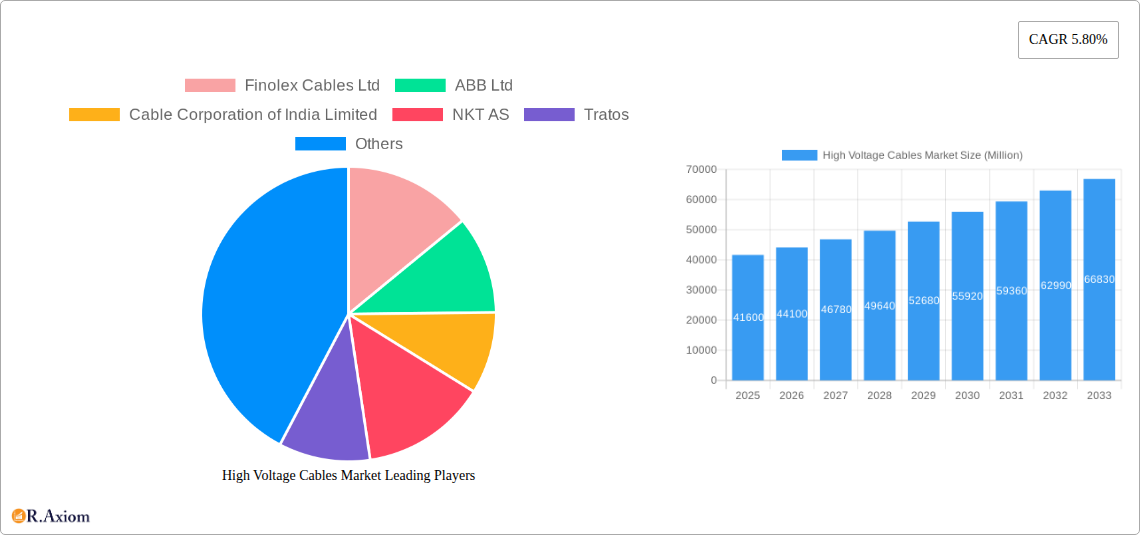
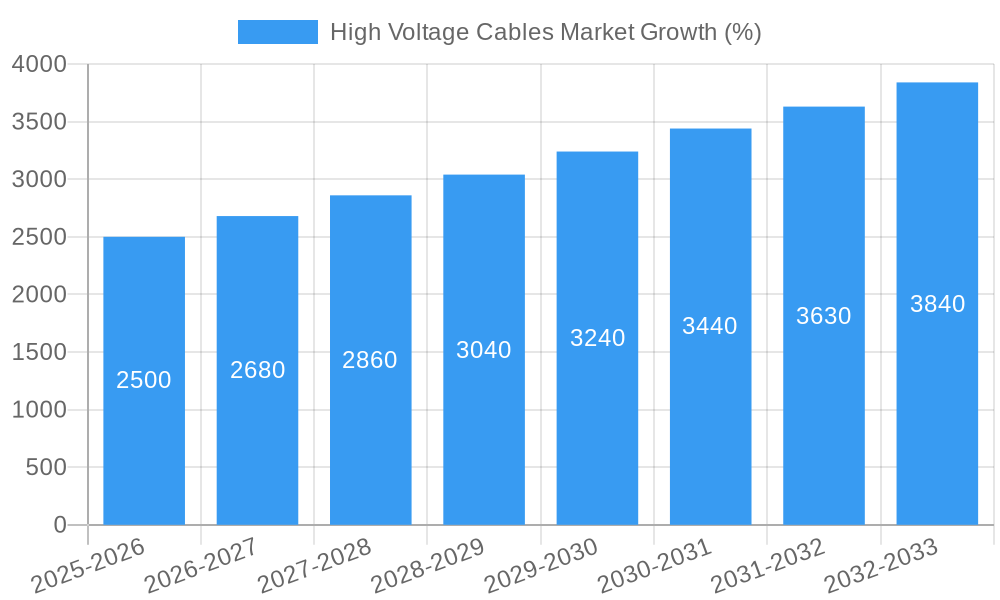
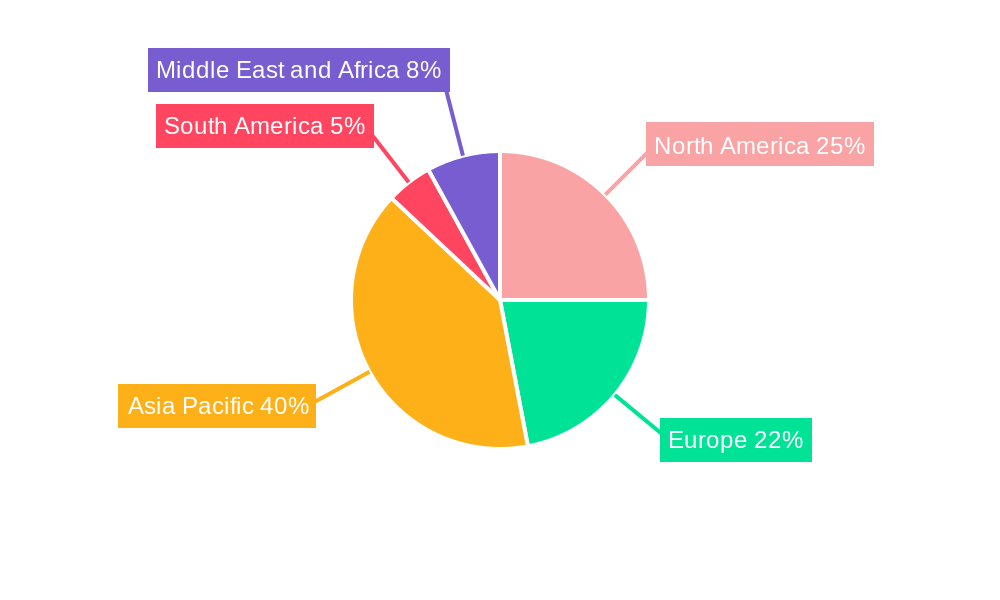
The high-voltage cables market, valued at $41.60 billion in 2025, is projected to experience robust growth, driven by the increasing global demand for electricity and the expansion of renewable energy infrastructure. The market's Compound Annual Growth Rate (CAGR) of 5.80% from 2025 to 2033 indicates a significant expansion over the forecast period. Key drivers include the burgeoning need for efficient power transmission across long distances, supporting the growth of smart grids and renewable energy sources like solar and wind power. The rising adoption of HVDC (High Voltage Direct Current) technology for long-distance power transmission is further fueling market expansion. Technological advancements leading to improved cable materials and designs, enhancing efficiency and durability, contribute to market growth. However, high installation costs and the potential environmental impact of cable manufacturing and disposal pose challenges to market growth. Segmentation reveals a diverse landscape, with underground cables holding a significant share due to their protection from weather and vandalism compared to overhead cables. The HVDC transmission type is witnessing significant growth due to its advantages in long-distance power transmission. The greater than 330KV voltage level segment is expected to dominate due to its application in large-scale power transmission projects. Geographically, Asia Pacific is projected to be the largest regional market, driven by rapid infrastructure development and increasing energy consumption in countries like China and India. North America and Europe also hold significant market shares, fueled by grid modernization efforts and renewable energy integration initiatives. Major market players like ABB Ltd, Prysmian SpA, and Nexans SA are driving innovation and expanding their global presence to cater to the growing demand.
The competitive landscape is characterized by both established players and emerging companies, leading to intense competition focused on innovation, cost optimization, and geographical expansion. Future market growth will largely depend on government policies supporting grid modernization, advancements in cable technology, and the continued growth of renewable energy sources. Sustainable cable materials and recycling initiatives will also become increasingly important in shaping the market's future trajectory. The market's overall positive outlook is reinforced by the increasing interconnectedness of global power grids and the urgent need to enhance electricity transmission capabilities worldwide to meet the rising demand for reliable and efficient energy supply. Strategic partnerships and mergers and acquisitions are likely to further reshape the market's competitive landscape in the coming years.
High Voltage Cables Market: A Comprehensive Report (2019-2033)
This detailed report provides a comprehensive analysis of the High Voltage Cables Market, covering market size, segmentation, growth drivers, challenges, and key players. The study period spans from 2019 to 2033, with 2025 serving as the base and estimated year. The forecast period is 2025-2033, and the historical period covers 2019-2024. The report offers actionable insights for industry stakeholders, investors, and businesses operating within this dynamic sector.
High Voltage Cables Market Market Concentration & Innovation
This section analyzes the competitive landscape of the high voltage cables market, examining market concentration, innovation drivers, regulatory frameworks, product substitutes, end-user trends, and mergers & acquisitions (M&A) activities. The market is characterized by a moderately concentrated structure with a few major players holding significant market share. Prysmian SpA and Nexans SA, for example, command a significant portion of the global market, estimated at xx% and xx% respectively in 2025. However, regional players and specialized manufacturers also contribute considerably.
Innovation is driven primarily by the need for increased transmission capacity, improved efficiency, enhanced reliability, and the integration of renewable energy sources. Stringent regulatory frameworks, particularly concerning safety and environmental standards, are shaping product development and deployment strategies. The market experiences ongoing innovation in materials science, design, and manufacturing processes. For instance, the development of advanced polymer materials for improved insulation and conductivity is a key innovation driver.
Product substitution is a less significant factor due to the specialized nature of high voltage cables. However, competition from alternative transmission technologies such as superconducting cables exists in niche segments. End-user trends reveal a growing preference for environmentally friendly materials and sustainable manufacturing practices.
M&A activity in the high voltage cable industry has been moderate in recent years, with deal values fluctuating between xx Million and xx Million USD annually. These transactions often involve strategic acquisitions to expand geographic reach, enhance product portfolios, or access new technologies.
- Market Share (2025 Estimates): Prysmian SpA: xx%, Nexans SA: xx%, ABB Ltd: xx%, Others: xx%
- Average M&A Deal Value (2019-2024): xx Million USD
High Voltage Cables Market Industry Trends & Insights
The high voltage cables market is experiencing robust growth, driven by the increasing demand for electricity globally, particularly in developing economies. The Compound Annual Growth Rate (CAGR) during the forecast period (2025-2033) is projected at xx%, fueled by investments in renewable energy infrastructure and upgrades to existing grids. The market penetration of HVDC technology is also increasing as it offers advantages in long-distance power transmission and integration of offshore wind farms. Technological disruptions such as the development of high-temperature superconducting cables are anticipated to reshape the market in the long term, although widespread adoption remains a few years away.
Consumer preferences for enhanced reliability, safety, and sustainability are influencing product development and material choices. Competitive dynamics are shaped by the presence of both large multinational corporations and specialized regional players, leading to price competition and innovation-driven differentiation. The market shows significant growth in regions experiencing rapid industrialization and urbanization, alongside governmental investment in upgrading aging infrastructure.
Dominant Markets & Segments in High Voltage Cables Market
The Asia-Pacific region is currently the dominant market for high-voltage cables, driven by robust economic growth, extensive infrastructure development, and increasing electricity demand. China and India are particularly important markets.
- Leading Segments (by Deployment Location):
- Underground Cables: This segment holds the largest market share due to increased urbanization and the need for reliable power delivery in densely populated areas.
- Overhead Cables: Significant growth is expected in overhead cable installations in rural and less densely populated areas to extend power networks.
- Submarine Cables: The offshore wind energy boom is a key growth driver for submarine high-voltage cables.
- Leading Segments (by Type of Transmission):
- HVAC: HVAC cables currently hold the largest market share, though HVDC is gaining momentum.
- HVDC: HVDC transmission is increasingly preferred for long-distance transmission and integration of renewable energy.
- Leading Segments (by Voltage Level):
- 115KV - 330KV: This voltage level caters to the majority of grid applications.
- Greater than 330KV: Growth in this segment is fueled by the demand for ultra-high-voltage transmission lines for long-distance power transfer.
Key drivers include government initiatives to expand power grids, rising investments in renewable energy projects, and increasing demand from various industrial sectors. These factors have created significant opportunities for expansion and investment within the high-voltage cables market.
High Voltage Cables Market Product Developments
Recent product innovations focus on improving the efficiency, reliability, and lifespan of high-voltage cables. This includes the development of new insulating materials with enhanced dielectric strength, improved conductor designs for reduced losses, and advanced cable monitoring systems. These innovations directly address industry needs for safe, reliable, and cost-effective power transmission, thereby enhancing their market fit.
Report Scope & Segmentation Analysis
This report segments the high-voltage cables market by location of deployment (overhead, underground, submarine), type of transmission (HVDC, HVAC), and voltage level (50KV-110KV, 115KV-330KV, >330KV). Each segment's growth projections, market size, and competitive dynamics are analyzed. For example, the underground cable segment is expected to witness significant growth driven by urbanization and increased demand for reliable power supply in metropolitan areas, while the HVDC segment's expansion is driven by long-distance transmission needs and renewable energy integration. Detailed projections are provided for each segment throughout the forecast period (2025-2033).
Key Drivers of High Voltage Cables Market Growth
Growth in the high-voltage cables market is propelled by factors such as expanding electricity grids, particularly in developing economies; the burgeoning renewable energy sector (solar, wind) demanding efficient power transmission; investments in smart grids and grid modernization; and stringent government regulations mandating reliable and efficient power delivery. The rising demand for electric vehicles and industrial automation further contributes to the growth trajectory.
Challenges in the High Voltage Cables Market Sector
The high-voltage cables market faces challenges including fluctuating raw material prices, impacting production costs; supply chain disruptions affecting timely project execution; and intense competition from established players and new entrants. Further complexities arise from stringent safety and environmental regulations, along with the need for skilled labor for installation and maintenance. These factors can significantly influence market dynamics.
Emerging Opportunities in High Voltage Cables Market
Emerging opportunities lie in the adoption of advanced materials like superconductors and the increasing demand for HVDC cables for long-distance transmission and renewable energy integration. Furthermore, opportunities exist in developing smart cable technologies for improved monitoring and maintenance. Growing demand in emerging markets and the shift towards sustainable energy present significant potential.
Leading Players in the High Voltage Cables Market Market
- Finolex Cables Ltd
- ABB Ltd
- Cable Corporation of India Limited
- NKT AS
- Tratos
- Prysmian SpA
- Siemens AG
- Nexans SA
- Southwire Company LLC
Key Developments in High Voltage Cables Market Industry
- July 2022: Hitachi Energy India Ltd secured a major order from Adani Mumbai Electric Infrastructure for an 80-kilometer, 1000 MW HVDC transmission system, significantly boosting Mumbai's power supply.
- January 2023: ALLETE and Grid United signed a memorandum of understanding to explore transmission opportunities, potentially leading to a USD 2.5 Billion investment in a North Plains high-voltage cables connector development agreement.
Strategic Outlook for High Voltage Cables Market Market
The high-voltage cables market is poised for continued growth, driven by global energy demands and the expansion of renewable energy infrastructure. The adoption of advanced technologies, along with strategic partnerships and investments in research and development, will be crucial for market leadership. Companies focusing on sustainable practices and innovative product development are expected to gain a competitive edge in this evolving landscape.
High Voltage Cables Market Segmentation
-
1. Location of Deployment
- 1.1. Overhead Cables
- 1.2. Underground Cables
- 1.3. Submarine Cables
-
2. Type of Transmission
- 2.1. HVDC
- 2.2. HVAC
-
3. Voltage Level
- 3.1. 50KV - 110KV
- 3.2. 115KV - 330KV
- 3.3. Greater than 330KV
High Voltage Cables Market Segmentation By Geography
-
1. North America
- 1.1. United States
- 1.2. Canada
- 1.3. Rest of North America
-
2. Asia Pacific
- 2.1. China
- 2.2. India
- 2.3. Japan
- 2.4. Australia
- 2.5. Malaysia
- 2.6. Rest of Asia Pacific
-
3. Europe
- 3.1. Germany
- 3.2. United Kingdom
- 3.3. Italy
- 3.4. France
- 3.5. Rest of Europe
-
4. South America
- 4.1. Brazil
- 4.2. Argentina
- 4.3. Rest of South America
-
5. Middle East and Africa
- 5.1. Saudi Arabia
- 5.2. United Arab Emirates
- 5.3. Qatar
- 5.4. South Africa
- 5.5. Egypt
- 5.6. Rest of Middle East and Africa
High Voltage Cables Market REPORT HIGHLIGHTS
| Aspects | Details |
|---|---|
| Study Period | 2019-2033 |
| Base Year | 2024 |
| Estimated Year | 2025 |
| Forecast Period | 2025-2033 |
| Historical Period | 2019-2024 |
| Growth Rate | CAGR of 5.80% from 2019-2033 |
| Segmentation |
|
Table of Contents
- 1. Introduction
- 1.1. Research Scope
- 1.2. Market Segmentation
- 1.3. Research Methodology
- 1.4. Definitions and Assumptions
- 2. Executive Summary
- 2.1. Introduction
- 3. Market Dynamics
- 3.1. Introduction
- 3.2. Market Drivers
- 3.2.1 Rapid urbanization and industrial growth in regions such as Asia-Pacific
- 3.2.2 the Middle East
- 3.2.3 and Africa are increasing electricity demand. High voltage cables are crucial for supporting the development of urban infrastructure and industrial facilities.
- 3.3. Market Restrains
- 3.3.1 The installation of high voltage cables
- 3.3.2 especially underground and submarine types
- 3.3.3 involves significant costs due to specialized materials
- 3.3.4 equipment
- 3.3.5 and labor. This high initial investment can be a barrier for some projects
- 3.3.6 particularly in cost-sensitive regions.
- 3.4. Market Trends
- 3.4.1 Submarine high voltage cables are increasingly used for offshore wind farms
- 3.4.2 island electrification
- 3.4.3 and intercontinental power transmission projects. These cables enable efficient power transmission over long distances and under challenging environmental conditions.
- 4. Market Factor Analysis
- 4.1. Porters Five Forces
- 4.2. Supply/Value Chain
- 4.3. PESTEL analysis
- 4.4. Market Entropy
- 4.5. Patent/Trademark Analysis
- 5. Global High Voltage Cables Market Analysis, Insights and Forecast, 2019-2031
- 5.1. Market Analysis, Insights and Forecast - by Location of Deployment
- 5.1.1. Overhead Cables
- 5.1.2. Underground Cables
- 5.1.3. Submarine Cables
- 5.2. Market Analysis, Insights and Forecast - by Type of Transmission
- 5.2.1. HVDC
- 5.2.2. HVAC
- 5.3. Market Analysis, Insights and Forecast - by Voltage Level
- 5.3.1. 50KV - 110KV
- 5.3.2. 115KV - 330KV
- 5.3.3. Greater than 330KV
- 5.4. Market Analysis, Insights and Forecast - by Region
- 5.4.1. North America
- 5.4.2. Asia Pacific
- 5.4.3. Europe
- 5.4.4. South America
- 5.4.5. Middle East and Africa
- 5.1. Market Analysis, Insights and Forecast - by Location of Deployment
- 6. North America High Voltage Cables Market Analysis, Insights and Forecast, 2019-2031
- 6.1. Market Analysis, Insights and Forecast - by Location of Deployment
- 6.1.1. Overhead Cables
- 6.1.2. Underground Cables
- 6.1.3. Submarine Cables
- 6.2. Market Analysis, Insights and Forecast - by Type of Transmission
- 6.2.1. HVDC
- 6.2.2. HVAC
- 6.3. Market Analysis, Insights and Forecast - by Voltage Level
- 6.3.1. 50KV - 110KV
- 6.3.2. 115KV - 330KV
- 6.3.3. Greater than 330KV
- 6.1. Market Analysis, Insights and Forecast - by Location of Deployment
- 7. Asia Pacific High Voltage Cables Market Analysis, Insights and Forecast, 2019-2031
- 7.1. Market Analysis, Insights and Forecast - by Location of Deployment
- 7.1.1. Overhead Cables
- 7.1.2. Underground Cables
- 7.1.3. Submarine Cables
- 7.2. Market Analysis, Insights and Forecast - by Type of Transmission
- 7.2.1. HVDC
- 7.2.2. HVAC
- 7.3. Market Analysis, Insights and Forecast - by Voltage Level
- 7.3.1. 50KV - 110KV
- 7.3.2. 115KV - 330KV
- 7.3.3. Greater than 330KV
- 7.1. Market Analysis, Insights and Forecast - by Location of Deployment
- 8. Europe High Voltage Cables Market Analysis, Insights and Forecast, 2019-2031
- 8.1. Market Analysis, Insights and Forecast - by Location of Deployment
- 8.1.1. Overhead Cables
- 8.1.2. Underground Cables
- 8.1.3. Submarine Cables
- 8.2. Market Analysis, Insights and Forecast - by Type of Transmission
- 8.2.1. HVDC
- 8.2.2. HVAC
- 8.3. Market Analysis, Insights and Forecast - by Voltage Level
- 8.3.1. 50KV - 110KV
- 8.3.2. 115KV - 330KV
- 8.3.3. Greater than 330KV
- 8.1. Market Analysis, Insights and Forecast - by Location of Deployment
- 9. South America High Voltage Cables Market Analysis, Insights and Forecast, 2019-2031
- 9.1. Market Analysis, Insights and Forecast - by Location of Deployment
- 9.1.1. Overhead Cables
- 9.1.2. Underground Cables
- 9.1.3. Submarine Cables
- 9.2. Market Analysis, Insights and Forecast - by Type of Transmission
- 9.2.1. HVDC
- 9.2.2. HVAC
- 9.3. Market Analysis, Insights and Forecast - by Voltage Level
- 9.3.1. 50KV - 110KV
- 9.3.2. 115KV - 330KV
- 9.3.3. Greater than 330KV
- 9.1. Market Analysis, Insights and Forecast - by Location of Deployment
- 10. Middle East and Africa High Voltage Cables Market Analysis, Insights and Forecast, 2019-2031
- 10.1. Market Analysis, Insights and Forecast - by Location of Deployment
- 10.1.1. Overhead Cables
- 10.1.2. Underground Cables
- 10.1.3. Submarine Cables
- 10.2. Market Analysis, Insights and Forecast - by Type of Transmission
- 10.2.1. HVDC
- 10.2.2. HVAC
- 10.3. Market Analysis, Insights and Forecast - by Voltage Level
- 10.3.1. 50KV - 110KV
- 10.3.2. 115KV - 330KV
- 10.3.3. Greater than 330KV
- 10.1. Market Analysis, Insights and Forecast - by Location of Deployment
- 11. North America High Voltage Cables Market Analysis, Insights and Forecast, 2019-2031
- 11.1. Market Analysis, Insights and Forecast - By Country/Sub-region
- 11.1.1 United States
- 11.1.2 Canada
- 11.1.3 Rest of North America
- 12. Asia Pacific High Voltage Cables Market Analysis, Insights and Forecast, 2019-2031
- 12.1. Market Analysis, Insights and Forecast - By Country/Sub-region
- 12.1.1 China
- 12.1.2 India
- 12.1.3 Japan
- 12.1.4 Australia
- 12.1.5 Malaysia
- 12.1.6 Rest of Asia Pacific
- 13. Europe High Voltage Cables Market Analysis, Insights and Forecast, 2019-2031
- 13.1. Market Analysis, Insights and Forecast - By Country/Sub-region
- 13.1.1 Germany
- 13.1.2 United Kingdom
- 13.1.3 Italy
- 13.1.4 France
- 13.1.5 Rest of Europe
- 14. South America High Voltage Cables Market Analysis, Insights and Forecast, 2019-2031
- 14.1. Market Analysis, Insights and Forecast - By Country/Sub-region
- 14.1.1 Brazil
- 14.1.2 Argentina
- 14.1.3 Rest of South America
- 15. Middle East and Africa High Voltage Cables Market Analysis, Insights and Forecast, 2019-2031
- 15.1. Market Analysis, Insights and Forecast - By Country/Sub-region
- 15.1.1 Saudi Arabia
- 15.1.2 United Arab Emirates
- 15.1.3 Qatar
- 15.1.4 South Africa
- 15.1.5 Egypt
- 15.1.6 Rest of Middle East and Africa
- 16. Competitive Analysis
- 16.1. Global Market Share Analysis 2024
- 16.2. Company Profiles
- 16.2.1 Finolex Cables Ltd
- 16.2.1.1. Overview
- 16.2.1.2. Products
- 16.2.1.3. SWOT Analysis
- 16.2.1.4. Recent Developments
- 16.2.1.5. Financials (Based on Availability)
- 16.2.2 ABB Ltd
- 16.2.2.1. Overview
- 16.2.2.2. Products
- 16.2.2.3. SWOT Analysis
- 16.2.2.4. Recent Developments
- 16.2.2.5. Financials (Based on Availability)
- 16.2.3 Cable Corporation of India Limited
- 16.2.3.1. Overview
- 16.2.3.2. Products
- 16.2.3.3. SWOT Analysis
- 16.2.3.4. Recent Developments
- 16.2.3.5. Financials (Based on Availability)
- 16.2.4 NKT AS
- 16.2.4.1. Overview
- 16.2.4.2. Products
- 16.2.4.3. SWOT Analysis
- 16.2.4.4. Recent Developments
- 16.2.4.5. Financials (Based on Availability)
- 16.2.5 Tratos
- 16.2.5.1. Overview
- 16.2.5.2. Products
- 16.2.5.3. SWOT Analysis
- 16.2.5.4. Recent Developments
- 16.2.5.5. Financials (Based on Availability)
- 16.2.6 Prysmian SpA
- 16.2.6.1. Overview
- 16.2.6.2. Products
- 16.2.6.3. SWOT Analysis
- 16.2.6.4. Recent Developments
- 16.2.6.5. Financials (Based on Availability)
- 16.2.7 Siemens AG
- 16.2.7.1. Overview
- 16.2.7.2. Products
- 16.2.7.3. SWOT Analysis
- 16.2.7.4. Recent Developments
- 16.2.7.5. Financials (Based on Availability)
- 16.2.8 Nexans SA
- 16.2.8.1. Overview
- 16.2.8.2. Products
- 16.2.8.3. SWOT Analysis
- 16.2.8.4. Recent Developments
- 16.2.8.5. Financials (Based on Availability)
- 16.2.9 Southwire Company LLC
- 16.2.9.1. Overview
- 16.2.9.2. Products
- 16.2.9.3. SWOT Analysis
- 16.2.9.4. Recent Developments
- 16.2.9.5. Financials (Based on Availability)
- 16.2.1 Finolex Cables Ltd
List of Figures
- Figure 1: Global High Voltage Cables Market Revenue Breakdown (Million, %) by Region 2024 & 2032
- Figure 2: North America High Voltage Cables Market Revenue (Million), by Country 2024 & 2032
- Figure 3: North America High Voltage Cables Market Revenue Share (%), by Country 2024 & 2032
- Figure 4: Asia Pacific High Voltage Cables Market Revenue (Million), by Country 2024 & 2032
- Figure 5: Asia Pacific High Voltage Cables Market Revenue Share (%), by Country 2024 & 2032
- Figure 6: Europe High Voltage Cables Market Revenue (Million), by Country 2024 & 2032
- Figure 7: Europe High Voltage Cables Market Revenue Share (%), by Country 2024 & 2032
- Figure 8: South America High Voltage Cables Market Revenue (Million), by Country 2024 & 2032
- Figure 9: South America High Voltage Cables Market Revenue Share (%), by Country 2024 & 2032
- Figure 10: Middle East and Africa High Voltage Cables Market Revenue (Million), by Country 2024 & 2032
- Figure 11: Middle East and Africa High Voltage Cables Market Revenue Share (%), by Country 2024 & 2032
- Figure 12: North America High Voltage Cables Market Revenue (Million), by Location of Deployment 2024 & 2032
- Figure 13: North America High Voltage Cables Market Revenue Share (%), by Location of Deployment 2024 & 2032
- Figure 14: North America High Voltage Cables Market Revenue (Million), by Type of Transmission 2024 & 2032
- Figure 15: North America High Voltage Cables Market Revenue Share (%), by Type of Transmission 2024 & 2032
- Figure 16: North America High Voltage Cables Market Revenue (Million), by Voltage Level 2024 & 2032
- Figure 17: North America High Voltage Cables Market Revenue Share (%), by Voltage Level 2024 & 2032
- Figure 18: North America High Voltage Cables Market Revenue (Million), by Country 2024 & 2032
- Figure 19: North America High Voltage Cables Market Revenue Share (%), by Country 2024 & 2032
- Figure 20: Asia Pacific High Voltage Cables Market Revenue (Million), by Location of Deployment 2024 & 2032
- Figure 21: Asia Pacific High Voltage Cables Market Revenue Share (%), by Location of Deployment 2024 & 2032
- Figure 22: Asia Pacific High Voltage Cables Market Revenue (Million), by Type of Transmission 2024 & 2032
- Figure 23: Asia Pacific High Voltage Cables Market Revenue Share (%), by Type of Transmission 2024 & 2032
- Figure 24: Asia Pacific High Voltage Cables Market Revenue (Million), by Voltage Level 2024 & 2032
- Figure 25: Asia Pacific High Voltage Cables Market Revenue Share (%), by Voltage Level 2024 & 2032
- Figure 26: Asia Pacific High Voltage Cables Market Revenue (Million), by Country 2024 & 2032
- Figure 27: Asia Pacific High Voltage Cables Market Revenue Share (%), by Country 2024 & 2032
- Figure 28: Europe High Voltage Cables Market Revenue (Million), by Location of Deployment 2024 & 2032
- Figure 29: Europe High Voltage Cables Market Revenue Share (%), by Location of Deployment 2024 & 2032
- Figure 30: Europe High Voltage Cables Market Revenue (Million), by Type of Transmission 2024 & 2032
- Figure 31: Europe High Voltage Cables Market Revenue Share (%), by Type of Transmission 2024 & 2032
- Figure 32: Europe High Voltage Cables Market Revenue (Million), by Voltage Level 2024 & 2032
- Figure 33: Europe High Voltage Cables Market Revenue Share (%), by Voltage Level 2024 & 2032
- Figure 34: Europe High Voltage Cables Market Revenue (Million), by Country 2024 & 2032
- Figure 35: Europe High Voltage Cables Market Revenue Share (%), by Country 2024 & 2032
- Figure 36: South America High Voltage Cables Market Revenue (Million), by Location of Deployment 2024 & 2032
- Figure 37: South America High Voltage Cables Market Revenue Share (%), by Location of Deployment 2024 & 2032
- Figure 38: South America High Voltage Cables Market Revenue (Million), by Type of Transmission 2024 & 2032
- Figure 39: South America High Voltage Cables Market Revenue Share (%), by Type of Transmission 2024 & 2032
- Figure 40: South America High Voltage Cables Market Revenue (Million), by Voltage Level 2024 & 2032
- Figure 41: South America High Voltage Cables Market Revenue Share (%), by Voltage Level 2024 & 2032
- Figure 42: South America High Voltage Cables Market Revenue (Million), by Country 2024 & 2032
- Figure 43: South America High Voltage Cables Market Revenue Share (%), by Country 2024 & 2032
- Figure 44: Middle East and Africa High Voltage Cables Market Revenue (Million), by Location of Deployment 2024 & 2032
- Figure 45: Middle East and Africa High Voltage Cables Market Revenue Share (%), by Location of Deployment 2024 & 2032
- Figure 46: Middle East and Africa High Voltage Cables Market Revenue (Million), by Type of Transmission 2024 & 2032
- Figure 47: Middle East and Africa High Voltage Cables Market Revenue Share (%), by Type of Transmission 2024 & 2032
- Figure 48: Middle East and Africa High Voltage Cables Market Revenue (Million), by Voltage Level 2024 & 2032
- Figure 49: Middle East and Africa High Voltage Cables Market Revenue Share (%), by Voltage Level 2024 & 2032
- Figure 50: Middle East and Africa High Voltage Cables Market Revenue (Million), by Country 2024 & 2032
- Figure 51: Middle East and Africa High Voltage Cables Market Revenue Share (%), by Country 2024 & 2032
List of Tables
- Table 1: Global High Voltage Cables Market Revenue Million Forecast, by Region 2019 & 2032
- Table 2: Global High Voltage Cables Market Revenue Million Forecast, by Location of Deployment 2019 & 2032
- Table 3: Global High Voltage Cables Market Revenue Million Forecast, by Type of Transmission 2019 & 2032
- Table 4: Global High Voltage Cables Market Revenue Million Forecast, by Voltage Level 2019 & 2032
- Table 5: Global High Voltage Cables Market Revenue Million Forecast, by Region 2019 & 2032
- Table 6: Global High Voltage Cables Market Revenue Million Forecast, by Country 2019 & 2032
- Table 7: United States High Voltage Cables Market Revenue (Million) Forecast, by Application 2019 & 2032
- Table 8: Canada High Voltage Cables Market Revenue (Million) Forecast, by Application 2019 & 2032
- Table 9: Rest of North America High Voltage Cables Market Revenue (Million) Forecast, by Application 2019 & 2032
- Table 10: Global High Voltage Cables Market Revenue Million Forecast, by Country 2019 & 2032
- Table 11: China High Voltage Cables Market Revenue (Million) Forecast, by Application 2019 & 2032
- Table 12: India High Voltage Cables Market Revenue (Million) Forecast, by Application 2019 & 2032
- Table 13: Japan High Voltage Cables Market Revenue (Million) Forecast, by Application 2019 & 2032
- Table 14: Australia High Voltage Cables Market Revenue (Million) Forecast, by Application 2019 & 2032
- Table 15: Malaysia High Voltage Cables Market Revenue (Million) Forecast, by Application 2019 & 2032
- Table 16: Rest of Asia Pacific High Voltage Cables Market Revenue (Million) Forecast, by Application 2019 & 2032
- Table 17: Global High Voltage Cables Market Revenue Million Forecast, by Country 2019 & 2032
- Table 18: Germany High Voltage Cables Market Revenue (Million) Forecast, by Application 2019 & 2032
- Table 19: United Kingdom High Voltage Cables Market Revenue (Million) Forecast, by Application 2019 & 2032
- Table 20: Italy High Voltage Cables Market Revenue (Million) Forecast, by Application 2019 & 2032
- Table 21: France High Voltage Cables Market Revenue (Million) Forecast, by Application 2019 & 2032
- Table 22: Rest of Europe High Voltage Cables Market Revenue (Million) Forecast, by Application 2019 & 2032
- Table 23: Global High Voltage Cables Market Revenue Million Forecast, by Country 2019 & 2032
- Table 24: Brazil High Voltage Cables Market Revenue (Million) Forecast, by Application 2019 & 2032
- Table 25: Argentina High Voltage Cables Market Revenue (Million) Forecast, by Application 2019 & 2032
- Table 26: Rest of South America High Voltage Cables Market Revenue (Million) Forecast, by Application 2019 & 2032
- Table 27: Global High Voltage Cables Market Revenue Million Forecast, by Country 2019 & 2032
- Table 28: Saudi Arabia High Voltage Cables Market Revenue (Million) Forecast, by Application 2019 & 2032
- Table 29: United Arab Emirates High Voltage Cables Market Revenue (Million) Forecast, by Application 2019 & 2032
- Table 30: Qatar High Voltage Cables Market Revenue (Million) Forecast, by Application 2019 & 2032
- Table 31: South Africa High Voltage Cables Market Revenue (Million) Forecast, by Application 2019 & 2032
- Table 32: Egypt High Voltage Cables Market Revenue (Million) Forecast, by Application 2019 & 2032
- Table 33: Rest of Middle East and Africa High Voltage Cables Market Revenue (Million) Forecast, by Application 2019 & 2032
- Table 34: Global High Voltage Cables Market Revenue Million Forecast, by Location of Deployment 2019 & 2032
- Table 35: Global High Voltage Cables Market Revenue Million Forecast, by Type of Transmission 2019 & 2032
- Table 36: Global High Voltage Cables Market Revenue Million Forecast, by Voltage Level 2019 & 2032
- Table 37: Global High Voltage Cables Market Revenue Million Forecast, by Country 2019 & 2032
- Table 38: United States High Voltage Cables Market Revenue (Million) Forecast, by Application 2019 & 2032
- Table 39: Canada High Voltage Cables Market Revenue (Million) Forecast, by Application 2019 & 2032
- Table 40: Rest of North America High Voltage Cables Market Revenue (Million) Forecast, by Application 2019 & 2032
- Table 41: Global High Voltage Cables Market Revenue Million Forecast, by Location of Deployment 2019 & 2032
- Table 42: Global High Voltage Cables Market Revenue Million Forecast, by Type of Transmission 2019 & 2032
- Table 43: Global High Voltage Cables Market Revenue Million Forecast, by Voltage Level 2019 & 2032
- Table 44: Global High Voltage Cables Market Revenue Million Forecast, by Country 2019 & 2032
- Table 45: China High Voltage Cables Market Revenue (Million) Forecast, by Application 2019 & 2032
- Table 46: India High Voltage Cables Market Revenue (Million) Forecast, by Application 2019 & 2032
- Table 47: Japan High Voltage Cables Market Revenue (Million) Forecast, by Application 2019 & 2032
- Table 48: Australia High Voltage Cables Market Revenue (Million) Forecast, by Application 2019 & 2032
- Table 49: Malaysia High Voltage Cables Market Revenue (Million) Forecast, by Application 2019 & 2032
- Table 50: Rest of Asia Pacific High Voltage Cables Market Revenue (Million) Forecast, by Application 2019 & 2032
- Table 51: Global High Voltage Cables Market Revenue Million Forecast, by Location of Deployment 2019 & 2032
- Table 52: Global High Voltage Cables Market Revenue Million Forecast, by Type of Transmission 2019 & 2032
- Table 53: Global High Voltage Cables Market Revenue Million Forecast, by Voltage Level 2019 & 2032
- Table 54: Global High Voltage Cables Market Revenue Million Forecast, by Country 2019 & 2032
- Table 55: Germany High Voltage Cables Market Revenue (Million) Forecast, by Application 2019 & 2032
- Table 56: United Kingdom High Voltage Cables Market Revenue (Million) Forecast, by Application 2019 & 2032
- Table 57: Italy High Voltage Cables Market Revenue (Million) Forecast, by Application 2019 & 2032
- Table 58: France High Voltage Cables Market Revenue (Million) Forecast, by Application 2019 & 2032
- Table 59: Rest of Europe High Voltage Cables Market Revenue (Million) Forecast, by Application 2019 & 2032
- Table 60: Global High Voltage Cables Market Revenue Million Forecast, by Location of Deployment 2019 & 2032
- Table 61: Global High Voltage Cables Market Revenue Million Forecast, by Type of Transmission 2019 & 2032
- Table 62: Global High Voltage Cables Market Revenue Million Forecast, by Voltage Level 2019 & 2032
- Table 63: Global High Voltage Cables Market Revenue Million Forecast, by Country 2019 & 2032
- Table 64: Brazil High Voltage Cables Market Revenue (Million) Forecast, by Application 2019 & 2032
- Table 65: Argentina High Voltage Cables Market Revenue (Million) Forecast, by Application 2019 & 2032
- Table 66: Rest of South America High Voltage Cables Market Revenue (Million) Forecast, by Application 2019 & 2032
- Table 67: Global High Voltage Cables Market Revenue Million Forecast, by Location of Deployment 2019 & 2032
- Table 68: Global High Voltage Cables Market Revenue Million Forecast, by Type of Transmission 2019 & 2032
- Table 69: Global High Voltage Cables Market Revenue Million Forecast, by Voltage Level 2019 & 2032
- Table 70: Global High Voltage Cables Market Revenue Million Forecast, by Country 2019 & 2032
- Table 71: Saudi Arabia High Voltage Cables Market Revenue (Million) Forecast, by Application 2019 & 2032
- Table 72: United Arab Emirates High Voltage Cables Market Revenue (Million) Forecast, by Application 2019 & 2032
- Table 73: Qatar High Voltage Cables Market Revenue (Million) Forecast, by Application 2019 & 2032
- Table 74: South Africa High Voltage Cables Market Revenue (Million) Forecast, by Application 2019 & 2032
- Table 75: Egypt High Voltage Cables Market Revenue (Million) Forecast, by Application 2019 & 2032
- Table 76: Rest of Middle East and Africa High Voltage Cables Market Revenue (Million) Forecast, by Application 2019 & 2032
Frequently Asked Questions
1. What is the projected Compound Annual Growth Rate (CAGR) of the High Voltage Cables Market?
The projected CAGR is approximately 5.80%.
2. Which companies are prominent players in the High Voltage Cables Market?
Key companies in the market include Finolex Cables Ltd, ABB Ltd, Cable Corporation of India Limited, NKT AS, Tratos, Prysmian SpA, Siemens AG, Nexans SA, Southwire Company LLC.
3. What are the main segments of the High Voltage Cables Market?
The market segments include Location of Deployment, Type of Transmission, Voltage Level.
4. Can you provide details about the market size?
The market size is estimated to be USD 41.60 Million as of 2022.
5. What are some drivers contributing to market growth?
Rapid urbanization and industrial growth in regions such as Asia-Pacific. the Middle East. and Africa are increasing electricity demand. High voltage cables are crucial for supporting the development of urban infrastructure and industrial facilities..
6. What are the notable trends driving market growth?
Submarine high voltage cables are increasingly used for offshore wind farms. island electrification. and intercontinental power transmission projects. These cables enable efficient power transmission over long distances and under challenging environmental conditions..
7. Are there any restraints impacting market growth?
The installation of high voltage cables. especially underground and submarine types. involves significant costs due to specialized materials. equipment. and labor. This high initial investment can be a barrier for some projects. particularly in cost-sensitive regions..
8. Can you provide examples of recent developments in the market?
January 2023: ALLETE and Grid United signed a memorandum of understanding to explore transmission opportunities. The two parties plan to execute a North Plains high voltage cables Connector development agreement during the year's first half. The project represents approximately USD 2.5 billion investment in Montana and North Dakota and will be a long-term asset for those states.
9. What pricing options are available for accessing the report?
Pricing options include single-user, multi-user, and enterprise licenses priced at USD 4750, USD 5250, and USD 8750 respectively.
10. Is the market size provided in terms of value or volume?
The market size is provided in terms of value, measured in Million.
11. Are there any specific market keywords associated with the report?
Yes, the market keyword associated with the report is "High Voltage Cables Market," which aids in identifying and referencing the specific market segment covered.
12. How do I determine which pricing option suits my needs best?
The pricing options vary based on user requirements and access needs. Individual users may opt for single-user licenses, while businesses requiring broader access may choose multi-user or enterprise licenses for cost-effective access to the report.
13. Are there any additional resources or data provided in the High Voltage Cables Market report?
While the report offers comprehensive insights, it's advisable to review the specific contents or supplementary materials provided to ascertain if additional resources or data are available.
14. How can I stay updated on further developments or reports in the High Voltage Cables Market?
To stay informed about further developments, trends, and reports in the High Voltage Cables Market, consider subscribing to industry newsletters, following relevant companies and organizations, or regularly checking reputable industry news sources and publications.
Methodology
Step 1 - Identification of Relevant Samples Size from Population Database


Step 2 - Approaches for Defining Global Market Size (Value, Volume* & Price*)

Note*: In applicable scenarios
Step 3 - Data Sources
Primary Research
- Web Analytics
- Survey Reports
- Research Institute
- Latest Research Reports
- Opinion Leaders
Secondary Research
- Annual Reports
- White Paper
- Latest Press Release
- Industry Association
- Paid Database
- Investor Presentations

Step 4 - Data Triangulation
Involves using different sources of information in order to increase the validity of a study
These sources are likely to be stakeholders in a program - participants, other researchers, program staff, other community members, and so on.
Then we put all data in single framework & apply various statistical tools to find out the dynamic on the market.
During the analysis stage, feedback from the stakeholder groups would be compared to determine areas of agreement as well as areas of divergence


