
Key Insights
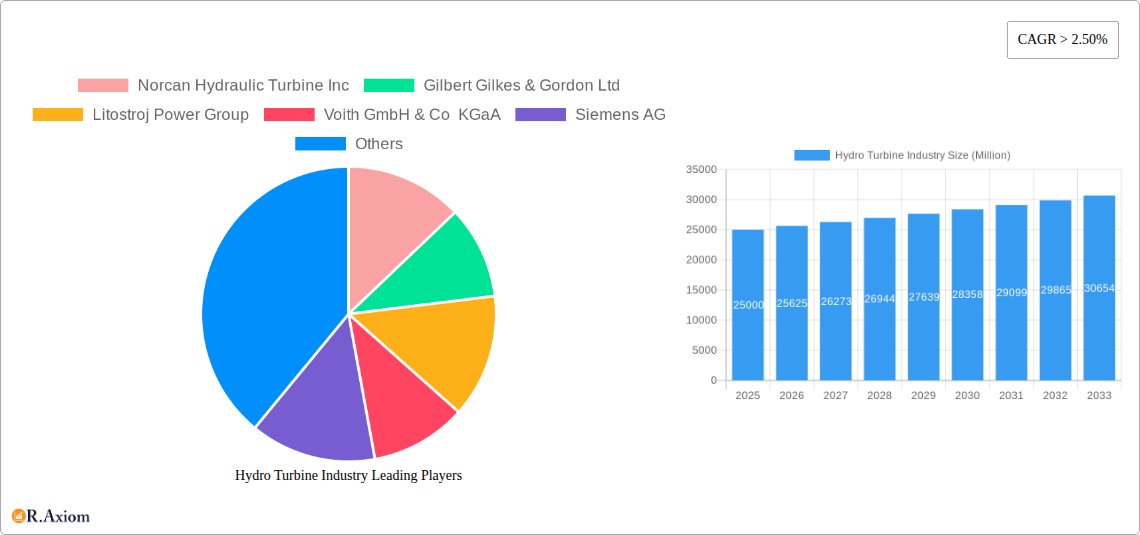
The global hydro turbine market, currently valued at approximately $XX million (estimated based on available CAGR and market trends), is experiencing robust growth, with a compound annual growth rate (CAGR) exceeding 2.50%. This expansion is driven by several key factors. Firstly, the increasing global demand for renewable energy sources is propelling investment in hydroelectric power generation, a crucial element in achieving carbon neutrality targets. Governments worldwide are enacting supportive policies, including subsidies and tax incentives, to encourage the adoption of sustainable energy solutions, further fueling market growth. Secondly, technological advancements in hydro turbine design, such as the development of more efficient reaction and impulse turbines, are enhancing energy output and reducing operational costs. The market also witnesses a rising trend toward larger-scale projects (greater than 100MW), reflecting the pursuit of higher energy generation capacity. However, the market faces certain restraints, primarily the high initial capital investment required for hydroelectric power plant construction and the potential environmental impact of dam construction on surrounding ecosystems. These challenges necessitate careful project planning and consideration of environmental regulations. Furthermore, the geographic distribution of suitable sites for hydroelectric power generation influences market growth patterns, with regions possessing abundant water resources, such as North America, Europe, and Asia-Pacific, experiencing significant market activity.
The segmentation of the hydro turbine market reveals a dynamic interplay of technology and capacity. Reaction and impulse turbines represent distinct technological approaches, each with its own set of applications and efficiencies. Capacity segmentation, categorized as small (less than 10MW), medium (10MW - 100MW), and large (greater than 100MW), highlights the diverse scale of hydroelectric projects. This segmentation reflects varied energy demands and geographical limitations. The leading players in this market, including Norcan Hydraulic Turbine Inc, Gilbert Gilkes & Gordon Ltd, Litostroj Power Group, Voith GmbH & Co KGaA, Siemens AG, WWS-Wasserkraft GmbH, Kirloskar Brothers Ltd, Canyon Industries Inc, General Electric Company, and Andritz AG, are continuously innovating to improve efficiency, reduce costs, and expand their market share. Future growth will depend on addressing environmental concerns, navigating regulatory landscapes, and meeting evolving energy demands globally.
This in-depth report provides a comprehensive analysis of the global hydro turbine industry, covering market size, growth drivers, technological advancements, competitive landscape, and future outlook. The study period spans from 2019 to 2033, with 2025 as the base and estimated year. The forecast period is 2025-2033, and the historical period is 2019-2024. This report is essential for industry stakeholders, investors, and strategic decision-makers seeking actionable insights into this dynamic market.
Hydro Turbine Industry Market Concentration & Innovation
The global hydro turbine market exhibits a moderately concentrated structure, with a handful of multinational corporations holding significant market share. Key players like Voith GmbH & Co KGaA, Siemens AG, Andritz AG, and General Electric Company dominate the landscape, leveraging their extensive experience, technological capabilities, and global reach. Smaller players, including Norcan Hydraulic Turbine Inc, Gilbert Gilkes & Gordon Ltd, Litostroj Power Group, WWS-Wasserkraft GmbH, Kirloskar Brothers Ltd, and Canyon Industries Inc, compete primarily within regional markets or niche segments.
- Market Share (2024 Estimate): The top five players account for approximately xx% of the global market.
- M&A Activity: The industry has witnessed several mergers and acquisitions in recent years, valued at approximately $xx Million, driven by the need to expand geographical reach, enhance technological capabilities, and secure access to new markets. These acquisitions aim to increase the market concentration, particularly within the large-capacity segment.
- Innovation Drivers: The increasing demand for renewable energy, coupled with stringent environmental regulations, is driving innovation in hydro turbine technology. This includes the development of more efficient, sustainable, and cost-effective turbines, along with advanced control systems and digital monitoring capabilities.
Hydro Turbine Industry Industry Trends & Insights
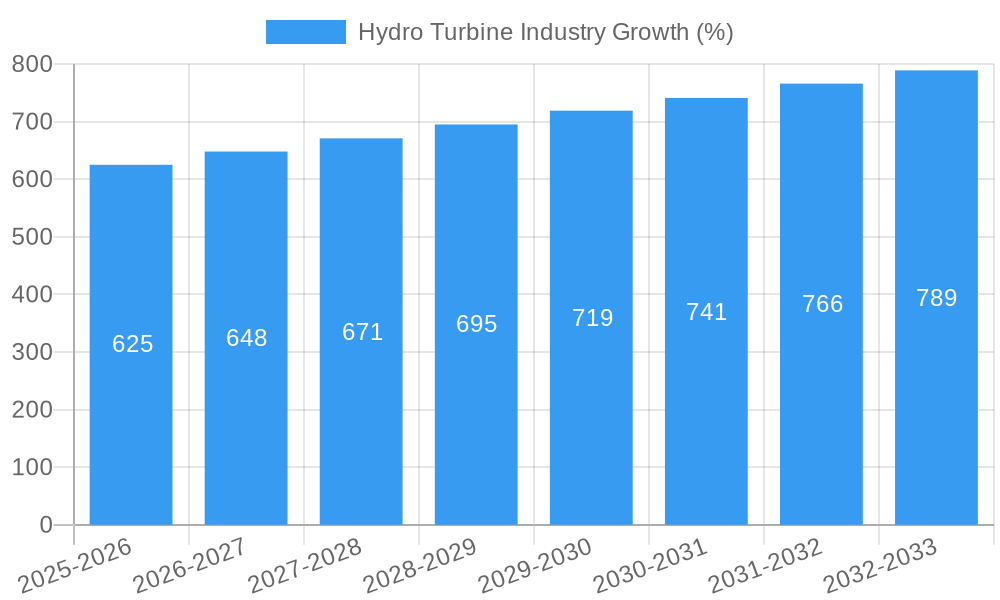
The hydro turbine industry is experiencing robust growth, driven by the global shift towards renewable energy sources. The increasing demand for electricity, particularly in developing economies, coupled with supportive government policies and incentives, is fueling market expansion. Technological advancements, such as the development of higher-efficiency turbines and improved grid integration capabilities, are further contributing to this growth. The market is also witnessing a trend towards larger-capacity turbines, driven by the development of mega-hydro projects. The estimated Compound Annual Growth Rate (CAGR) for the forecast period (2025-2033) is projected to be xx%. Market penetration in emerging economies is expected to increase significantly due to investments in large-scale infrastructure projects. Competitive dynamics are characterized by intense competition among major players and a growing number of niche players specializing in specific segments or technologies.
Dominant Markets & Segments in Hydro Turbine Industry
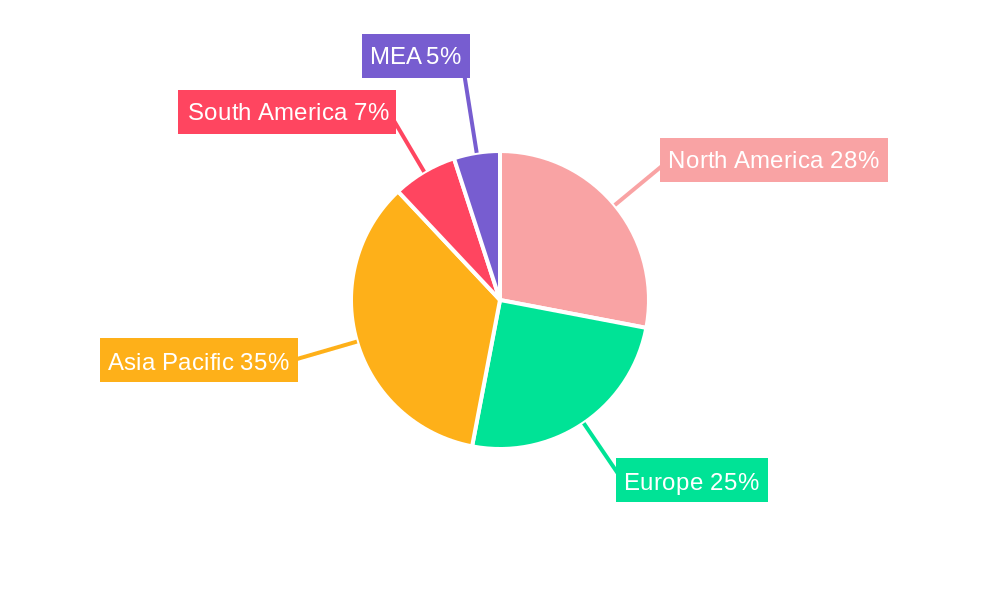
The Asia-Pacific region is expected to dominate the hydro turbine market in the forecast period, owing to significant investments in hydropower infrastructure, driven primarily by the growth in China, India, and Southeast Asia. China continues to hold the largest market share, with massive ongoing investment in large hydropower projects.
- Leading Segment: The large-capacity segment (greater than 100 MW) is expected to witness the highest growth in the forecast period, fueled by the development of mega-hydro projects.
- Technology Trends: While reaction turbines maintain their dominance due to established technology and wide application, Impulse turbines show a noteworthy increase in use in high-head applications.
- Key Drivers:
- Government support for renewable energy initiatives and substantial infrastructure investments are key drivers in the Asia-Pacific region.
- Economic growth and rising energy demand are major growth drivers in several countries.
- Development of sophisticated grid infrastructure to accommodate large-scale hydropower projects.
Hydro Turbine Industry Product Developments
Recent product innovations focus on enhancing efficiency, durability, and environmental sustainability. This includes the development of advanced materials, improved blade designs, and optimized control systems. Manufacturers are incorporating digital technologies, such as IoT sensors and data analytics, to monitor turbine performance, predict maintenance needs, and maximize operational efficiency. This improved monitoring increases the lifespan and efficiency of the hydro turbine, providing a competitive advantage in the market by lowering the life-cycle costs.
Report Scope & Segmentation Analysis
This report segments the hydro turbine market by technology (Reaction, Impulse) and capacity (Small <10 MW, Medium 10-100 MW, Large >100 MW).
- Technology: Reaction turbines hold a larger market share compared to Impulse turbines, while Impulse turbines are showing growing market penetration in specific niches.
- Capacity: The large-capacity segment is expected to experience the highest growth due to increasing investment in mega-hydroelectric projects. Smaller segments will be driven by the development of decentralized and smaller-scale hydropower plants.
Key Drivers of Hydro Turbine Industry Growth
The hydro turbine industry's growth is driven by several factors:
- Renewable Energy Transition: The global shift towards renewable energy sources is the primary driver.
- Government Incentives: Supportive policies and financial incentives from governments worldwide are boosting investment in hydro power.
- Technological Advancements: Improvements in turbine design, materials, and control systems are enhancing efficiency and reducing costs.
Challenges in the Hydro Turbine Industry Sector
The industry faces several challenges:
- High Initial Investment Costs: The substantial capital expenditure required for hydroelectric projects can act as a deterrent.
- Environmental Concerns: Concerns about the environmental impact of large-scale hydropower projects, including habitat disruption and greenhouse gas emissions, create pressure to develop environmentally responsible hydro turbine technologies.
- Grid Integration Challenges: Integrating large quantities of hydroelectric power into existing grids presents significant logistical difficulties.
Emerging Opportunities in Hydro Turbine Industry
Emerging opportunities include:
- Small-Scale Hydropower: Growing interest in decentralized power generation using smaller turbines.
- Hybrid Hydropower Systems: Integrating hydro turbines with other renewable energy sources.
- Advanced Control Systems: Development of sophisticated control systems to enhance efficiency and grid integration.
Leading Players in the Hydro Turbine Industry Market
- Norcan Hydraulic Turbine Inc
- Gilbert Gilkes & Gordon Ltd
- Litostroj Power Group
- Voith GmbH & Co KGaA
- Siemens AG
- WWS-Wasserkraft GmbH
- Kirloskar Brothers Ltd
- Canyon Industries Inc
- General Electric Company
- Andritz AG
Key Developments in Hydro Turbine Industry Industry
- 2022-10: Voith GmbH & Co KGaA launches a new line of high-efficiency turbines.
- 2023-05: Siemens AG acquires a smaller hydro turbine manufacturer, expanding its market share. (Further developments to be added based on available data)
Strategic Outlook for Hydro Turbine Industry Market
The future of the hydro turbine industry looks promising, driven by the increasing demand for renewable energy and ongoing technological advancements. The industry is expected to experience continued growth in the coming years, with the Asia-Pacific region and large-capacity segment leading the expansion. Innovations in efficiency, sustainability, and grid integration will play a critical role in shaping the industry's future trajectory. Companies that successfully adapt to emerging market trends and invest in research and development will be well-positioned to capture significant market share.
Hydro Turbine Industry Segmentation
-
1. Technology
- 1.1. Reaction
- 1.2. Impulse
-
2. Capacity
- 2.1. Small (Less than 10MW)
- 2.2. Medium (10MW - 100MW)
- 2.3. Large (Greater than 100MW)
Hydro Turbine Industry Segmentation By Geography
- 1. North America
- 2. Europe
- 3. Asia Pacific
- 4. South America
- 5. Middle East and Africa
Hydro Turbine Industry REPORT HIGHLIGHTS
| Aspects | Details |
|---|---|
| Study Period | 2019-2033 |
| Base Year | 2024 |
| Estimated Year | 2025 |
| Forecast Period | 2025-2033 |
| Historical Period | 2019-2024 |
| Growth Rate | CAGR of > 2.50% from 2019-2033 |
| Segmentation |
|
Table of Contents
- 1. Introduction
- 1.1. Research Scope
- 1.2. Market Segmentation
- 1.3. Research Methodology
- 1.4. Definitions and Assumptions
- 2. Executive Summary
- 2.1. Introduction
- 3. Market Dynamics
- 3.1. Introduction
- 3.2. Market Drivers
- 3.2.1. 4.; Increasing Shift Toward Renewables-based Distributed Power Generation4.; Rising Investments in Smart Grid
- 3.3. Market Restrains
- 3.3.1. 4.; Expansion and Upgradation of Centralized Grid
- 3.4. Market Trends
- 3.4.1. Reaction Turbine to Dominate the Market
- 4. Market Factor Analysis
- 4.1. Porters Five Forces
- 4.2. Supply/Value Chain
- 4.3. PESTEL analysis
- 4.4. Market Entropy
- 4.5. Patent/Trademark Analysis
- 5. Global Hydro Turbine Industry Analysis, Insights and Forecast, 2019-2031
- 5.1. Market Analysis, Insights and Forecast - by Technology
- 5.1.1. Reaction
- 5.1.2. Impulse
- 5.2. Market Analysis, Insights and Forecast - by Capacity
- 5.2.1. Small (Less than 10MW)
- 5.2.2. Medium (10MW - 100MW)
- 5.2.3. Large (Greater than 100MW)
- 5.3. Market Analysis, Insights and Forecast - by Region
- 5.3.1. North America
- 5.3.2. Europe
- 5.3.3. Asia Pacific
- 5.3.4. South America
- 5.3.5. Middle East and Africa
- 5.1. Market Analysis, Insights and Forecast - by Technology
- 6. North America Hydro Turbine Industry Analysis, Insights and Forecast, 2019-2031
- 6.1. Market Analysis, Insights and Forecast - by Technology
- 6.1.1. Reaction
- 6.1.2. Impulse
- 6.2. Market Analysis, Insights and Forecast - by Capacity
- 6.2.1. Small (Less than 10MW)
- 6.2.2. Medium (10MW - 100MW)
- 6.2.3. Large (Greater than 100MW)
- 6.1. Market Analysis, Insights and Forecast - by Technology
- 7. Europe Hydro Turbine Industry Analysis, Insights and Forecast, 2019-2031
- 7.1. Market Analysis, Insights and Forecast - by Technology
- 7.1.1. Reaction
- 7.1.2. Impulse
- 7.2. Market Analysis, Insights and Forecast - by Capacity
- 7.2.1. Small (Less than 10MW)
- 7.2.2. Medium (10MW - 100MW)
- 7.2.3. Large (Greater than 100MW)
- 7.1. Market Analysis, Insights and Forecast - by Technology
- 8. Asia Pacific Hydro Turbine Industry Analysis, Insights and Forecast, 2019-2031
- 8.1. Market Analysis, Insights and Forecast - by Technology
- 8.1.1. Reaction
- 8.1.2. Impulse
- 8.2. Market Analysis, Insights and Forecast - by Capacity
- 8.2.1. Small (Less than 10MW)
- 8.2.2. Medium (10MW - 100MW)
- 8.2.3. Large (Greater than 100MW)
- 8.1. Market Analysis, Insights and Forecast - by Technology
- 9. South America Hydro Turbine Industry Analysis, Insights and Forecast, 2019-2031
- 9.1. Market Analysis, Insights and Forecast - by Technology
- 9.1.1. Reaction
- 9.1.2. Impulse
- 9.2. Market Analysis, Insights and Forecast - by Capacity
- 9.2.1. Small (Less than 10MW)
- 9.2.2. Medium (10MW - 100MW)
- 9.2.3. Large (Greater than 100MW)
- 9.1. Market Analysis, Insights and Forecast - by Technology
- 10. Middle East and Africa Hydro Turbine Industry Analysis, Insights and Forecast, 2019-2031
- 10.1. Market Analysis, Insights and Forecast - by Technology
- 10.1.1. Reaction
- 10.1.2. Impulse
- 10.2. Market Analysis, Insights and Forecast - by Capacity
- 10.2.1. Small (Less than 10MW)
- 10.2.2. Medium (10MW - 100MW)
- 10.2.3. Large (Greater than 100MW)
- 10.1. Market Analysis, Insights and Forecast - by Technology
- 11. North America Hydro Turbine Industry Analysis, Insights and Forecast, 2019-2031
- 11.1. Market Analysis, Insights and Forecast - By Country/Sub-region
- 11.1.1 United States
- 11.1.2 Canada
- 11.1.3 Mexico
- 12. Europe Hydro Turbine Industry Analysis, Insights and Forecast, 2019-2031
- 12.1. Market Analysis, Insights and Forecast - By Country/Sub-region
- 12.1.1 Germany
- 12.1.2 United Kingdom
- 12.1.3 France
- 12.1.4 Spain
- 12.1.5 Italy
- 12.1.6 Spain
- 12.1.7 Belgium
- 12.1.8 Netherland
- 12.1.9 Nordics
- 12.1.10 Rest of Europe
- 13. Asia Pacific Hydro Turbine Industry Analysis, Insights and Forecast, 2019-2031
- 13.1. Market Analysis, Insights and Forecast - By Country/Sub-region
- 13.1.1 China
- 13.1.2 Japan
- 13.1.3 India
- 13.1.4 South Korea
- 13.1.5 Southeast Asia
- 13.1.6 Australia
- 13.1.7 Indonesia
- 13.1.8 Phillipes
- 13.1.9 Singapore
- 13.1.10 Thailandc
- 13.1.11 Rest of Asia Pacific
- 14. South America Hydro Turbine Industry Analysis, Insights and Forecast, 2019-2031
- 14.1. Market Analysis, Insights and Forecast - By Country/Sub-region
- 14.1.1 Brazil
- 14.1.2 Argentina
- 14.1.3 Peru
- 14.1.4 Chile
- 14.1.5 Colombia
- 14.1.6 Ecuador
- 14.1.7 Venezuela
- 14.1.8 Rest of South America
- 15. MEA Hydro Turbine Industry Analysis, Insights and Forecast, 2019-2031
- 15.1. Market Analysis, Insights and Forecast - By Country/Sub-region
- 15.1.1 United Arab Emirates
- 15.1.2 Saudi Arabia
- 15.1.3 South Africa
- 15.1.4 Rest of Middle East and Africa
- 16. Competitive Analysis
- 16.1. Global Market Share Analysis 2024
- 16.2. Company Profiles
- 16.2.1 Norcan Hydraulic Turbine Inc
- 16.2.1.1. Overview
- 16.2.1.2. Products
- 16.2.1.3. SWOT Analysis
- 16.2.1.4. Recent Developments
- 16.2.1.5. Financials (Based on Availability)
- 16.2.2 Gilbert Gilkes & Gordon Ltd
- 16.2.2.1. Overview
- 16.2.2.2. Products
- 16.2.2.3. SWOT Analysis
- 16.2.2.4. Recent Developments
- 16.2.2.5. Financials (Based on Availability)
- 16.2.3 Litostroj Power Group
- 16.2.3.1. Overview
- 16.2.3.2. Products
- 16.2.3.3. SWOT Analysis
- 16.2.3.4. Recent Developments
- 16.2.3.5. Financials (Based on Availability)
- 16.2.4 Voith GmbH & Co KGaA
- 16.2.4.1. Overview
- 16.2.4.2. Products
- 16.2.4.3. SWOT Analysis
- 16.2.4.4. Recent Developments
- 16.2.4.5. Financials (Based on Availability)
- 16.2.5 Siemens AG
- 16.2.5.1. Overview
- 16.2.5.2. Products
- 16.2.5.3. SWOT Analysis
- 16.2.5.4. Recent Developments
- 16.2.5.5. Financials (Based on Availability)
- 16.2.6 WWS-Wasserkraft GmbH
- 16.2.6.1. Overview
- 16.2.6.2. Products
- 16.2.6.3. SWOT Analysis
- 16.2.6.4. Recent Developments
- 16.2.6.5. Financials (Based on Availability)
- 16.2.7 Kirloskar Brothers Ltd
- 16.2.7.1. Overview
- 16.2.7.2. Products
- 16.2.7.3. SWOT Analysis
- 16.2.7.4. Recent Developments
- 16.2.7.5. Financials (Based on Availability)
- 16.2.8 Canyon Industries Inc
- 16.2.8.1. Overview
- 16.2.8.2. Products
- 16.2.8.3. SWOT Analysis
- 16.2.8.4. Recent Developments
- 16.2.8.5. Financials (Based on Availability)
- 16.2.9 General Electric Company
- 16.2.9.1. Overview
- 16.2.9.2. Products
- 16.2.9.3. SWOT Analysis
- 16.2.9.4. Recent Developments
- 16.2.9.5. Financials (Based on Availability)
- 16.2.10 Andritz AG
- 16.2.10.1. Overview
- 16.2.10.2. Products
- 16.2.10.3. SWOT Analysis
- 16.2.10.4. Recent Developments
- 16.2.10.5. Financials (Based on Availability)
- 16.2.1 Norcan Hydraulic Turbine Inc
List of Figures
- Figure 1: Global Hydro Turbine Industry Revenue Breakdown (Million, %) by Region 2024 & 2032
- Figure 2: North America Hydro Turbine Industry Revenue (Million), by Country 2024 & 2032
- Figure 3: North America Hydro Turbine Industry Revenue Share (%), by Country 2024 & 2032
- Figure 4: Europe Hydro Turbine Industry Revenue (Million), by Country 2024 & 2032
- Figure 5: Europe Hydro Turbine Industry Revenue Share (%), by Country 2024 & 2032
- Figure 6: Asia Pacific Hydro Turbine Industry Revenue (Million), by Country 2024 & 2032
- Figure 7: Asia Pacific Hydro Turbine Industry Revenue Share (%), by Country 2024 & 2032
- Figure 8: South America Hydro Turbine Industry Revenue (Million), by Country 2024 & 2032
- Figure 9: South America Hydro Turbine Industry Revenue Share (%), by Country 2024 & 2032
- Figure 10: MEA Hydro Turbine Industry Revenue (Million), by Country 2024 & 2032
- Figure 11: MEA Hydro Turbine Industry Revenue Share (%), by Country 2024 & 2032
- Figure 12: North America Hydro Turbine Industry Revenue (Million), by Technology 2024 & 2032
- Figure 13: North America Hydro Turbine Industry Revenue Share (%), by Technology 2024 & 2032
- Figure 14: North America Hydro Turbine Industry Revenue (Million), by Capacity 2024 & 2032
- Figure 15: North America Hydro Turbine Industry Revenue Share (%), by Capacity 2024 & 2032
- Figure 16: North America Hydro Turbine Industry Revenue (Million), by Country 2024 & 2032
- Figure 17: North America Hydro Turbine Industry Revenue Share (%), by Country 2024 & 2032
- Figure 18: Europe Hydro Turbine Industry Revenue (Million), by Technology 2024 & 2032
- Figure 19: Europe Hydro Turbine Industry Revenue Share (%), by Technology 2024 & 2032
- Figure 20: Europe Hydro Turbine Industry Revenue (Million), by Capacity 2024 & 2032
- Figure 21: Europe Hydro Turbine Industry Revenue Share (%), by Capacity 2024 & 2032
- Figure 22: Europe Hydro Turbine Industry Revenue (Million), by Country 2024 & 2032
- Figure 23: Europe Hydro Turbine Industry Revenue Share (%), by Country 2024 & 2032
- Figure 24: Asia Pacific Hydro Turbine Industry Revenue (Million), by Technology 2024 & 2032
- Figure 25: Asia Pacific Hydro Turbine Industry Revenue Share (%), by Technology 2024 & 2032
- Figure 26: Asia Pacific Hydro Turbine Industry Revenue (Million), by Capacity 2024 & 2032
- Figure 27: Asia Pacific Hydro Turbine Industry Revenue Share (%), by Capacity 2024 & 2032
- Figure 28: Asia Pacific Hydro Turbine Industry Revenue (Million), by Country 2024 & 2032
- Figure 29: Asia Pacific Hydro Turbine Industry Revenue Share (%), by Country 2024 & 2032
- Figure 30: South America Hydro Turbine Industry Revenue (Million), by Technology 2024 & 2032
- Figure 31: South America Hydro Turbine Industry Revenue Share (%), by Technology 2024 & 2032
- Figure 32: South America Hydro Turbine Industry Revenue (Million), by Capacity 2024 & 2032
- Figure 33: South America Hydro Turbine Industry Revenue Share (%), by Capacity 2024 & 2032
- Figure 34: South America Hydro Turbine Industry Revenue (Million), by Country 2024 & 2032
- Figure 35: South America Hydro Turbine Industry Revenue Share (%), by Country 2024 & 2032
- Figure 36: Middle East and Africa Hydro Turbine Industry Revenue (Million), by Technology 2024 & 2032
- Figure 37: Middle East and Africa Hydro Turbine Industry Revenue Share (%), by Technology 2024 & 2032
- Figure 38: Middle East and Africa Hydro Turbine Industry Revenue (Million), by Capacity 2024 & 2032
- Figure 39: Middle East and Africa Hydro Turbine Industry Revenue Share (%), by Capacity 2024 & 2032
- Figure 40: Middle East and Africa Hydro Turbine Industry Revenue (Million), by Country 2024 & 2032
- Figure 41: Middle East and Africa Hydro Turbine Industry Revenue Share (%), by Country 2024 & 2032
List of Tables
- Table 1: Global Hydro Turbine Industry Revenue Million Forecast, by Region 2019 & 2032
- Table 2: Global Hydro Turbine Industry Revenue Million Forecast, by Technology 2019 & 2032
- Table 3: Global Hydro Turbine Industry Revenue Million Forecast, by Capacity 2019 & 2032
- Table 4: Global Hydro Turbine Industry Revenue Million Forecast, by Region 2019 & 2032
- Table 5: Global Hydro Turbine Industry Revenue Million Forecast, by Country 2019 & 2032
- Table 6: United States Hydro Turbine Industry Revenue (Million) Forecast, by Application 2019 & 2032
- Table 7: Canada Hydro Turbine Industry Revenue (Million) Forecast, by Application 2019 & 2032
- Table 8: Mexico Hydro Turbine Industry Revenue (Million) Forecast, by Application 2019 & 2032
- Table 9: Global Hydro Turbine Industry Revenue Million Forecast, by Country 2019 & 2032
- Table 10: Germany Hydro Turbine Industry Revenue (Million) Forecast, by Application 2019 & 2032
- Table 11: United Kingdom Hydro Turbine Industry Revenue (Million) Forecast, by Application 2019 & 2032
- Table 12: France Hydro Turbine Industry Revenue (Million) Forecast, by Application 2019 & 2032
- Table 13: Spain Hydro Turbine Industry Revenue (Million) Forecast, by Application 2019 & 2032
- Table 14: Italy Hydro Turbine Industry Revenue (Million) Forecast, by Application 2019 & 2032
- Table 15: Spain Hydro Turbine Industry Revenue (Million) Forecast, by Application 2019 & 2032
- Table 16: Belgium Hydro Turbine Industry Revenue (Million) Forecast, by Application 2019 & 2032
- Table 17: Netherland Hydro Turbine Industry Revenue (Million) Forecast, by Application 2019 & 2032
- Table 18: Nordics Hydro Turbine Industry Revenue (Million) Forecast, by Application 2019 & 2032
- Table 19: Rest of Europe Hydro Turbine Industry Revenue (Million) Forecast, by Application 2019 & 2032
- Table 20: Global Hydro Turbine Industry Revenue Million Forecast, by Country 2019 & 2032
- Table 21: China Hydro Turbine Industry Revenue (Million) Forecast, by Application 2019 & 2032
- Table 22: Japan Hydro Turbine Industry Revenue (Million) Forecast, by Application 2019 & 2032
- Table 23: India Hydro Turbine Industry Revenue (Million) Forecast, by Application 2019 & 2032
- Table 24: South Korea Hydro Turbine Industry Revenue (Million) Forecast, by Application 2019 & 2032
- Table 25: Southeast Asia Hydro Turbine Industry Revenue (Million) Forecast, by Application 2019 & 2032
- Table 26: Australia Hydro Turbine Industry Revenue (Million) Forecast, by Application 2019 & 2032
- Table 27: Indonesia Hydro Turbine Industry Revenue (Million) Forecast, by Application 2019 & 2032
- Table 28: Phillipes Hydro Turbine Industry Revenue (Million) Forecast, by Application 2019 & 2032
- Table 29: Singapore Hydro Turbine Industry Revenue (Million) Forecast, by Application 2019 & 2032
- Table 30: Thailandc Hydro Turbine Industry Revenue (Million) Forecast, by Application 2019 & 2032
- Table 31: Rest of Asia Pacific Hydro Turbine Industry Revenue (Million) Forecast, by Application 2019 & 2032
- Table 32: Global Hydro Turbine Industry Revenue Million Forecast, by Country 2019 & 2032
- Table 33: Brazil Hydro Turbine Industry Revenue (Million) Forecast, by Application 2019 & 2032
- Table 34: Argentina Hydro Turbine Industry Revenue (Million) Forecast, by Application 2019 & 2032
- Table 35: Peru Hydro Turbine Industry Revenue (Million) Forecast, by Application 2019 & 2032
- Table 36: Chile Hydro Turbine Industry Revenue (Million) Forecast, by Application 2019 & 2032
- Table 37: Colombia Hydro Turbine Industry Revenue (Million) Forecast, by Application 2019 & 2032
- Table 38: Ecuador Hydro Turbine Industry Revenue (Million) Forecast, by Application 2019 & 2032
- Table 39: Venezuela Hydro Turbine Industry Revenue (Million) Forecast, by Application 2019 & 2032
- Table 40: Rest of South America Hydro Turbine Industry Revenue (Million) Forecast, by Application 2019 & 2032
- Table 41: Global Hydro Turbine Industry Revenue Million Forecast, by Country 2019 & 2032
- Table 42: United Arab Emirates Hydro Turbine Industry Revenue (Million) Forecast, by Application 2019 & 2032
- Table 43: Saudi Arabia Hydro Turbine Industry Revenue (Million) Forecast, by Application 2019 & 2032
- Table 44: South Africa Hydro Turbine Industry Revenue (Million) Forecast, by Application 2019 & 2032
- Table 45: Rest of Middle East and Africa Hydro Turbine Industry Revenue (Million) Forecast, by Application 2019 & 2032
- Table 46: Global Hydro Turbine Industry Revenue Million Forecast, by Technology 2019 & 2032
- Table 47: Global Hydro Turbine Industry Revenue Million Forecast, by Capacity 2019 & 2032
- Table 48: Global Hydro Turbine Industry Revenue Million Forecast, by Country 2019 & 2032
- Table 49: Global Hydro Turbine Industry Revenue Million Forecast, by Technology 2019 & 2032
- Table 50: Global Hydro Turbine Industry Revenue Million Forecast, by Capacity 2019 & 2032
- Table 51: Global Hydro Turbine Industry Revenue Million Forecast, by Country 2019 & 2032
- Table 52: Global Hydro Turbine Industry Revenue Million Forecast, by Technology 2019 & 2032
- Table 53: Global Hydro Turbine Industry Revenue Million Forecast, by Capacity 2019 & 2032
- Table 54: Global Hydro Turbine Industry Revenue Million Forecast, by Country 2019 & 2032
- Table 55: Global Hydro Turbine Industry Revenue Million Forecast, by Technology 2019 & 2032
- Table 56: Global Hydro Turbine Industry Revenue Million Forecast, by Capacity 2019 & 2032
- Table 57: Global Hydro Turbine Industry Revenue Million Forecast, by Country 2019 & 2032
- Table 58: Global Hydro Turbine Industry Revenue Million Forecast, by Technology 2019 & 2032
- Table 59: Global Hydro Turbine Industry Revenue Million Forecast, by Capacity 2019 & 2032
- Table 60: Global Hydro Turbine Industry Revenue Million Forecast, by Country 2019 & 2032
Frequently Asked Questions
1. What is the projected Compound Annual Growth Rate (CAGR) of the Hydro Turbine Industry?
The projected CAGR is approximately > 2.50%.
2. Which companies are prominent players in the Hydro Turbine Industry?
Key companies in the market include Norcan Hydraulic Turbine Inc, Gilbert Gilkes & Gordon Ltd, Litostroj Power Group, Voith GmbH & Co KGaA, Siemens AG, WWS-Wasserkraft GmbH, Kirloskar Brothers Ltd, Canyon Industries Inc, General Electric Company, Andritz AG.
3. What are the main segments of the Hydro Turbine Industry?
The market segments include Technology, Capacity.
4. Can you provide details about the market size?
The market size is estimated to be USD XX Million as of 2022.
5. What are some drivers contributing to market growth?
4.; Increasing Shift Toward Renewables-based Distributed Power Generation4.; Rising Investments in Smart Grid.
6. What are the notable trends driving market growth?
Reaction Turbine to Dominate the Market.
7. Are there any restraints impacting market growth?
4.; Expansion and Upgradation of Centralized Grid.
8. Can you provide examples of recent developments in the market?
N/A
9. What pricing options are available for accessing the report?
Pricing options include single-user, multi-user, and enterprise licenses priced at USD 4750, USD 5250, and USD 8750 respectively.
10. Is the market size provided in terms of value or volume?
The market size is provided in terms of value, measured in Million.
11. Are there any specific market keywords associated with the report?
Yes, the market keyword associated with the report is "Hydro Turbine Industry," which aids in identifying and referencing the specific market segment covered.
12. How do I determine which pricing option suits my needs best?
The pricing options vary based on user requirements and access needs. Individual users may opt for single-user licenses, while businesses requiring broader access may choose multi-user or enterprise licenses for cost-effective access to the report.
13. Are there any additional resources or data provided in the Hydro Turbine Industry report?
While the report offers comprehensive insights, it's advisable to review the specific contents or supplementary materials provided to ascertain if additional resources or data are available.
14. How can I stay updated on further developments or reports in the Hydro Turbine Industry?
To stay informed about further developments, trends, and reports in the Hydro Turbine Industry, consider subscribing to industry newsletters, following relevant companies and organizations, or regularly checking reputable industry news sources and publications.
Methodology
Step 1 - Identification of Relevant Samples Size from Population Database


Step 2 - Approaches for Defining Global Market Size (Value, Volume* & Price*)

Note*: In applicable scenarios
Step 3 - Data Sources
Primary Research
- Web Analytics
- Survey Reports
- Research Institute
- Latest Research Reports
- Opinion Leaders
Secondary Research
- Annual Reports
- White Paper
- Latest Press Release
- Industry Association
- Paid Database
- Investor Presentations

Step 4 - Data Triangulation
Involves using different sources of information in order to increase the validity of a study
These sources are likely to be stakeholders in a program - participants, other researchers, program staff, other community members, and so on.
Then we put all data in single framework & apply various statistical tools to find out the dynamic on the market.
During the analysis stage, feedback from the stakeholder groups would be compared to determine areas of agreement as well as areas of divergence


