
Key Insights
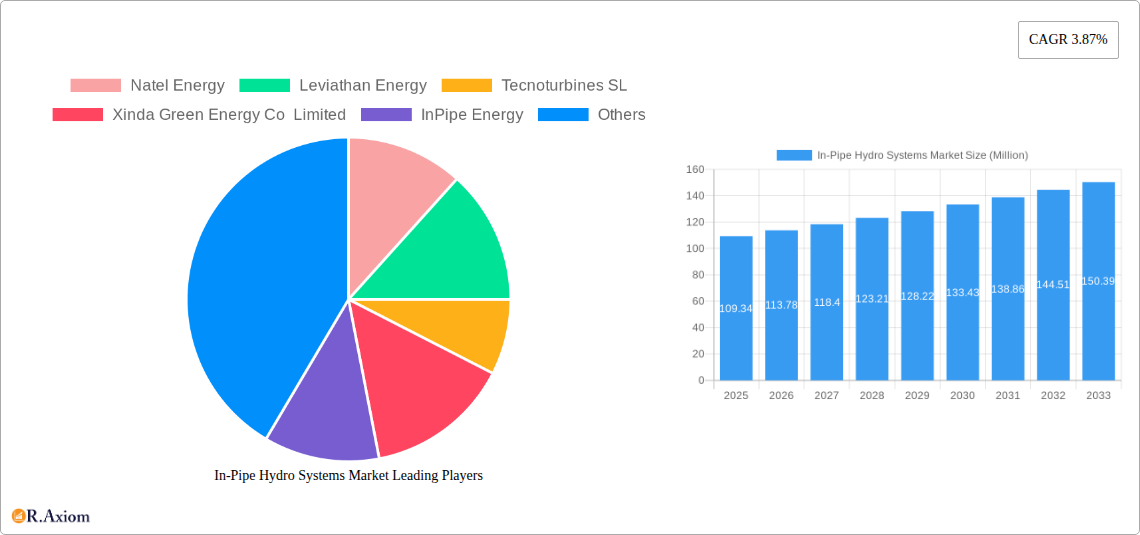
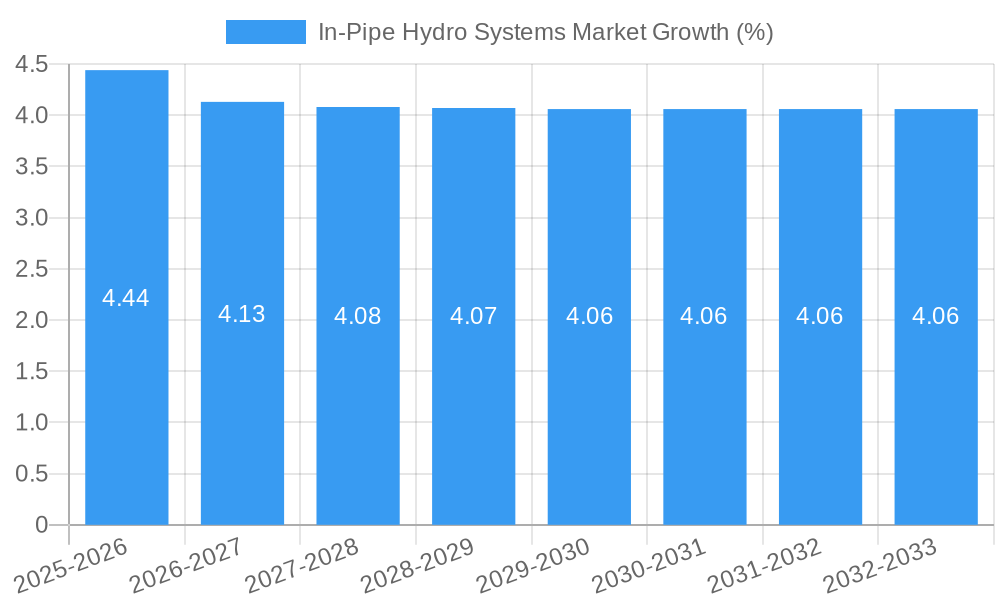
The In-Pipe Hydro Systems market, valued at $109.34 million in 2025, is projected to experience steady growth, driven by increasing demand for sustainable energy solutions and the rising need for decentralized power generation. A Compound Annual Growth Rate (CAGR) of 3.87% from 2025 to 2033 indicates a substantial market expansion, particularly within the municipal water and wastewater treatment sectors. This segment’s growth stems from the ability of in-pipe hydro systems to leverage existing infrastructure, reducing installation costs and environmental impact compared to traditional hydropower plants. Furthermore, advancements in turbine technology, particularly in mini and micro-hydro systems (up to 100kW), are enhancing efficiency and expanding applications across industrial water systems and irrigation projects. The adoption of these systems is likely to be further fueled by supportive government policies aimed at promoting renewable energy sources and reducing carbon emissions. However, challenges such as the need for specific pipeline characteristics and the initial capital investment required for installation might restrain market growth in certain regions.
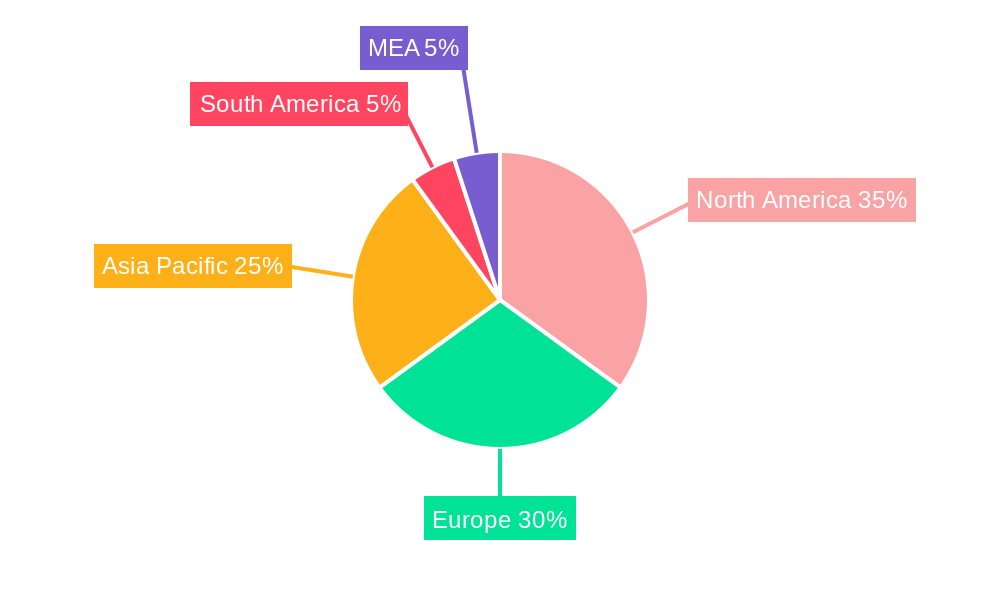
The geographical distribution of the market is diverse, with North America, Europe, and Asia Pacific anticipated as key contributors to overall growth. North America's strong emphasis on environmental sustainability and the presence of established players in the renewable energy sector are expected to drive significant adoption. Meanwhile, Europe's commitment to renewable energy targets and Asia Pacific's rapid urbanization and industrialization will create substantial demand for in-pipe hydro systems. Competition within the market is evident, with key players like Natel Energy, Leviathan Energy, and Tecnoturbines SL continuously developing innovative technologies and expanding their market reach. The forecast period (2025-2033) presents significant opportunities for market expansion as awareness of in-pipe hydro's potential increases and technological advancements overcome existing limitations. The focus will likely shift towards optimizing system efficiency, expanding application diversity, and reducing installation costs to further accelerate market penetration.
In-Pipe Hydro Systems Market: A Comprehensive Report (2019-2033)
This comprehensive report provides a detailed analysis of the In-Pipe Hydro Systems market, offering invaluable insights for stakeholders, investors, and industry professionals. Covering the period from 2019 to 2033, with a focus on the 2025-2033 forecast, this report delves into market dynamics, competitive landscapes, technological advancements, and emerging opportunities within this rapidly evolving sector. The study utilizes a robust methodology, incorporating historical data (2019-2024), a base year of 2025, and projections extending to 2033. The report's value is further enhanced by its granular segmentation, examining various applications and capacity segments to provide a holistic market overview.
In-Pipe Hydro Systems Market Concentration & Innovation
The In-Pipe Hydro Systems market exhibits a moderately concentrated landscape, with a few key players holding significant market share. While precise market share figures require further data analysis (xx%), the market is characterized by both established players and emerging innovators. Companies such as Natel Energy, Leviathan Energy, and InPipe Energy are driving innovation through the development of advanced turbine technologies and efficient energy recovery systems. The market is subject to considerable regulatory influence, particularly concerning environmental standards and permitting processes. These regulations, while potentially hindering market growth, also incentivize the adoption of cleaner energy solutions. The emergence of more efficient and cost-effective technologies is crucial for market expansion, mitigating challenges posed by substitutes like traditional pressure-regulating valves. End-user trends reveal a growing preference for sustainable and cost-effective energy sources, aligning favorably with the In-Pipe Hydro Systems market proposition. Mergers and acquisitions (M&A) activities within the sector have been moderate, with deal values averaging around xx Million USD in recent years, mostly involving smaller companies being absorbed by larger players to enhance technology portfolios. The overall trend is towards further consolidation as the market matures and standardization occurs in manufacturing and deployment.
- Key Players: Natel Energy, Leviathan Energy, InPipe Energy, Tecnoturbines SL, Xinda Green Energy Co Limited, HS Dynamic Energy Co Ltd, GS-Hydro, Rentricity Inc, Lucid Energy Inc.
- M&A Activity: Moderate activity observed; average deal value xx Million USD (2019-2024).
- Regulatory Framework: Significant influence, focusing on environmental compliance and permitting.
- Innovation Drivers: Technological advancements in turbine design, improved energy conversion efficiency, and cost reduction initiatives.
In-Pipe Hydro Systems Market Industry Trends & Insights
The In-Pipe Hydro Systems market is experiencing robust growth, driven primarily by the increasing global demand for renewable energy sources and the need for efficient water management solutions. The market is projected to achieve a Compound Annual Growth Rate (CAGR) of xx% during the forecast period (2025-2033). Technological disruptions, such as advancements in turbine design and energy storage technologies, are further fueling market expansion. Consumer preferences are shifting towards sustainable energy solutions, which has a demonstrably positive impact on market penetration. The rising awareness of the environmental benefits and the potential for energy independence is driving adoption in both municipal and industrial sectors. Competitive dynamics are shaped by technological innovation, cost competitiveness, and the ability to effectively navigate regulatory frameworks. The market also sees increased integration with smart water management systems, presenting considerable opportunities for value-added services and optimized energy production. The market penetration rate is expected to increase from xx% in 2025 to xx% by 2033, largely fueled by increased investment in renewable energy infrastructure and municipal water upgrade projects.
Dominant Markets & Segments in In-Pipe Hydro Systems Market
The Municipal Water or Wastewater Systems segment is currently the dominant application area for In-Pipe Hydro Systems, capturing a significant market share (xx%) due to the substantial water flow volumes in these systems and the associated potential for energy generation. This segment is further subdivided based on the system's capacity (Pico-hydro, Micro-hydro, Mini-hydro), with the Micro-hydro segment showing the fastest growth.
Leading Region/Country: North America, with a strong emphasis on California. Europe and Asia-Pacific are projected to show significant growth.
Key Drivers for Municipal Water or Wastewater Systems:
- Stringent environmental regulations promoting renewable energy adoption.
- Increasing energy costs driving operational efficiency improvements.
- Government incentives and funding programs supporting renewable energy projects.
- Aging infrastructure necessitating upgrades and integration of new technologies.
Industrial Water Systems: This segment is expected to grow steadily driven by the increasing need to reduce operational costs and environmental footprint in industrial settings.
Other Applications (Irrigation Systems, Urban and Building Applications, etc.): This segment is likely to show slower growth initially, with significant potential for growth in the later part of the forecast period (2030-2033) as more cost-effective solutions and greater deployment experience become available.
Capacity Segment Dominance: The Micro-hydro segment (up to 100kW) currently holds a majority share but the Mini-hydro segment (100kW and above) is anticipated to increase its market share.
In-Pipe Hydro Systems Market Product Developments
Recent product innovations focus on enhancing efficiency, reducing installation costs, and improving system durability. The development of advanced turbine designs, along with the integration of smart sensors and remote monitoring capabilities, are key technological trends. These improvements allow for better system optimization and reduced maintenance requirements, enhancing the overall market fit and making In-Pipe Hydro Systems a more attractive solution for a wider range of applications. The HydroXS system launched by InPipe Energy exemplifies this trend towards enhanced performance and versatility.
Report Scope & Segmentation Analysis
This report segments the In-Pipe Hydro Systems market by application (Municipal Water or Wastewater Systems, Industrial Water Systems, Other Applications) and capacity (Pico-hydro, Micro-hydro, Mini-hydro). Each segment's growth trajectory is individually assessed, considering prevailing market dynamics, technological advancements, and regional variations. Market sizes are provided for each segment, highlighting current market shares and anticipated future growth. The competitive landscape within each segment is analyzed, exploring the strategies and positions of key players. Growth projections are based on multiple factors including technological innovation, regulatory policies, and broader economic conditions.
Key Drivers of In-Pipe Hydro Systems Market Growth
The In-Pipe Hydro Systems market is driven by several key factors: the global push towards renewable energy, increasing pressure to reduce carbon emissions, rising energy costs for traditional sources, and the potential for significant cost savings through energy recovery in water distribution systems. Furthermore, government incentives and supportive regulatory policies, including subsidies and tax credits, are boosting the market's growth. Technological advancements in turbine design and efficiency, along with the ongoing development of more compact and cost-effective systems, contribute significantly to this positive momentum.
Challenges in the In-Pipe Hydro Systems Market Sector
Despite the substantial market potential, several challenges hamper the widespread adoption of In-Pipe Hydro Systems. High initial investment costs can be a barrier, especially for smaller municipalities or industries. Complex permitting and regulatory processes add to the time and cost associated with project implementation. Furthermore, the technical complexity of integrating these systems into existing water infrastructure can pose significant challenges. Lastly, competition from traditional pressure-regulating valves, and sometimes even from other renewable energy sources, is creating price pressure on the market. These combined factors might cause the market to grow at a slightly slower rate than projected if not properly addressed.
Emerging Opportunities in In-Pipe Hydro Systems Market
Significant opportunities exist for expansion into new geographical regions and application areas. The integration of In-Pipe Hydro Systems with smart water management technologies will improve energy efficiency and create opportunities for data-driven optimization. Furthermore, the development of innovative financing models and partnerships with water utilities can significantly boost market adoption. The exploration of hybrid systems integrating In-Pipe technology with other renewable energy sources presents an exciting pathway for future growth.
Leading Players in the In-Pipe Hydro Systems Market Market
- Natel Energy
- Leviathan Energy
- Tecnoturbines SL
- Xinda Green Energy Co Limited
- InPipe Energy
- HS Dynamic Energy Co Ltd
- GS-Hydro
- Rentricity Inc
- Lucid Energy Inc
Key Developments in In-Pipe Hydro Systems Market Industry
December 2023: The East Bay Municipal Utility District (EBMUD) partnered with InPipe Energy, marking the first installation of InPipe technology in California, showcasing the technology's viability and market penetration.
July 2022: InPipe Energy launched the HydroXS, a next-generation micro-hydro energy recovery technology, demonstrating continued innovation within the market.
Strategic Outlook for In-Pipe Hydro Systems Market Market
The In-Pipe Hydro Systems market presents a compelling investment opportunity, driven by increasing global demand for sustainable energy solutions and the ever-growing need for efficient water management. Future market potential is significant, with continued technological innovation, supportive government policies, and the growing awareness of the environmental and economic benefits fueling long-term growth. Expanding into new markets and diversifying applications will be essential for capturing the full market potential. The focus on cost-effectiveness and ease of integration will continue to be key factors influencing market success.
In-Pipe Hydro Systems Market Segmentation
-
1. Application
- 1.1. Municipal Water or Wastewater Systems
- 1.2. Industrial Water Systems
- 1.3. Other Ap
-
2. Capacity
- 2.1. Pico-hydro (Up To 5kW)
- 2.2. Micro-hydro (Up To 100kW)
- 2.3. Mini-hydro (100kW and Above)
In-Pipe Hydro Systems Market Segmentation By Geography
-
1. North America
- 1.1. United States
- 1.2. Canada
- 1.3. Rest of North America
-
2. Asia Pacific
- 2.1. China
- 2.2. Japan
- 2.3. South Korea
- 2.4. India
- 2.5. Malaysia
- 2.6. Thailand
- 2.7. Indonesia
- 2.8. Vietnam
- 2.9. Rest of Asia Pacific
-
3. Europe
- 3.1. United Kingdom
- 3.2. Germany
- 3.3. France
- 3.4. Italy
- 3.5. Spain
- 3.6. Nordic Countries
- 3.7. Turkey
- 3.8. Russia
- 3.9. Rest of Europe
-
4. South America
- 4.1. Brazil
- 4.2. Argentina
- 4.3. Colombia
- 4.4. Rest of South America
-
5. Middle East and Africa
- 5.1. Saudi Arabia
- 5.2. United Arab Emirates
- 5.3. Nigeria
- 5.4. Qatar
- 5.5. Egypt
- 5.6. Rest of Middle East and Africa
In-Pipe Hydro Systems Market REPORT HIGHLIGHTS
| Aspects | Details |
|---|---|
| Study Period | 2019-2033 |
| Base Year | 2024 |
| Estimated Year | 2025 |
| Forecast Period | 2025-2033 |
| Historical Period | 2019-2024 |
| Growth Rate | CAGR of 3.87% from 2019-2033 |
| Segmentation |
|
Table of Contents
- 1. Introduction
- 1.1. Research Scope
- 1.2. Market Segmentation
- 1.3. Research Methodology
- 1.4. Definitions and Assumptions
- 2. Executive Summary
- 2.1. Introduction
- 3. Market Dynamics
- 3.1. Introduction
- 3.2. Market Drivers
- 3.2.1. Increased Focus on Renewable Power Generation4.; Rising Need for Efficient Power Generation
- 3.3. Market Restrains
- 3.3.1. High Initial Capital Investment
- 3.4. Market Trends
- 3.4.1. Industrial Water Systems to Witness Significant Demand
- 4. Market Factor Analysis
- 4.1. Porters Five Forces
- 4.2. Supply/Value Chain
- 4.3. PESTEL analysis
- 4.4. Market Entropy
- 4.5. Patent/Trademark Analysis
- 5. Global In-Pipe Hydro Systems Market Analysis, Insights and Forecast, 2019-2031
- 5.1. Market Analysis, Insights and Forecast - by Application
- 5.1.1. Municipal Water or Wastewater Systems
- 5.1.2. Industrial Water Systems
- 5.1.3. Other Ap
- 5.2. Market Analysis, Insights and Forecast - by Capacity
- 5.2.1. Pico-hydro (Up To 5kW)
- 5.2.2. Micro-hydro (Up To 100kW)
- 5.2.3. Mini-hydro (100kW and Above)
- 5.3. Market Analysis, Insights and Forecast - by Region
- 5.3.1. North America
- 5.3.2. Asia Pacific
- 5.3.3. Europe
- 5.3.4. South America
- 5.3.5. Middle East and Africa
- 5.1. Market Analysis, Insights and Forecast - by Application
- 6. North America In-Pipe Hydro Systems Market Analysis, Insights and Forecast, 2019-2031
- 6.1. Market Analysis, Insights and Forecast - by Application
- 6.1.1. Municipal Water or Wastewater Systems
- 6.1.2. Industrial Water Systems
- 6.1.3. Other Ap
- 6.2. Market Analysis, Insights and Forecast - by Capacity
- 6.2.1. Pico-hydro (Up To 5kW)
- 6.2.2. Micro-hydro (Up To 100kW)
- 6.2.3. Mini-hydro (100kW and Above)
- 6.1. Market Analysis, Insights and Forecast - by Application
- 7. Asia Pacific In-Pipe Hydro Systems Market Analysis, Insights and Forecast, 2019-2031
- 7.1. Market Analysis, Insights and Forecast - by Application
- 7.1.1. Municipal Water or Wastewater Systems
- 7.1.2. Industrial Water Systems
- 7.1.3. Other Ap
- 7.2. Market Analysis, Insights and Forecast - by Capacity
- 7.2.1. Pico-hydro (Up To 5kW)
- 7.2.2. Micro-hydro (Up To 100kW)
- 7.2.3. Mini-hydro (100kW and Above)
- 7.1. Market Analysis, Insights and Forecast - by Application
- 8. Europe In-Pipe Hydro Systems Market Analysis, Insights and Forecast, 2019-2031
- 8.1. Market Analysis, Insights and Forecast - by Application
- 8.1.1. Municipal Water or Wastewater Systems
- 8.1.2. Industrial Water Systems
- 8.1.3. Other Ap
- 8.2. Market Analysis, Insights and Forecast - by Capacity
- 8.2.1. Pico-hydro (Up To 5kW)
- 8.2.2. Micro-hydro (Up To 100kW)
- 8.2.3. Mini-hydro (100kW and Above)
- 8.1. Market Analysis, Insights and Forecast - by Application
- 9. South America In-Pipe Hydro Systems Market Analysis, Insights and Forecast, 2019-2031
- 9.1. Market Analysis, Insights and Forecast - by Application
- 9.1.1. Municipal Water or Wastewater Systems
- 9.1.2. Industrial Water Systems
- 9.1.3. Other Ap
- 9.2. Market Analysis, Insights and Forecast - by Capacity
- 9.2.1. Pico-hydro (Up To 5kW)
- 9.2.2. Micro-hydro (Up To 100kW)
- 9.2.3. Mini-hydro (100kW and Above)
- 9.1. Market Analysis, Insights and Forecast - by Application
- 10. Middle East and Africa In-Pipe Hydro Systems Market Analysis, Insights and Forecast, 2019-2031
- 10.1. Market Analysis, Insights and Forecast - by Application
- 10.1.1. Municipal Water or Wastewater Systems
- 10.1.2. Industrial Water Systems
- 10.1.3. Other Ap
- 10.2. Market Analysis, Insights and Forecast - by Capacity
- 10.2.1. Pico-hydro (Up To 5kW)
- 10.2.2. Micro-hydro (Up To 100kW)
- 10.2.3. Mini-hydro (100kW and Above)
- 10.1. Market Analysis, Insights and Forecast - by Application
- 11. North America In-Pipe Hydro Systems Market Analysis, Insights and Forecast, 2019-2031
- 11.1. Market Analysis, Insights and Forecast - By Country/Sub-region
- 11.1.1 United States
- 11.1.2 Canada
- 11.1.3 Mexico
- 12. Europe In-Pipe Hydro Systems Market Analysis, Insights and Forecast, 2019-2031
- 12.1. Market Analysis, Insights and Forecast - By Country/Sub-region
- 12.1.1 Germany
- 12.1.2 United Kingdom
- 12.1.3 France
- 12.1.4 Spain
- 12.1.5 Italy
- 12.1.6 Spain
- 12.1.7 Belgium
- 12.1.8 Netherland
- 12.1.9 Nordics
- 12.1.10 Rest of Europe
- 13. Asia Pacific In-Pipe Hydro Systems Market Analysis, Insights and Forecast, 2019-2031
- 13.1. Market Analysis, Insights and Forecast - By Country/Sub-region
- 13.1.1 China
- 13.1.2 Japan
- 13.1.3 India
- 13.1.4 South Korea
- 13.1.5 Southeast Asia
- 13.1.6 Australia
- 13.1.7 Indonesia
- 13.1.8 Phillipes
- 13.1.9 Singapore
- 13.1.10 Thailandc
- 13.1.11 Rest of Asia Pacific
- 14. South America In-Pipe Hydro Systems Market Analysis, Insights and Forecast, 2019-2031
- 14.1. Market Analysis, Insights and Forecast - By Country/Sub-region
- 14.1.1 Brazil
- 14.1.2 Argentina
- 14.1.3 Peru
- 14.1.4 Chile
- 14.1.5 Colombia
- 14.1.6 Ecuador
- 14.1.7 Venezuela
- 14.1.8 Rest of South America
- 15. MEA In-Pipe Hydro Systems Market Analysis, Insights and Forecast, 2019-2031
- 15.1. Market Analysis, Insights and Forecast - By Country/Sub-region
- 15.1.1 United Arab Emirates
- 15.1.2 Saudi Arabia
- 15.1.3 South Africa
- 15.1.4 Rest of Middle East and Africa
- 16. Competitive Analysis
- 16.1. Global Market Share Analysis 2024
- 16.2. Company Profiles
- 16.2.1 Natel Energy
- 16.2.1.1. Overview
- 16.2.1.2. Products
- 16.2.1.3. SWOT Analysis
- 16.2.1.4. Recent Developments
- 16.2.1.5. Financials (Based on Availability)
- 16.2.2 Leviathan Energy
- 16.2.2.1. Overview
- 16.2.2.2. Products
- 16.2.2.3. SWOT Analysis
- 16.2.2.4. Recent Developments
- 16.2.2.5. Financials (Based on Availability)
- 16.2.3 Tecnoturbines SL
- 16.2.3.1. Overview
- 16.2.3.2. Products
- 16.2.3.3. SWOT Analysis
- 16.2.3.4. Recent Developments
- 16.2.3.5. Financials (Based on Availability)
- 16.2.4 Xinda Green Energy Co Limited
- 16.2.4.1. Overview
- 16.2.4.2. Products
- 16.2.4.3. SWOT Analysis
- 16.2.4.4. Recent Developments
- 16.2.4.5. Financials (Based on Availability)
- 16.2.5 InPipe Energy
- 16.2.5.1. Overview
- 16.2.5.2. Products
- 16.2.5.3. SWOT Analysis
- 16.2.5.4. Recent Developments
- 16.2.5.5. Financials (Based on Availability)
- 16.2.6 HS Dynamic Energy Co Ltd
- 16.2.6.1. Overview
- 16.2.6.2. Products
- 16.2.6.3. SWOT Analysis
- 16.2.6.4. Recent Developments
- 16.2.6.5. Financials (Based on Availability)
- 16.2.7 GS-Hydro
- 16.2.7.1. Overview
- 16.2.7.2. Products
- 16.2.7.3. SWOT Analysis
- 16.2.7.4. Recent Developments
- 16.2.7.5. Financials (Based on Availability)
- 16.2.8 Rentricity Inc
- 16.2.8.1. Overview
- 16.2.8.2. Products
- 16.2.8.3. SWOT Analysis
- 16.2.8.4. Recent Developments
- 16.2.8.5. Financials (Based on Availability)
- 16.2.9 Lucid Energy Inc
- 16.2.9.1. Overview
- 16.2.9.2. Products
- 16.2.9.3. SWOT Analysis
- 16.2.9.4. Recent Developments
- 16.2.9.5. Financials (Based on Availability)
- 16.2.1 Natel Energy
List of Figures
- Figure 1: Global In-Pipe Hydro Systems Market Revenue Breakdown (Million, %) by Region 2024 & 2032
- Figure 2: North America In-Pipe Hydro Systems Market Revenue (Million), by Country 2024 & 2032
- Figure 3: North America In-Pipe Hydro Systems Market Revenue Share (%), by Country 2024 & 2032
- Figure 4: Europe In-Pipe Hydro Systems Market Revenue (Million), by Country 2024 & 2032
- Figure 5: Europe In-Pipe Hydro Systems Market Revenue Share (%), by Country 2024 & 2032
- Figure 6: Asia Pacific In-Pipe Hydro Systems Market Revenue (Million), by Country 2024 & 2032
- Figure 7: Asia Pacific In-Pipe Hydro Systems Market Revenue Share (%), by Country 2024 & 2032
- Figure 8: South America In-Pipe Hydro Systems Market Revenue (Million), by Country 2024 & 2032
- Figure 9: South America In-Pipe Hydro Systems Market Revenue Share (%), by Country 2024 & 2032
- Figure 10: MEA In-Pipe Hydro Systems Market Revenue (Million), by Country 2024 & 2032
- Figure 11: MEA In-Pipe Hydro Systems Market Revenue Share (%), by Country 2024 & 2032
- Figure 12: North America In-Pipe Hydro Systems Market Revenue (Million), by Application 2024 & 2032
- Figure 13: North America In-Pipe Hydro Systems Market Revenue Share (%), by Application 2024 & 2032
- Figure 14: North America In-Pipe Hydro Systems Market Revenue (Million), by Capacity 2024 & 2032
- Figure 15: North America In-Pipe Hydro Systems Market Revenue Share (%), by Capacity 2024 & 2032
- Figure 16: North America In-Pipe Hydro Systems Market Revenue (Million), by Country 2024 & 2032
- Figure 17: North America In-Pipe Hydro Systems Market Revenue Share (%), by Country 2024 & 2032
- Figure 18: Asia Pacific In-Pipe Hydro Systems Market Revenue (Million), by Application 2024 & 2032
- Figure 19: Asia Pacific In-Pipe Hydro Systems Market Revenue Share (%), by Application 2024 & 2032
- Figure 20: Asia Pacific In-Pipe Hydro Systems Market Revenue (Million), by Capacity 2024 & 2032
- Figure 21: Asia Pacific In-Pipe Hydro Systems Market Revenue Share (%), by Capacity 2024 & 2032
- Figure 22: Asia Pacific In-Pipe Hydro Systems Market Revenue (Million), by Country 2024 & 2032
- Figure 23: Asia Pacific In-Pipe Hydro Systems Market Revenue Share (%), by Country 2024 & 2032
- Figure 24: Europe In-Pipe Hydro Systems Market Revenue (Million), by Application 2024 & 2032
- Figure 25: Europe In-Pipe Hydro Systems Market Revenue Share (%), by Application 2024 & 2032
- Figure 26: Europe In-Pipe Hydro Systems Market Revenue (Million), by Capacity 2024 & 2032
- Figure 27: Europe In-Pipe Hydro Systems Market Revenue Share (%), by Capacity 2024 & 2032
- Figure 28: Europe In-Pipe Hydro Systems Market Revenue (Million), by Country 2024 & 2032
- Figure 29: Europe In-Pipe Hydro Systems Market Revenue Share (%), by Country 2024 & 2032
- Figure 30: South America In-Pipe Hydro Systems Market Revenue (Million), by Application 2024 & 2032
- Figure 31: South America In-Pipe Hydro Systems Market Revenue Share (%), by Application 2024 & 2032
- Figure 32: South America In-Pipe Hydro Systems Market Revenue (Million), by Capacity 2024 & 2032
- Figure 33: South America In-Pipe Hydro Systems Market Revenue Share (%), by Capacity 2024 & 2032
- Figure 34: South America In-Pipe Hydro Systems Market Revenue (Million), by Country 2024 & 2032
- Figure 35: South America In-Pipe Hydro Systems Market Revenue Share (%), by Country 2024 & 2032
- Figure 36: Middle East and Africa In-Pipe Hydro Systems Market Revenue (Million), by Application 2024 & 2032
- Figure 37: Middle East and Africa In-Pipe Hydro Systems Market Revenue Share (%), by Application 2024 & 2032
- Figure 38: Middle East and Africa In-Pipe Hydro Systems Market Revenue (Million), by Capacity 2024 & 2032
- Figure 39: Middle East and Africa In-Pipe Hydro Systems Market Revenue Share (%), by Capacity 2024 & 2032
- Figure 40: Middle East and Africa In-Pipe Hydro Systems Market Revenue (Million), by Country 2024 & 2032
- Figure 41: Middle East and Africa In-Pipe Hydro Systems Market Revenue Share (%), by Country 2024 & 2032
List of Tables
- Table 1: Global In-Pipe Hydro Systems Market Revenue Million Forecast, by Region 2019 & 2032
- Table 2: Global In-Pipe Hydro Systems Market Revenue Million Forecast, by Application 2019 & 2032
- Table 3: Global In-Pipe Hydro Systems Market Revenue Million Forecast, by Capacity 2019 & 2032
- Table 4: Global In-Pipe Hydro Systems Market Revenue Million Forecast, by Region 2019 & 2032
- Table 5: Global In-Pipe Hydro Systems Market Revenue Million Forecast, by Country 2019 & 2032
- Table 6: United States In-Pipe Hydro Systems Market Revenue (Million) Forecast, by Application 2019 & 2032
- Table 7: Canada In-Pipe Hydro Systems Market Revenue (Million) Forecast, by Application 2019 & 2032
- Table 8: Mexico In-Pipe Hydro Systems Market Revenue (Million) Forecast, by Application 2019 & 2032
- Table 9: Global In-Pipe Hydro Systems Market Revenue Million Forecast, by Country 2019 & 2032
- Table 10: Germany In-Pipe Hydro Systems Market Revenue (Million) Forecast, by Application 2019 & 2032
- Table 11: United Kingdom In-Pipe Hydro Systems Market Revenue (Million) Forecast, by Application 2019 & 2032
- Table 12: France In-Pipe Hydro Systems Market Revenue (Million) Forecast, by Application 2019 & 2032
- Table 13: Spain In-Pipe Hydro Systems Market Revenue (Million) Forecast, by Application 2019 & 2032
- Table 14: Italy In-Pipe Hydro Systems Market Revenue (Million) Forecast, by Application 2019 & 2032
- Table 15: Spain In-Pipe Hydro Systems Market Revenue (Million) Forecast, by Application 2019 & 2032
- Table 16: Belgium In-Pipe Hydro Systems Market Revenue (Million) Forecast, by Application 2019 & 2032
- Table 17: Netherland In-Pipe Hydro Systems Market Revenue (Million) Forecast, by Application 2019 & 2032
- Table 18: Nordics In-Pipe Hydro Systems Market Revenue (Million) Forecast, by Application 2019 & 2032
- Table 19: Rest of Europe In-Pipe Hydro Systems Market Revenue (Million) Forecast, by Application 2019 & 2032
- Table 20: Global In-Pipe Hydro Systems Market Revenue Million Forecast, by Country 2019 & 2032
- Table 21: China In-Pipe Hydro Systems Market Revenue (Million) Forecast, by Application 2019 & 2032
- Table 22: Japan In-Pipe Hydro Systems Market Revenue (Million) Forecast, by Application 2019 & 2032
- Table 23: India In-Pipe Hydro Systems Market Revenue (Million) Forecast, by Application 2019 & 2032
- Table 24: South Korea In-Pipe Hydro Systems Market Revenue (Million) Forecast, by Application 2019 & 2032
- Table 25: Southeast Asia In-Pipe Hydro Systems Market Revenue (Million) Forecast, by Application 2019 & 2032
- Table 26: Australia In-Pipe Hydro Systems Market Revenue (Million) Forecast, by Application 2019 & 2032
- Table 27: Indonesia In-Pipe Hydro Systems Market Revenue (Million) Forecast, by Application 2019 & 2032
- Table 28: Phillipes In-Pipe Hydro Systems Market Revenue (Million) Forecast, by Application 2019 & 2032
- Table 29: Singapore In-Pipe Hydro Systems Market Revenue (Million) Forecast, by Application 2019 & 2032
- Table 30: Thailandc In-Pipe Hydro Systems Market Revenue (Million) Forecast, by Application 2019 & 2032
- Table 31: Rest of Asia Pacific In-Pipe Hydro Systems Market Revenue (Million) Forecast, by Application 2019 & 2032
- Table 32: Global In-Pipe Hydro Systems Market Revenue Million Forecast, by Country 2019 & 2032
- Table 33: Brazil In-Pipe Hydro Systems Market Revenue (Million) Forecast, by Application 2019 & 2032
- Table 34: Argentina In-Pipe Hydro Systems Market Revenue (Million) Forecast, by Application 2019 & 2032
- Table 35: Peru In-Pipe Hydro Systems Market Revenue (Million) Forecast, by Application 2019 & 2032
- Table 36: Chile In-Pipe Hydro Systems Market Revenue (Million) Forecast, by Application 2019 & 2032
- Table 37: Colombia In-Pipe Hydro Systems Market Revenue (Million) Forecast, by Application 2019 & 2032
- Table 38: Ecuador In-Pipe Hydro Systems Market Revenue (Million) Forecast, by Application 2019 & 2032
- Table 39: Venezuela In-Pipe Hydro Systems Market Revenue (Million) Forecast, by Application 2019 & 2032
- Table 40: Rest of South America In-Pipe Hydro Systems Market Revenue (Million) Forecast, by Application 2019 & 2032
- Table 41: Global In-Pipe Hydro Systems Market Revenue Million Forecast, by Country 2019 & 2032
- Table 42: United Arab Emirates In-Pipe Hydro Systems Market Revenue (Million) Forecast, by Application 2019 & 2032
- Table 43: Saudi Arabia In-Pipe Hydro Systems Market Revenue (Million) Forecast, by Application 2019 & 2032
- Table 44: South Africa In-Pipe Hydro Systems Market Revenue (Million) Forecast, by Application 2019 & 2032
- Table 45: Rest of Middle East and Africa In-Pipe Hydro Systems Market Revenue (Million) Forecast, by Application 2019 & 2032
- Table 46: Global In-Pipe Hydro Systems Market Revenue Million Forecast, by Application 2019 & 2032
- Table 47: Global In-Pipe Hydro Systems Market Revenue Million Forecast, by Capacity 2019 & 2032
- Table 48: Global In-Pipe Hydro Systems Market Revenue Million Forecast, by Country 2019 & 2032
- Table 49: United States In-Pipe Hydro Systems Market Revenue (Million) Forecast, by Application 2019 & 2032
- Table 50: Canada In-Pipe Hydro Systems Market Revenue (Million) Forecast, by Application 2019 & 2032
- Table 51: Rest of North America In-Pipe Hydro Systems Market Revenue (Million) Forecast, by Application 2019 & 2032
- Table 52: Global In-Pipe Hydro Systems Market Revenue Million Forecast, by Application 2019 & 2032
- Table 53: Global In-Pipe Hydro Systems Market Revenue Million Forecast, by Capacity 2019 & 2032
- Table 54: Global In-Pipe Hydro Systems Market Revenue Million Forecast, by Country 2019 & 2032
- Table 55: China In-Pipe Hydro Systems Market Revenue (Million) Forecast, by Application 2019 & 2032
- Table 56: Japan In-Pipe Hydro Systems Market Revenue (Million) Forecast, by Application 2019 & 2032
- Table 57: South Korea In-Pipe Hydro Systems Market Revenue (Million) Forecast, by Application 2019 & 2032
- Table 58: India In-Pipe Hydro Systems Market Revenue (Million) Forecast, by Application 2019 & 2032
- Table 59: Malaysia In-Pipe Hydro Systems Market Revenue (Million) Forecast, by Application 2019 & 2032
- Table 60: Thailand In-Pipe Hydro Systems Market Revenue (Million) Forecast, by Application 2019 & 2032
- Table 61: Indonesia In-Pipe Hydro Systems Market Revenue (Million) Forecast, by Application 2019 & 2032
- Table 62: Vietnam In-Pipe Hydro Systems Market Revenue (Million) Forecast, by Application 2019 & 2032
- Table 63: Rest of Asia Pacific In-Pipe Hydro Systems Market Revenue (Million) Forecast, by Application 2019 & 2032
- Table 64: Global In-Pipe Hydro Systems Market Revenue Million Forecast, by Application 2019 & 2032
- Table 65: Global In-Pipe Hydro Systems Market Revenue Million Forecast, by Capacity 2019 & 2032
- Table 66: Global In-Pipe Hydro Systems Market Revenue Million Forecast, by Country 2019 & 2032
- Table 67: United Kingdom In-Pipe Hydro Systems Market Revenue (Million) Forecast, by Application 2019 & 2032
- Table 68: Germany In-Pipe Hydro Systems Market Revenue (Million) Forecast, by Application 2019 & 2032
- Table 69: France In-Pipe Hydro Systems Market Revenue (Million) Forecast, by Application 2019 & 2032
- Table 70: Italy In-Pipe Hydro Systems Market Revenue (Million) Forecast, by Application 2019 & 2032
- Table 71: Spain In-Pipe Hydro Systems Market Revenue (Million) Forecast, by Application 2019 & 2032
- Table 72: Nordic Countries In-Pipe Hydro Systems Market Revenue (Million) Forecast, by Application 2019 & 2032
- Table 73: Turkey In-Pipe Hydro Systems Market Revenue (Million) Forecast, by Application 2019 & 2032
- Table 74: Russia In-Pipe Hydro Systems Market Revenue (Million) Forecast, by Application 2019 & 2032
- Table 75: Rest of Europe In-Pipe Hydro Systems Market Revenue (Million) Forecast, by Application 2019 & 2032
- Table 76: Global In-Pipe Hydro Systems Market Revenue Million Forecast, by Application 2019 & 2032
- Table 77: Global In-Pipe Hydro Systems Market Revenue Million Forecast, by Capacity 2019 & 2032
- Table 78: Global In-Pipe Hydro Systems Market Revenue Million Forecast, by Country 2019 & 2032
- Table 79: Brazil In-Pipe Hydro Systems Market Revenue (Million) Forecast, by Application 2019 & 2032
- Table 80: Argentina In-Pipe Hydro Systems Market Revenue (Million) Forecast, by Application 2019 & 2032
- Table 81: Colombia In-Pipe Hydro Systems Market Revenue (Million) Forecast, by Application 2019 & 2032
- Table 82: Rest of South America In-Pipe Hydro Systems Market Revenue (Million) Forecast, by Application 2019 & 2032
- Table 83: Global In-Pipe Hydro Systems Market Revenue Million Forecast, by Application 2019 & 2032
- Table 84: Global In-Pipe Hydro Systems Market Revenue Million Forecast, by Capacity 2019 & 2032
- Table 85: Global In-Pipe Hydro Systems Market Revenue Million Forecast, by Country 2019 & 2032
- Table 86: Saudi Arabia In-Pipe Hydro Systems Market Revenue (Million) Forecast, by Application 2019 & 2032
- Table 87: United Arab Emirates In-Pipe Hydro Systems Market Revenue (Million) Forecast, by Application 2019 & 2032
- Table 88: Nigeria In-Pipe Hydro Systems Market Revenue (Million) Forecast, by Application 2019 & 2032
- Table 89: Qatar In-Pipe Hydro Systems Market Revenue (Million) Forecast, by Application 2019 & 2032
- Table 90: Egypt In-Pipe Hydro Systems Market Revenue (Million) Forecast, by Application 2019 & 2032
- Table 91: Rest of Middle East and Africa In-Pipe Hydro Systems Market Revenue (Million) Forecast, by Application 2019 & 2032
Frequently Asked Questions
1. What is the projected Compound Annual Growth Rate (CAGR) of the In-Pipe Hydro Systems Market?
The projected CAGR is approximately 3.87%.
2. Which companies are prominent players in the In-Pipe Hydro Systems Market?
Key companies in the market include Natel Energy, Leviathan Energy, Tecnoturbines SL, Xinda Green Energy Co Limited, InPipe Energy, HS Dynamic Energy Co Ltd, GS-Hydro, Rentricity Inc, Lucid Energy Inc.
3. What are the main segments of the In-Pipe Hydro Systems Market?
The market segments include Application, Capacity.
4. Can you provide details about the market size?
The market size is estimated to be USD 109.34 Million as of 2022.
5. What are some drivers contributing to market growth?
Increased Focus on Renewable Power Generation4.; Rising Need for Efficient Power Generation.
6. What are the notable trends driving market growth?
Industrial Water Systems to Witness Significant Demand.
7. Are there any restraints impacting market growth?
High Initial Capital Investment.
8. Can you provide examples of recent developments in the market?
December 2023: The East Bay Municipal Utility District (EBMUD) partnered with InPipe Energy to generate electricity from the flow of water in its water distribution system. According to a release, this is the first installation of the InPipe technology in California. The new in-conduit hydroelectric system works similarly to traditional pressure-regulating valves in EBMUD’s water distribution system. However, it uses a turbine to reduce water pressure while generating electricity and creating a reliable, clean source of power.
9. What pricing options are available for accessing the report?
Pricing options include single-user, multi-user, and enterprise licenses priced at USD 4750, USD 5250, and USD 8750 respectively.
10. Is the market size provided in terms of value or volume?
The market size is provided in terms of value, measured in Million.
11. Are there any specific market keywords associated with the report?
Yes, the market keyword associated with the report is "In-Pipe Hydro Systems Market," which aids in identifying and referencing the specific market segment covered.
12. How do I determine which pricing option suits my needs best?
The pricing options vary based on user requirements and access needs. Individual users may opt for single-user licenses, while businesses requiring broader access may choose multi-user or enterprise licenses for cost-effective access to the report.
13. Are there any additional resources or data provided in the In-Pipe Hydro Systems Market report?
While the report offers comprehensive insights, it's advisable to review the specific contents or supplementary materials provided to ascertain if additional resources or data are available.
14. How can I stay updated on further developments or reports in the In-Pipe Hydro Systems Market?
To stay informed about further developments, trends, and reports in the In-Pipe Hydro Systems Market, consider subscribing to industry newsletters, following relevant companies and organizations, or regularly checking reputable industry news sources and publications.
Methodology
Step 1 - Identification of Relevant Samples Size from Population Database


Step 2 - Approaches for Defining Global Market Size (Value, Volume* & Price*)

Note*: In applicable scenarios
Step 3 - Data Sources
Primary Research
- Web Analytics
- Survey Reports
- Research Institute
- Latest Research Reports
- Opinion Leaders
Secondary Research
- Annual Reports
- White Paper
- Latest Press Release
- Industry Association
- Paid Database
- Investor Presentations

Step 4 - Data Triangulation
Involves using different sources of information in order to increase the validity of a study
These sources are likely to be stakeholders in a program - participants, other researchers, program staff, other community members, and so on.
Then we put all data in single framework & apply various statistical tools to find out the dynamic on the market.
During the analysis stage, feedback from the stakeholder groups would be compared to determine areas of agreement as well as areas of divergence


