
Key Insights
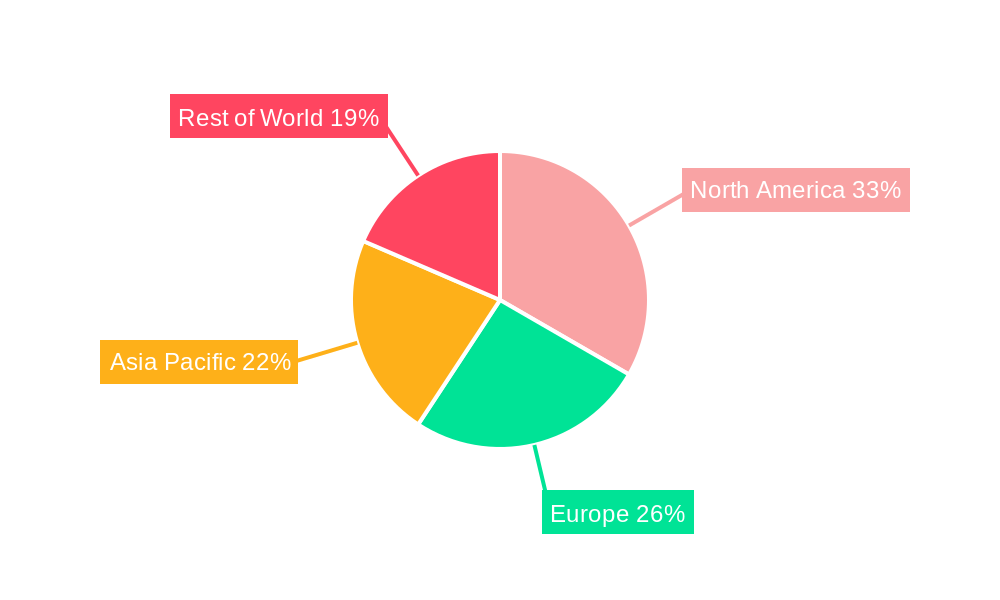
The induced pluripotent stem cell (iPSC) therapy market is experiencing robust growth, projected to reach $1.35 billion in 2025 and exhibiting a Compound Annual Growth Rate (CAGR) of 10.10% from 2025 to 2033. This expansion is driven by several key factors. Firstly, the increasing prevalence of chronic diseases like diabetes and neurodegenerative disorders fuels the demand for novel therapeutic approaches. iPSCs offer a revolutionary solution by enabling the generation of patient-specific cells for transplantation and disease modeling, paving the way for personalized medicine. Secondly, advancements in iPSC technology, including improved cell differentiation protocols and enhanced safety profiles, are accelerating clinical translation and market adoption. Thirdly, significant investments from both public and private sectors are fueling research and development, leading to the emergence of numerous promising clinical trials and potential therapies. The segment analysis reveals that drug development and regenerative medicine are currently the largest application areas, while research institutions constitute the primary end-user segment. However, the growing interest in cell therapy and tissue engineering is expected to broaden the application scope in the coming years. Geographic distribution indicates a strong presence in North America and Europe, driven by robust healthcare infrastructure and advanced research capabilities; however, the Asia-Pacific region presents significant growth opportunities given the increasing investment in biotechnology and healthcare.
The market's restraints primarily include the high cost associated with iPSC-based therapies, the lengthy regulatory approval processes, and potential challenges related to immune rejection and tumorigenicity. However, ongoing research and technological improvements are addressing these limitations. Companies like Cynata Therapeutics, FUJIFILM Cellular Dynamics, and Axol Bioscience are at the forefront of innovation, driving competition and further propelling market growth. The diverse cell types derived from iPSCs, including hepatocytes, fibroblasts, keratinocytes, and neurons, expand the therapeutic potential across various disease areas, ensuring a sustained and expanding market in the long term. The forecast period of 2025-2033 anticipates a significant increase in market value, fueled by a confluence of technological advancements, favorable regulatory landscapes, and growing patient populations in need of innovative treatment options.

Induced Pluripotent Stem Cell Therapy Industry: A Comprehensive Market Report (2019-2033)
This comprehensive report provides a detailed analysis of the Induced Pluripotent Stem Cell (iPSC) Therapy industry, covering market size, growth drivers, challenges, key players, and future outlook. The report utilizes data from the historical period (2019-2024), base year (2025), and projects the market through the forecast period (2025-2033). The study period is 2019-2033, with an estimated year of 2025. This report is essential for industry stakeholders, investors, and researchers seeking a thorough understanding of this rapidly evolving field.
Induced Pluripotent Stem Cell Therapy Industry Market Concentration & Innovation
The iPSC therapy market is characterized by a moderately concentrated landscape with several key players driving innovation. While a few large companies hold significant market share, a number of smaller, specialized firms are actively contributing to technological advancements. Market share data for 2024 indicates that the top five companies hold approximately xx% of the market, while the remaining xx% is distributed across numerous smaller players. Mergers and acquisitions (M&A) activity has been steadily increasing, with total deal values exceeding $xx Million in the past three years. Key factors driving innovation include advancements in cell reprogramming techniques, improved differentiation protocols, and the development of novel biomaterials for cell delivery and integration. Regulatory frameworks, such as those set by the FDA and EMA, play a significant role in shaping product development and market entry strategies. The existence of alternative therapies, such as traditional cell-based therapies and small molecule drugs, presents a competitive pressure, requiring iPSC-based therapies to demonstrate superior efficacy and safety. End-user trends show an increasing demand for iPSC-derived cell types for various applications, particularly in drug development and regenerative medicine.
- Market Concentration: Top 5 companies hold approximately xx% of market share in 2024.
- M&A Activity: Total deal value exceeding $xx Million over the past three years.
- Innovation Drivers: Advancements in cell reprogramming, differentiation protocols, and biomaterials.
- Regulatory Frameworks: Significant influence on product development and market entry.
- Product Substitutes: Traditional cell-based therapies and small molecule drugs.
- End-User Trends: Increasing demand for iPSC-derived cells in drug development and regenerative medicine.
Induced Pluripotent Stem Cell Therapy Industry Industry Trends & Insights
The iPSC therapy market is experiencing substantial growth, driven by a confluence of factors. The global market is projected to reach $xx Million by 2033, exhibiting a compound annual growth rate (CAGR) of xx% during the forecast period. This robust growth is fueled by the increasing prevalence of chronic diseases requiring innovative treatment options, coupled with advancements in iPSC technology enabling the creation of disease-specific models and therapies. Technological disruptions, such as the development of automated cell culture systems and high-throughput screening platforms, are improving efficiency and scalability, reducing costs, and accelerating drug discovery. Consumer preferences are shifting towards personalized medicine, with iPSC therapies offering the potential for tailored treatments based on an individual's genetic makeup. The competitive dynamics are characterized by intense R&D efforts, strategic alliances, and an increasing number of clinical trials evaluating the efficacy and safety of iPSC-based therapies. Market penetration is increasing steadily, particularly in developed countries with robust regulatory frameworks and well-established healthcare infrastructure. The market penetration rate is expected to increase from xx% in 2025 to xx% by 2033.

Dominant Markets & Segments in Induced Pluripotent Stem Cell Therapy Industry
The global induced pluripotent stem cell (iPSC) therapy market is experiencing significant growth, driven by advancements in cell culture technology, gene editing tools, and a rising understanding of disease mechanisms. North America currently holds the largest market share, fueled by substantial research and development investment, a robust healthcare infrastructure, and the early adoption of innovative therapies. The United States, in particular, plays a dominant role, contributing significantly to the global market value. This market leadership is further solidified by several key segments.
Derived Cell Type: The market is segmented by the specific cell type derived from iPSCs, each with unique applications and market drivers:
- Hepatocytes: High demand stems from their crucial role in drug toxicity testing and disease modeling for liver conditions, making this segment a significant contributor to market growth.
- Fibroblasts: Widely utilized in regenerative medicine and drug development, fibroblasts represent a substantial market segment due to their versatility and established applications.
- Neurons: The increasing prevalence of neurodegenerative diseases globally is fueling significant demand for neuronal iPSCs in research and drug discovery, positioning this segment for strong growth.
- Cardiomyocytes: The use of cardiomyocytes derived from iPSCs is rapidly expanding in cardiac disease modeling and drug screening, representing a fast-growing segment of the market.
- Others: Other cell types, such as keratinocytes and pancreatic islet cells, contribute to a growing, though currently smaller, segment of the market, with potential for future expansion.
Application: The application of iPSC-derived cells further segments the market:
- Drug Development & Disease Modeling: iPSCs' ability to accurately model human diseases drives substantial market share in this segment, enabling efficient preclinical testing and personalized medicine approaches.
- Regenerative Medicine: The growing prevalence of chronic diseases and the increasing demand for personalized, regenerative therapies contribute to significant growth in this segment. This includes applications in cell replacement therapy and tissue engineering.
- Toxicity Testing: The ethical and scientific advantages of replacing animal models with human-based iPSC models for toxicity testing are accelerating the adoption of this application and its market share.
End User: The end-users driving market demand include:
- Research Institutions: Academic research centers and universities represent the largest segment, engaged in fundamental research, drug discovery, and translational studies.
- Pharmaceutical & Biotechnology Companies: These entities are heavily invested in utilizing iPSC technology for drug development, personalized medicine, and novel therapeutic approaches, representing a rapidly growing segment.
- Hospitals & Clinics: The increasing availability of iPSC-based therapies is leading to their integration into clinical settings for specific treatment applications.
Key Drivers: Government funding for stem cell research, increased private sector investment, a robust intellectual property ecosystem, and the growing adoption of advanced technologies like CRISPR-Cas9 and AI are key drivers shaping the North American market leadership and global market growth.
Induced Pluripotent Stem Cell Therapy Industry Product Developments
Recent advancements significantly enhance the therapeutic potential of iPSCs. Improved protocols for iPSC generation and differentiation result in more consistent and homogenous cell populations suitable for clinical translation. The integration of gene-editing tools, such as CRISPR-Cas9, allows for the correction of genetic defects, paving the way for personalized cell therapies targeting a wider range of diseases. Furthermore, the development of novel biomaterials for efficient cell delivery and improved integration within host tissues is overcoming critical challenges previously hindering widespread adoption. These innovations are addressing concerns regarding reproducibility, cost-effectiveness, and efficacy, thereby accelerating market growth and expansion.
Report Scope & Segmentation Analysis
This report provides a comprehensive analysis of the iPSC therapy market, segmented by derived cell type, application, and end-user. Each segment is analyzed based on market size, growth projections (including compound annual growth rates - CAGRs where applicable), and competitive landscape. Detailed insights are provided into the factors influencing market dynamics, including technological advancements, regulatory landscape, and market trends. Specific projections for each segment, including Hepatocytes' projected growth driven by drug discovery, will be provided within the full report. Further segmentation, such as by geographic region, will also be included to provide a complete view of the global market.
Key Drivers of Induced Pluripotent Stem Cell Therapy Industry Growth
Several key factors drive the growth of the iPSC therapy market: rising prevalence of chronic diseases, increasing demand for personalized medicine, technological advancements enabling more efficient and cost-effective cell production, and supportive government regulations. Growing investments in R&D from both public and private sources are fostering innovation and accelerating clinical trials. Increased awareness among patients and healthcare professionals regarding the potential benefits of iPSC-based therapies is also driving growth.
Challenges in the Induced Pluripotent Stem Cell Therapy Industry Sector
Despite its immense potential, the iPSC therapy market faces substantial hurdles. High production costs, stringent regulatory pathways leading to lengthy drug approval processes, and the potential for immune rejection remain significant obstacles. The need for highly skilled personnel and specialized infrastructure increases barriers to entry and limits market expansion. Addressing ethical considerations and ensuring equitable access to these potentially life-changing therapies are also crucial for responsible market development. These combined challenges contribute to higher treatment costs and extended development timelines compared to more established therapies.
Emerging Opportunities in Induced Pluripotent Stem Cell Therapy Industry
The iPSC therapy field presents significant future opportunities. The development of novel iPSC-derived cell types for treating rare diseases offers a promising avenue for therapeutic innovation. The integration of iPSC technology with precision medicine approaches enables the creation of highly targeted therapies tailored to individual patient needs. Advancements in bioprinting and sophisticated delivery systems allow for more precise and effective cell transplantation. The application of artificial intelligence (AI) and machine learning is enhancing the efficiency and accuracy of cell characterization, drug discovery, and predictive modeling. Finally, expanding into new geographic markets with supportive regulatory environments and increasing investment will further fuel market expansion and create new growth opportunities.
Leading Players in the Induced Pluripotent Stem Cell Therapy Industry Market
- Cynata Therapeutics Limited
- FUJIFILM Cellular Dynamics Inc
- Axol Bioscience Ltd
- Thermo Fisher Scientific Inc
- Takara Bio Inc
- REPROCELL USA Inc
- LizarBio Therapeutics (Pluricell Biotech)
- Fate Therapeutics Inc
- Sumitomo Dainippon Pharma Co Ltd
- Ncardia
- ViaCyte Inc
- Evotec SE
Key Developments in Induced Pluripotent Stem Cell Therapy Industry Industry
- November 2022: Prepaire Labs signed a 5-year agreement with Ncardia to accelerate drug discovery and development, impacting the market by fostering collaborations and advancing iPSC applications.
- October 2022: CiRA Foundation and the Cell and Gene Therapy Catapult launched a collaborative research initiative focused on iPS cell characterization, promoting further development and refinement of iPSC technologies.
Strategic Outlook for Induced Pluripotent Stem Cell Therapy Market
The iPSC therapy market is poised for significant growth, driven by technological advancements, increasing investments in R&D, and the expanding clinical application of these therapies. Future opportunities lie in developing more efficient and cost-effective production methods, exploring novel applications in various disease areas, and addressing the regulatory challenges hindering market entry. The potential to personalize treatments based on an individual's genetic profile will be a key driver of future market expansion.
Induced Pluripotent Stem Cell Therapy Industry Segmentation
-
1. Derived Cell Type
- 1.1. Hepatocytes
- 1.2. Fibroblasts
- 1.3. Keratinocytes
- 1.4. Neurons
- 1.5. Others
-
2. Application
- 2.1. Drug Development
- 2.2. Regenerative Medicine
- 2.3. Toxicity Testing
- 2.4. Tissue Engineering
- 2.5. Cell Therapy
- 2.6. Disease Modeling
-
3. End User
- 3.1. Research Institutions
- 3.2. Other End Users
Induced Pluripotent Stem Cell Therapy Industry Segmentation By Geography
-
1. North America
- 1.1. United States
- 1.2. Canada
- 1.3. Mexico
-
2. Europe
- 2.1. Germany
- 2.2. United Kingdom
- 2.3. France
- 2.4. Italy
- 2.5. Spain
- 2.6. Rest of Europe
-
3. Asia Pacific
- 3.1. China
- 3.2. Japan
- 3.3. India
- 3.4. Australia
- 3.5. South Korea
- 3.6. Rest of Asia Pacific
-
4. Middle East and Africa
- 4.1. GCC
- 4.2. South Africa
- 4.3. Rest of Middle East and Africa
-
5. South America
- 5.1. Brazil
- 5.2. Argentina
- 5.3. Rest of South America
Induced Pluripotent Stem Cell Therapy Industry REPORT HIGHLIGHTS
| Aspects | Details |
|---|---|
| Study Period | 2019-2033 |
| Base Year | 2024 |
| Estimated Year | 2025 |
| Forecast Period | 2025-2033 |
| Historical Period | 2019-2024 |
| Growth Rate | CAGR of 10.10% from 2019-2033 |
| Segmentation |
|
Table of Contents
- 1. Introduction
- 1.1. Research Scope
- 1.2. Market Segmentation
- 1.3. Research Methodology
- 1.4. Definitions and Assumptions
- 2. Executive Summary
- 2.1. Introduction
- 3. Market Dynamics
- 3.1. Introduction
- 3.2. Market Drivers
- 3.2.1. Increase in Research and Development Activities in Stem Cells Therapies; Surge in Adoption of Personalized Medicine
- 3.3. Market Restrains
- 3.3.1. Lack of Awareness Regarding Stem Cell Therapies and High Cost of Treatment
- 3.4. Market Trends
- 3.4.1. Regenerative Medicine Segment is Expected to Witness Significant Growth Over the Forecast Period
- 4. Market Factor Analysis
- 4.1. Porters Five Forces
- 4.2. Supply/Value Chain
- 4.3. PESTEL analysis
- 4.4. Market Entropy
- 4.5. Patent/Trademark Analysis
- 5. Global Induced Pluripotent Stem Cell Therapy Industry Analysis, Insights and Forecast, 2019-2031
- 5.1. Market Analysis, Insights and Forecast - by Derived Cell Type
- 5.1.1. Hepatocytes
- 5.1.2. Fibroblasts
- 5.1.3. Keratinocytes
- 5.1.4. Neurons
- 5.1.5. Others
- 5.2. Market Analysis, Insights and Forecast - by Application
- 5.2.1. Drug Development
- 5.2.2. Regenerative Medicine
- 5.2.3. Toxicity Testing
- 5.2.4. Tissue Engineering
- 5.2.5. Cell Therapy
- 5.2.6. Disease Modeling
- 5.3. Market Analysis, Insights and Forecast - by End User
- 5.3.1. Research Institutions
- 5.3.2. Other End Users
- 5.4. Market Analysis, Insights and Forecast - by Region
- 5.4.1. North America
- 5.4.2. Europe
- 5.4.3. Asia Pacific
- 5.4.4. Middle East and Africa
- 5.4.5. South America
- 5.1. Market Analysis, Insights and Forecast - by Derived Cell Type
- 6. North America Induced Pluripotent Stem Cell Therapy Industry Analysis, Insights and Forecast, 2019-2031
- 6.1. Market Analysis, Insights and Forecast - by Derived Cell Type
- 6.1.1. Hepatocytes
- 6.1.2. Fibroblasts
- 6.1.3. Keratinocytes
- 6.1.4. Neurons
- 6.1.5. Others
- 6.2. Market Analysis, Insights and Forecast - by Application
- 6.2.1. Drug Development
- 6.2.2. Regenerative Medicine
- 6.2.3. Toxicity Testing
- 6.2.4. Tissue Engineering
- 6.2.5. Cell Therapy
- 6.2.6. Disease Modeling
- 6.3. Market Analysis, Insights and Forecast - by End User
- 6.3.1. Research Institutions
- 6.3.2. Other End Users
- 6.1. Market Analysis, Insights and Forecast - by Derived Cell Type
- 7. Europe Induced Pluripotent Stem Cell Therapy Industry Analysis, Insights and Forecast, 2019-2031
- 7.1. Market Analysis, Insights and Forecast - by Derived Cell Type
- 7.1.1. Hepatocytes
- 7.1.2. Fibroblasts
- 7.1.3. Keratinocytes
- 7.1.4. Neurons
- 7.1.5. Others
- 7.2. Market Analysis, Insights and Forecast - by Application
- 7.2.1. Drug Development
- 7.2.2. Regenerative Medicine
- 7.2.3. Toxicity Testing
- 7.2.4. Tissue Engineering
- 7.2.5. Cell Therapy
- 7.2.6. Disease Modeling
- 7.3. Market Analysis, Insights and Forecast - by End User
- 7.3.1. Research Institutions
- 7.3.2. Other End Users
- 7.1. Market Analysis, Insights and Forecast - by Derived Cell Type
- 8. Asia Pacific Induced Pluripotent Stem Cell Therapy Industry Analysis, Insights and Forecast, 2019-2031
- 8.1. Market Analysis, Insights and Forecast - by Derived Cell Type
- 8.1.1. Hepatocytes
- 8.1.2. Fibroblasts
- 8.1.3. Keratinocytes
- 8.1.4. Neurons
- 8.1.5. Others
- 8.2. Market Analysis, Insights and Forecast - by Application
- 8.2.1. Drug Development
- 8.2.2. Regenerative Medicine
- 8.2.3. Toxicity Testing
- 8.2.4. Tissue Engineering
- 8.2.5. Cell Therapy
- 8.2.6. Disease Modeling
- 8.3. Market Analysis, Insights and Forecast - by End User
- 8.3.1. Research Institutions
- 8.3.2. Other End Users
- 8.1. Market Analysis, Insights and Forecast - by Derived Cell Type
- 9. Middle East and Africa Induced Pluripotent Stem Cell Therapy Industry Analysis, Insights and Forecast, 2019-2031
- 9.1. Market Analysis, Insights and Forecast - by Derived Cell Type
- 9.1.1. Hepatocytes
- 9.1.2. Fibroblasts
- 9.1.3. Keratinocytes
- 9.1.4. Neurons
- 9.1.5. Others
- 9.2. Market Analysis, Insights and Forecast - by Application
- 9.2.1. Drug Development
- 9.2.2. Regenerative Medicine
- 9.2.3. Toxicity Testing
- 9.2.4. Tissue Engineering
- 9.2.5. Cell Therapy
- 9.2.6. Disease Modeling
- 9.3. Market Analysis, Insights and Forecast - by End User
- 9.3.1. Research Institutions
- 9.3.2. Other End Users
- 9.1. Market Analysis, Insights and Forecast - by Derived Cell Type
- 10. South America Induced Pluripotent Stem Cell Therapy Industry Analysis, Insights and Forecast, 2019-2031
- 10.1. Market Analysis, Insights and Forecast - by Derived Cell Type
- 10.1.1. Hepatocytes
- 10.1.2. Fibroblasts
- 10.1.3. Keratinocytes
- 10.1.4. Neurons
- 10.1.5. Others
- 10.2. Market Analysis, Insights and Forecast - by Application
- 10.2.1. Drug Development
- 10.2.2. Regenerative Medicine
- 10.2.3. Toxicity Testing
- 10.2.4. Tissue Engineering
- 10.2.5. Cell Therapy
- 10.2.6. Disease Modeling
- 10.3. Market Analysis, Insights and Forecast - by End User
- 10.3.1. Research Institutions
- 10.3.2. Other End Users
- 10.1. Market Analysis, Insights and Forecast - by Derived Cell Type
- 11. North America Induced Pluripotent Stem Cell Therapy Industry Analysis, Insights and Forecast, 2019-2031
- 11.1. Market Analysis, Insights and Forecast - By Country/Sub-region
- 11.1.1. undefined
- 12. Europe Induced Pluripotent Stem Cell Therapy Industry Analysis, Insights and Forecast, 2019-2031
- 12.1. Market Analysis, Insights and Forecast - By Country/Sub-region
- 12.1.1. undefined
- 13. Asia Pacific Induced Pluripotent Stem Cell Therapy Industry Analysis, Insights and Forecast, 2019-2031
- 13.1. Market Analysis, Insights and Forecast - By Country/Sub-region
- 13.1.1. undefined
- 14. Middle East and Africa Induced Pluripotent Stem Cell Therapy Industry Analysis, Insights and Forecast, 2019-2031
- 14.1. Market Analysis, Insights and Forecast - By Country/Sub-region
- 14.1.1. undefined
- 15. South America Induced Pluripotent Stem Cell Therapy Industry Analysis, Insights and Forecast, 2019-2031
- 15.1. Market Analysis, Insights and Forecast - By Country/Sub-region
- 15.1.1. undefined
- 16. Competitive Analysis
- 16.1. Global Market Share Analysis 2024
- 16.2. Company Profiles
- 16.2.1 Cynata Therapeutics Limited
- 16.2.1.1. Overview
- 16.2.1.2. Products
- 16.2.1.3. SWOT Analysis
- 16.2.1.4. Recent Developments
- 16.2.1.5. Financials (Based on Availability)
- 16.2.2 FUJIFILM Cellular Dynamics Inc
- 16.2.2.1. Overview
- 16.2.2.2. Products
- 16.2.2.3. SWOT Analysis
- 16.2.2.4. Recent Developments
- 16.2.2.5. Financials (Based on Availability)
- 16.2.3 Axol Bioscience Ltd
- 16.2.3.1. Overview
- 16.2.3.2. Products
- 16.2.3.3. SWOT Analysis
- 16.2.3.4. Recent Developments
- 16.2.3.5. Financials (Based on Availability)
- 16.2.4 Thermo Fisher Scientific Inc
- 16.2.4.1. Overview
- 16.2.4.2. Products
- 16.2.4.3. SWOT Analysis
- 16.2.4.4. Recent Developments
- 16.2.4.5. Financials (Based on Availability)
- 16.2.5 Takara Bio Inc
- 16.2.5.1. Overview
- 16.2.5.2. Products
- 16.2.5.3. SWOT Analysis
- 16.2.5.4. Recent Developments
- 16.2.5.5. Financials (Based on Availability)
- 16.2.6 REPROCELL USA Inc
- 16.2.6.1. Overview
- 16.2.6.2. Products
- 16.2.6.3. SWOT Analysis
- 16.2.6.4. Recent Developments
- 16.2.6.5. Financials (Based on Availability)
- 16.2.7 LizarBio Therapeutics (Pluricell Biotech)
- 16.2.7.1. Overview
- 16.2.7.2. Products
- 16.2.7.3. SWOT Analysis
- 16.2.7.4. Recent Developments
- 16.2.7.5. Financials (Based on Availability)
- 16.2.8 Fate Therapeutics Inc
- 16.2.8.1. Overview
- 16.2.8.2. Products
- 16.2.8.3. SWOT Analysis
- 16.2.8.4. Recent Developments
- 16.2.8.5. Financials (Based on Availability)
- 16.2.9 Sumitomo Dainippon Pharma Co Ltd
- 16.2.9.1. Overview
- 16.2.9.2. Products
- 16.2.9.3. SWOT Analysis
- 16.2.9.4. Recent Developments
- 16.2.9.5. Financials (Based on Availability)
- 16.2.10 Ncardia
- 16.2.10.1. Overview
- 16.2.10.2. Products
- 16.2.10.3. SWOT Analysis
- 16.2.10.4. Recent Developments
- 16.2.10.5. Financials (Based on Availability)
- 16.2.11 ViaCyte Inc
- 16.2.11.1. Overview
- 16.2.11.2. Products
- 16.2.11.3. SWOT Analysis
- 16.2.11.4. Recent Developments
- 16.2.11.5. Financials (Based on Availability)
- 16.2.12 Evotec SE
- 16.2.12.1. Overview
- 16.2.12.2. Products
- 16.2.12.3. SWOT Analysis
- 16.2.12.4. Recent Developments
- 16.2.12.5. Financials (Based on Availability)
- 16.2.1 Cynata Therapeutics Limited
List of Figures
- Figure 1: Global Induced Pluripotent Stem Cell Therapy Industry Revenue Breakdown (Million, %) by Region 2024 & 2032
- Figure 2: Global Induced Pluripotent Stem Cell Therapy Industry Volume Breakdown (K unit, %) by Region 2024 & 2032
- Figure 3: North America Induced Pluripotent Stem Cell Therapy Industry Revenue (Million), by Country 2024 & 2032
- Figure 4: North America Induced Pluripotent Stem Cell Therapy Industry Volume (K unit), by Country 2024 & 2032
- Figure 5: North America Induced Pluripotent Stem Cell Therapy Industry Revenue Share (%), by Country 2024 & 2032
- Figure 6: North America Induced Pluripotent Stem Cell Therapy Industry Volume Share (%), by Country 2024 & 2032
- Figure 7: Europe Induced Pluripotent Stem Cell Therapy Industry Revenue (Million), by Country 2024 & 2032
- Figure 8: Europe Induced Pluripotent Stem Cell Therapy Industry Volume (K unit), by Country 2024 & 2032
- Figure 9: Europe Induced Pluripotent Stem Cell Therapy Industry Revenue Share (%), by Country 2024 & 2032
- Figure 10: Europe Induced Pluripotent Stem Cell Therapy Industry Volume Share (%), by Country 2024 & 2032
- Figure 11: Asia Pacific Induced Pluripotent Stem Cell Therapy Industry Revenue (Million), by Country 2024 & 2032
- Figure 12: Asia Pacific Induced Pluripotent Stem Cell Therapy Industry Volume (K unit), by Country 2024 & 2032
- Figure 13: Asia Pacific Induced Pluripotent Stem Cell Therapy Industry Revenue Share (%), by Country 2024 & 2032
- Figure 14: Asia Pacific Induced Pluripotent Stem Cell Therapy Industry Volume Share (%), by Country 2024 & 2032
- Figure 15: Middle East and Africa Induced Pluripotent Stem Cell Therapy Industry Revenue (Million), by Country 2024 & 2032
- Figure 16: Middle East and Africa Induced Pluripotent Stem Cell Therapy Industry Volume (K unit), by Country 2024 & 2032
- Figure 17: Middle East and Africa Induced Pluripotent Stem Cell Therapy Industry Revenue Share (%), by Country 2024 & 2032
- Figure 18: Middle East and Africa Induced Pluripotent Stem Cell Therapy Industry Volume Share (%), by Country 2024 & 2032
- Figure 19: South America Induced Pluripotent Stem Cell Therapy Industry Revenue (Million), by Country 2024 & 2032
- Figure 20: South America Induced Pluripotent Stem Cell Therapy Industry Volume (K unit), by Country 2024 & 2032
- Figure 21: South America Induced Pluripotent Stem Cell Therapy Industry Revenue Share (%), by Country 2024 & 2032
- Figure 22: South America Induced Pluripotent Stem Cell Therapy Industry Volume Share (%), by Country 2024 & 2032
- Figure 23: North America Induced Pluripotent Stem Cell Therapy Industry Revenue (Million), by Derived Cell Type 2024 & 2032
- Figure 24: North America Induced Pluripotent Stem Cell Therapy Industry Volume (K unit), by Derived Cell Type 2024 & 2032
- Figure 25: North America Induced Pluripotent Stem Cell Therapy Industry Revenue Share (%), by Derived Cell Type 2024 & 2032
- Figure 26: North America Induced Pluripotent Stem Cell Therapy Industry Volume Share (%), by Derived Cell Type 2024 & 2032
- Figure 27: North America Induced Pluripotent Stem Cell Therapy Industry Revenue (Million), by Application 2024 & 2032
- Figure 28: North America Induced Pluripotent Stem Cell Therapy Industry Volume (K unit), by Application 2024 & 2032
- Figure 29: North America Induced Pluripotent Stem Cell Therapy Industry Revenue Share (%), by Application 2024 & 2032
- Figure 30: North America Induced Pluripotent Stem Cell Therapy Industry Volume Share (%), by Application 2024 & 2032
- Figure 31: North America Induced Pluripotent Stem Cell Therapy Industry Revenue (Million), by End User 2024 & 2032
- Figure 32: North America Induced Pluripotent Stem Cell Therapy Industry Volume (K unit), by End User 2024 & 2032
- Figure 33: North America Induced Pluripotent Stem Cell Therapy Industry Revenue Share (%), by End User 2024 & 2032
- Figure 34: North America Induced Pluripotent Stem Cell Therapy Industry Volume Share (%), by End User 2024 & 2032
- Figure 35: North America Induced Pluripotent Stem Cell Therapy Industry Revenue (Million), by Country 2024 & 2032
- Figure 36: North America Induced Pluripotent Stem Cell Therapy Industry Volume (K unit), by Country 2024 & 2032
- Figure 37: North America Induced Pluripotent Stem Cell Therapy Industry Revenue Share (%), by Country 2024 & 2032
- Figure 38: North America Induced Pluripotent Stem Cell Therapy Industry Volume Share (%), by Country 2024 & 2032
- Figure 39: Europe Induced Pluripotent Stem Cell Therapy Industry Revenue (Million), by Derived Cell Type 2024 & 2032
- Figure 40: Europe Induced Pluripotent Stem Cell Therapy Industry Volume (K unit), by Derived Cell Type 2024 & 2032
- Figure 41: Europe Induced Pluripotent Stem Cell Therapy Industry Revenue Share (%), by Derived Cell Type 2024 & 2032
- Figure 42: Europe Induced Pluripotent Stem Cell Therapy Industry Volume Share (%), by Derived Cell Type 2024 & 2032
- Figure 43: Europe Induced Pluripotent Stem Cell Therapy Industry Revenue (Million), by Application 2024 & 2032
- Figure 44: Europe Induced Pluripotent Stem Cell Therapy Industry Volume (K unit), by Application 2024 & 2032
- Figure 45: Europe Induced Pluripotent Stem Cell Therapy Industry Revenue Share (%), by Application 2024 & 2032
- Figure 46: Europe Induced Pluripotent Stem Cell Therapy Industry Volume Share (%), by Application 2024 & 2032
- Figure 47: Europe Induced Pluripotent Stem Cell Therapy Industry Revenue (Million), by End User 2024 & 2032
- Figure 48: Europe Induced Pluripotent Stem Cell Therapy Industry Volume (K unit), by End User 2024 & 2032
- Figure 49: Europe Induced Pluripotent Stem Cell Therapy Industry Revenue Share (%), by End User 2024 & 2032
- Figure 50: Europe Induced Pluripotent Stem Cell Therapy Industry Volume Share (%), by End User 2024 & 2032
- Figure 51: Europe Induced Pluripotent Stem Cell Therapy Industry Revenue (Million), by Country 2024 & 2032
- Figure 52: Europe Induced Pluripotent Stem Cell Therapy Industry Volume (K unit), by Country 2024 & 2032
- Figure 53: Europe Induced Pluripotent Stem Cell Therapy Industry Revenue Share (%), by Country 2024 & 2032
- Figure 54: Europe Induced Pluripotent Stem Cell Therapy Industry Volume Share (%), by Country 2024 & 2032
- Figure 55: Asia Pacific Induced Pluripotent Stem Cell Therapy Industry Revenue (Million), by Derived Cell Type 2024 & 2032
- Figure 56: Asia Pacific Induced Pluripotent Stem Cell Therapy Industry Volume (K unit), by Derived Cell Type 2024 & 2032
- Figure 57: Asia Pacific Induced Pluripotent Stem Cell Therapy Industry Revenue Share (%), by Derived Cell Type 2024 & 2032
- Figure 58: Asia Pacific Induced Pluripotent Stem Cell Therapy Industry Volume Share (%), by Derived Cell Type 2024 & 2032
- Figure 59: Asia Pacific Induced Pluripotent Stem Cell Therapy Industry Revenue (Million), by Application 2024 & 2032
- Figure 60: Asia Pacific Induced Pluripotent Stem Cell Therapy Industry Volume (K unit), by Application 2024 & 2032
- Figure 61: Asia Pacific Induced Pluripotent Stem Cell Therapy Industry Revenue Share (%), by Application 2024 & 2032
- Figure 62: Asia Pacific Induced Pluripotent Stem Cell Therapy Industry Volume Share (%), by Application 2024 & 2032
- Figure 63: Asia Pacific Induced Pluripotent Stem Cell Therapy Industry Revenue (Million), by End User 2024 & 2032
- Figure 64: Asia Pacific Induced Pluripotent Stem Cell Therapy Industry Volume (K unit), by End User 2024 & 2032
- Figure 65: Asia Pacific Induced Pluripotent Stem Cell Therapy Industry Revenue Share (%), by End User 2024 & 2032
- Figure 66: Asia Pacific Induced Pluripotent Stem Cell Therapy Industry Volume Share (%), by End User 2024 & 2032
- Figure 67: Asia Pacific Induced Pluripotent Stem Cell Therapy Industry Revenue (Million), by Country 2024 & 2032
- Figure 68: Asia Pacific Induced Pluripotent Stem Cell Therapy Industry Volume (K unit), by Country 2024 & 2032
- Figure 69: Asia Pacific Induced Pluripotent Stem Cell Therapy Industry Revenue Share (%), by Country 2024 & 2032
- Figure 70: Asia Pacific Induced Pluripotent Stem Cell Therapy Industry Volume Share (%), by Country 2024 & 2032
- Figure 71: Middle East and Africa Induced Pluripotent Stem Cell Therapy Industry Revenue (Million), by Derived Cell Type 2024 & 2032
- Figure 72: Middle East and Africa Induced Pluripotent Stem Cell Therapy Industry Volume (K unit), by Derived Cell Type 2024 & 2032
- Figure 73: Middle East and Africa Induced Pluripotent Stem Cell Therapy Industry Revenue Share (%), by Derived Cell Type 2024 & 2032
- Figure 74: Middle East and Africa Induced Pluripotent Stem Cell Therapy Industry Volume Share (%), by Derived Cell Type 2024 & 2032
- Figure 75: Middle East and Africa Induced Pluripotent Stem Cell Therapy Industry Revenue (Million), by Application 2024 & 2032
- Figure 76: Middle East and Africa Induced Pluripotent Stem Cell Therapy Industry Volume (K unit), by Application 2024 & 2032
- Figure 77: Middle East and Africa Induced Pluripotent Stem Cell Therapy Industry Revenue Share (%), by Application 2024 & 2032
- Figure 78: Middle East and Africa Induced Pluripotent Stem Cell Therapy Industry Volume Share (%), by Application 2024 & 2032
- Figure 79: Middle East and Africa Induced Pluripotent Stem Cell Therapy Industry Revenue (Million), by End User 2024 & 2032
- Figure 80: Middle East and Africa Induced Pluripotent Stem Cell Therapy Industry Volume (K unit), by End User 2024 & 2032
- Figure 81: Middle East and Africa Induced Pluripotent Stem Cell Therapy Industry Revenue Share (%), by End User 2024 & 2032
- Figure 82: Middle East and Africa Induced Pluripotent Stem Cell Therapy Industry Volume Share (%), by End User 2024 & 2032
- Figure 83: Middle East and Africa Induced Pluripotent Stem Cell Therapy Industry Revenue (Million), by Country 2024 & 2032
- Figure 84: Middle East and Africa Induced Pluripotent Stem Cell Therapy Industry Volume (K unit), by Country 2024 & 2032
- Figure 85: Middle East and Africa Induced Pluripotent Stem Cell Therapy Industry Revenue Share (%), by Country 2024 & 2032
- Figure 86: Middle East and Africa Induced Pluripotent Stem Cell Therapy Industry Volume Share (%), by Country 2024 & 2032
- Figure 87: South America Induced Pluripotent Stem Cell Therapy Industry Revenue (Million), by Derived Cell Type 2024 & 2032
- Figure 88: South America Induced Pluripotent Stem Cell Therapy Industry Volume (K unit), by Derived Cell Type 2024 & 2032
- Figure 89: South America Induced Pluripotent Stem Cell Therapy Industry Revenue Share (%), by Derived Cell Type 2024 & 2032
- Figure 90: South America Induced Pluripotent Stem Cell Therapy Industry Volume Share (%), by Derived Cell Type 2024 & 2032
- Figure 91: South America Induced Pluripotent Stem Cell Therapy Industry Revenue (Million), by Application 2024 & 2032
- Figure 92: South America Induced Pluripotent Stem Cell Therapy Industry Volume (K unit), by Application 2024 & 2032
- Figure 93: South America Induced Pluripotent Stem Cell Therapy Industry Revenue Share (%), by Application 2024 & 2032
- Figure 94: South America Induced Pluripotent Stem Cell Therapy Industry Volume Share (%), by Application 2024 & 2032
- Figure 95: South America Induced Pluripotent Stem Cell Therapy Industry Revenue (Million), by End User 2024 & 2032
- Figure 96: South America Induced Pluripotent Stem Cell Therapy Industry Volume (K unit), by End User 2024 & 2032
- Figure 97: South America Induced Pluripotent Stem Cell Therapy Industry Revenue Share (%), by End User 2024 & 2032
- Figure 98: South America Induced Pluripotent Stem Cell Therapy Industry Volume Share (%), by End User 2024 & 2032
- Figure 99: South America Induced Pluripotent Stem Cell Therapy Industry Revenue (Million), by Country 2024 & 2032
- Figure 100: South America Induced Pluripotent Stem Cell Therapy Industry Volume (K unit), by Country 2024 & 2032
- Figure 101: South America Induced Pluripotent Stem Cell Therapy Industry Revenue Share (%), by Country 2024 & 2032
- Figure 102: South America Induced Pluripotent Stem Cell Therapy Industry Volume Share (%), by Country 2024 & 2032
List of Tables
- Table 1: Global Induced Pluripotent Stem Cell Therapy Industry Revenue Million Forecast, by Region 2019 & 2032
- Table 2: Global Induced Pluripotent Stem Cell Therapy Industry Volume K unit Forecast, by Region 2019 & 2032
- Table 3: Global Induced Pluripotent Stem Cell Therapy Industry Revenue Million Forecast, by Derived Cell Type 2019 & 2032
- Table 4: Global Induced Pluripotent Stem Cell Therapy Industry Volume K unit Forecast, by Derived Cell Type 2019 & 2032
- Table 5: Global Induced Pluripotent Stem Cell Therapy Industry Revenue Million Forecast, by Application 2019 & 2032
- Table 6: Global Induced Pluripotent Stem Cell Therapy Industry Volume K unit Forecast, by Application 2019 & 2032
- Table 7: Global Induced Pluripotent Stem Cell Therapy Industry Revenue Million Forecast, by End User 2019 & 2032
- Table 8: Global Induced Pluripotent Stem Cell Therapy Industry Volume K unit Forecast, by End User 2019 & 2032
- Table 9: Global Induced Pluripotent Stem Cell Therapy Industry Revenue Million Forecast, by Region 2019 & 2032
- Table 10: Global Induced Pluripotent Stem Cell Therapy Industry Volume K unit Forecast, by Region 2019 & 2032
- Table 11: Global Induced Pluripotent Stem Cell Therapy Industry Revenue Million Forecast, by Country 2019 & 2032
- Table 12: Global Induced Pluripotent Stem Cell Therapy Industry Volume K unit Forecast, by Country 2019 & 2032
- Table 13: Global Induced Pluripotent Stem Cell Therapy Industry Revenue Million Forecast, by Country 2019 & 2032
- Table 14: Global Induced Pluripotent Stem Cell Therapy Industry Volume K unit Forecast, by Country 2019 & 2032
- Table 15: Global Induced Pluripotent Stem Cell Therapy Industry Revenue Million Forecast, by Country 2019 & 2032
- Table 16: Global Induced Pluripotent Stem Cell Therapy Industry Volume K unit Forecast, by Country 2019 & 2032
- Table 17: Global Induced Pluripotent Stem Cell Therapy Industry Revenue Million Forecast, by Country 2019 & 2032
- Table 18: Global Induced Pluripotent Stem Cell Therapy Industry Volume K unit Forecast, by Country 2019 & 2032
- Table 19: Global Induced Pluripotent Stem Cell Therapy Industry Revenue Million Forecast, by Country 2019 & 2032
- Table 20: Global Induced Pluripotent Stem Cell Therapy Industry Volume K unit Forecast, by Country 2019 & 2032
- Table 21: Global Induced Pluripotent Stem Cell Therapy Industry Revenue Million Forecast, by Derived Cell Type 2019 & 2032
- Table 22: Global Induced Pluripotent Stem Cell Therapy Industry Volume K unit Forecast, by Derived Cell Type 2019 & 2032
- Table 23: Global Induced Pluripotent Stem Cell Therapy Industry Revenue Million Forecast, by Application 2019 & 2032
- Table 24: Global Induced Pluripotent Stem Cell Therapy Industry Volume K unit Forecast, by Application 2019 & 2032
- Table 25: Global Induced Pluripotent Stem Cell Therapy Industry Revenue Million Forecast, by End User 2019 & 2032
- Table 26: Global Induced Pluripotent Stem Cell Therapy Industry Volume K unit Forecast, by End User 2019 & 2032
- Table 27: Global Induced Pluripotent Stem Cell Therapy Industry Revenue Million Forecast, by Country 2019 & 2032
- Table 28: Global Induced Pluripotent Stem Cell Therapy Industry Volume K unit Forecast, by Country 2019 & 2032
- Table 29: United States Induced Pluripotent Stem Cell Therapy Industry Revenue (Million) Forecast, by Application 2019 & 2032
- Table 30: United States Induced Pluripotent Stem Cell Therapy Industry Volume (K unit) Forecast, by Application 2019 & 2032
- Table 31: Canada Induced Pluripotent Stem Cell Therapy Industry Revenue (Million) Forecast, by Application 2019 & 2032
- Table 32: Canada Induced Pluripotent Stem Cell Therapy Industry Volume (K unit) Forecast, by Application 2019 & 2032
- Table 33: Mexico Induced Pluripotent Stem Cell Therapy Industry Revenue (Million) Forecast, by Application 2019 & 2032
- Table 34: Mexico Induced Pluripotent Stem Cell Therapy Industry Volume (K unit) Forecast, by Application 2019 & 2032
- Table 35: Global Induced Pluripotent Stem Cell Therapy Industry Revenue Million Forecast, by Derived Cell Type 2019 & 2032
- Table 36: Global Induced Pluripotent Stem Cell Therapy Industry Volume K unit Forecast, by Derived Cell Type 2019 & 2032
- Table 37: Global Induced Pluripotent Stem Cell Therapy Industry Revenue Million Forecast, by Application 2019 & 2032
- Table 38: Global Induced Pluripotent Stem Cell Therapy Industry Volume K unit Forecast, by Application 2019 & 2032
- Table 39: Global Induced Pluripotent Stem Cell Therapy Industry Revenue Million Forecast, by End User 2019 & 2032
- Table 40: Global Induced Pluripotent Stem Cell Therapy Industry Volume K unit Forecast, by End User 2019 & 2032
- Table 41: Global Induced Pluripotent Stem Cell Therapy Industry Revenue Million Forecast, by Country 2019 & 2032
- Table 42: Global Induced Pluripotent Stem Cell Therapy Industry Volume K unit Forecast, by Country 2019 & 2032
- Table 43: Germany Induced Pluripotent Stem Cell Therapy Industry Revenue (Million) Forecast, by Application 2019 & 2032
- Table 44: Germany Induced Pluripotent Stem Cell Therapy Industry Volume (K unit) Forecast, by Application 2019 & 2032
- Table 45: United Kingdom Induced Pluripotent Stem Cell Therapy Industry Revenue (Million) Forecast, by Application 2019 & 2032
- Table 46: United Kingdom Induced Pluripotent Stem Cell Therapy Industry Volume (K unit) Forecast, by Application 2019 & 2032
- Table 47: France Induced Pluripotent Stem Cell Therapy Industry Revenue (Million) Forecast, by Application 2019 & 2032
- Table 48: France Induced Pluripotent Stem Cell Therapy Industry Volume (K unit) Forecast, by Application 2019 & 2032
- Table 49: Italy Induced Pluripotent Stem Cell Therapy Industry Revenue (Million) Forecast, by Application 2019 & 2032
- Table 50: Italy Induced Pluripotent Stem Cell Therapy Industry Volume (K unit) Forecast, by Application 2019 & 2032
- Table 51: Spain Induced Pluripotent Stem Cell Therapy Industry Revenue (Million) Forecast, by Application 2019 & 2032
- Table 52: Spain Induced Pluripotent Stem Cell Therapy Industry Volume (K unit) Forecast, by Application 2019 & 2032
- Table 53: Rest of Europe Induced Pluripotent Stem Cell Therapy Industry Revenue (Million) Forecast, by Application 2019 & 2032
- Table 54: Rest of Europe Induced Pluripotent Stem Cell Therapy Industry Volume (K unit) Forecast, by Application 2019 & 2032
- Table 55: Global Induced Pluripotent Stem Cell Therapy Industry Revenue Million Forecast, by Derived Cell Type 2019 & 2032
- Table 56: Global Induced Pluripotent Stem Cell Therapy Industry Volume K unit Forecast, by Derived Cell Type 2019 & 2032
- Table 57: Global Induced Pluripotent Stem Cell Therapy Industry Revenue Million Forecast, by Application 2019 & 2032
- Table 58: Global Induced Pluripotent Stem Cell Therapy Industry Volume K unit Forecast, by Application 2019 & 2032
- Table 59: Global Induced Pluripotent Stem Cell Therapy Industry Revenue Million Forecast, by End User 2019 & 2032
- Table 60: Global Induced Pluripotent Stem Cell Therapy Industry Volume K unit Forecast, by End User 2019 & 2032
- Table 61: Global Induced Pluripotent Stem Cell Therapy Industry Revenue Million Forecast, by Country 2019 & 2032
- Table 62: Global Induced Pluripotent Stem Cell Therapy Industry Volume K unit Forecast, by Country 2019 & 2032
- Table 63: China Induced Pluripotent Stem Cell Therapy Industry Revenue (Million) Forecast, by Application 2019 & 2032
- Table 64: China Induced Pluripotent Stem Cell Therapy Industry Volume (K unit) Forecast, by Application 2019 & 2032
- Table 65: Japan Induced Pluripotent Stem Cell Therapy Industry Revenue (Million) Forecast, by Application 2019 & 2032
- Table 66: Japan Induced Pluripotent Stem Cell Therapy Industry Volume (K unit) Forecast, by Application 2019 & 2032
- Table 67: India Induced Pluripotent Stem Cell Therapy Industry Revenue (Million) Forecast, by Application 2019 & 2032
- Table 68: India Induced Pluripotent Stem Cell Therapy Industry Volume (K unit) Forecast, by Application 2019 & 2032
- Table 69: Australia Induced Pluripotent Stem Cell Therapy Industry Revenue (Million) Forecast, by Application 2019 & 2032
- Table 70: Australia Induced Pluripotent Stem Cell Therapy Industry Volume (K unit) Forecast, by Application 2019 & 2032
- Table 71: South Korea Induced Pluripotent Stem Cell Therapy Industry Revenue (Million) Forecast, by Application 2019 & 2032
- Table 72: South Korea Induced Pluripotent Stem Cell Therapy Industry Volume (K unit) Forecast, by Application 2019 & 2032
- Table 73: Rest of Asia Pacific Induced Pluripotent Stem Cell Therapy Industry Revenue (Million) Forecast, by Application 2019 & 2032
- Table 74: Rest of Asia Pacific Induced Pluripotent Stem Cell Therapy Industry Volume (K unit) Forecast, by Application 2019 & 2032
- Table 75: Global Induced Pluripotent Stem Cell Therapy Industry Revenue Million Forecast, by Derived Cell Type 2019 & 2032
- Table 76: Global Induced Pluripotent Stem Cell Therapy Industry Volume K unit Forecast, by Derived Cell Type 2019 & 2032
- Table 77: Global Induced Pluripotent Stem Cell Therapy Industry Revenue Million Forecast, by Application 2019 & 2032
- Table 78: Global Induced Pluripotent Stem Cell Therapy Industry Volume K unit Forecast, by Application 2019 & 2032
- Table 79: Global Induced Pluripotent Stem Cell Therapy Industry Revenue Million Forecast, by End User 2019 & 2032
- Table 80: Global Induced Pluripotent Stem Cell Therapy Industry Volume K unit Forecast, by End User 2019 & 2032
- Table 81: Global Induced Pluripotent Stem Cell Therapy Industry Revenue Million Forecast, by Country 2019 & 2032
- Table 82: Global Induced Pluripotent Stem Cell Therapy Industry Volume K unit Forecast, by Country 2019 & 2032
- Table 83: GCC Induced Pluripotent Stem Cell Therapy Industry Revenue (Million) Forecast, by Application 2019 & 2032
- Table 84: GCC Induced Pluripotent Stem Cell Therapy Industry Volume (K unit) Forecast, by Application 2019 & 2032
- Table 85: South Africa Induced Pluripotent Stem Cell Therapy Industry Revenue (Million) Forecast, by Application 2019 & 2032
- Table 86: South Africa Induced Pluripotent Stem Cell Therapy Industry Volume (K unit) Forecast, by Application 2019 & 2032
- Table 87: Rest of Middle East and Africa Induced Pluripotent Stem Cell Therapy Industry Revenue (Million) Forecast, by Application 2019 & 2032
- Table 88: Rest of Middle East and Africa Induced Pluripotent Stem Cell Therapy Industry Volume (K unit) Forecast, by Application 2019 & 2032
- Table 89: Global Induced Pluripotent Stem Cell Therapy Industry Revenue Million Forecast, by Derived Cell Type 2019 & 2032
- Table 90: Global Induced Pluripotent Stem Cell Therapy Industry Volume K unit Forecast, by Derived Cell Type 2019 & 2032
- Table 91: Global Induced Pluripotent Stem Cell Therapy Industry Revenue Million Forecast, by Application 2019 & 2032
- Table 92: Global Induced Pluripotent Stem Cell Therapy Industry Volume K unit Forecast, by Application 2019 & 2032
- Table 93: Global Induced Pluripotent Stem Cell Therapy Industry Revenue Million Forecast, by End User 2019 & 2032
- Table 94: Global Induced Pluripotent Stem Cell Therapy Industry Volume K unit Forecast, by End User 2019 & 2032
- Table 95: Global Induced Pluripotent Stem Cell Therapy Industry Revenue Million Forecast, by Country 2019 & 2032
- Table 96: Global Induced Pluripotent Stem Cell Therapy Industry Volume K unit Forecast, by Country 2019 & 2032
- Table 97: Brazil Induced Pluripotent Stem Cell Therapy Industry Revenue (Million) Forecast, by Application 2019 & 2032
- Table 98: Brazil Induced Pluripotent Stem Cell Therapy Industry Volume (K unit) Forecast, by Application 2019 & 2032
- Table 99: Argentina Induced Pluripotent Stem Cell Therapy Industry Revenue (Million) Forecast, by Application 2019 & 2032
- Table 100: Argentina Induced Pluripotent Stem Cell Therapy Industry Volume (K unit) Forecast, by Application 2019 & 2032
- Table 101: Rest of South America Induced Pluripotent Stem Cell Therapy Industry Revenue (Million) Forecast, by Application 2019 & 2032
- Table 102: Rest of South America Induced Pluripotent Stem Cell Therapy Industry Volume (K unit) Forecast, by Application 2019 & 2032
Frequently Asked Questions
1. What is the projected Compound Annual Growth Rate (CAGR) of the Induced Pluripotent Stem Cell Therapy Industry?
The projected CAGR is approximately 10.10%.
2. Which companies are prominent players in the Induced Pluripotent Stem Cell Therapy Industry?
Key companies in the market include Cynata Therapeutics Limited, FUJIFILM Cellular Dynamics Inc, Axol Bioscience Ltd, Thermo Fisher Scientific Inc, Takara Bio Inc, REPROCELL USA Inc, LizarBio Therapeutics (Pluricell Biotech), Fate Therapeutics Inc, Sumitomo Dainippon Pharma Co Ltd, Ncardia, ViaCyte Inc , Evotec SE.
3. What are the main segments of the Induced Pluripotent Stem Cell Therapy Industry?
The market segments include Derived Cell Type, Application, End User.
4. Can you provide details about the market size?
The market size is estimated to be USD 1.35 Million as of 2022.
5. What are some drivers contributing to market growth?
Increase in Research and Development Activities in Stem Cells Therapies; Surge in Adoption of Personalized Medicine.
6. What are the notable trends driving market growth?
Regenerative Medicine Segment is Expected to Witness Significant Growth Over the Forecast Period.
7. Are there any restraints impacting market growth?
Lack of Awareness Regarding Stem Cell Therapies and High Cost of Treatment.
8. Can you provide examples of recent developments in the market?
In November 2022, Prepaire Labs signed a 5-year agreement with Ncardia to accelerate drug discovery and development including target discovery, lead optimization, toxicity assessment, and trial design. The new initiative assists in the development of iPSCs by reprogramming adult cells (such as skin and blood cells) into an embryonic stem cell-like state, which can differentiate into any type of human body cell.
9. What pricing options are available for accessing the report?
Pricing options include single-user, multi-user, and enterprise licenses priced at USD 4750, USD 5250, and USD 8750 respectively.
10. Is the market size provided in terms of value or volume?
The market size is provided in terms of value, measured in Million and volume, measured in K unit.
11. Are there any specific market keywords associated with the report?
Yes, the market keyword associated with the report is "Induced Pluripotent Stem Cell Therapy Industry," which aids in identifying and referencing the specific market segment covered.
12. How do I determine which pricing option suits my needs best?
The pricing options vary based on user requirements and access needs. Individual users may opt for single-user licenses, while businesses requiring broader access may choose multi-user or enterprise licenses for cost-effective access to the report.
13. Are there any additional resources or data provided in the Induced Pluripotent Stem Cell Therapy Industry report?
While the report offers comprehensive insights, it's advisable to review the specific contents or supplementary materials provided to ascertain if additional resources or data are available.
14. How can I stay updated on further developments or reports in the Induced Pluripotent Stem Cell Therapy Industry?
To stay informed about further developments, trends, and reports in the Induced Pluripotent Stem Cell Therapy Industry, consider subscribing to industry newsletters, following relevant companies and organizations, or regularly checking reputable industry news sources and publications.
Methodology
Step 1 - Identification of Relevant Samples Size from Population Database


Step 2 - Approaches for Defining Global Market Size (Value, Volume* & Price*)

Note*: In applicable scenarios
Step 3 - Data Sources
Primary Research
- Web Analytics
- Survey Reports
- Research Institute
- Latest Research Reports
- Opinion Leaders
Secondary Research
- Annual Reports
- White Paper
- Latest Press Release
- Industry Association
- Paid Database
- Investor Presentations

Step 4 - Data Triangulation
Involves using different sources of information in order to increase the validity of a study
These sources are likely to be stakeholders in a program - participants, other researchers, program staff, other community members, and so on.
Then we put all data in single framework & apply various statistical tools to find out the dynamic on the market.
During the analysis stage, feedback from the stakeholder groups would be compared to determine areas of agreement as well as areas of divergence


