
Key Insights
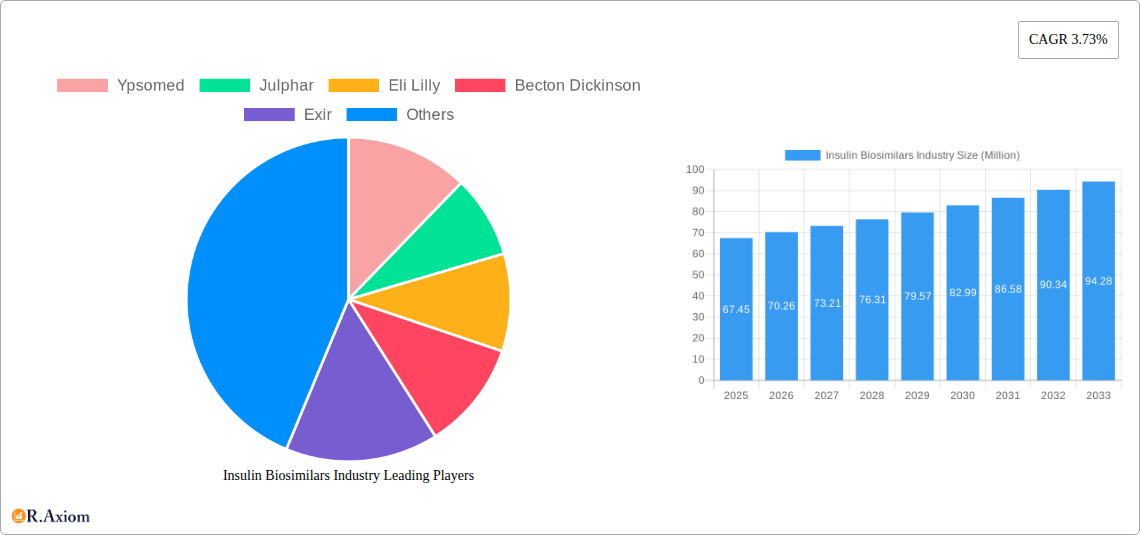
The global insulin biosimilars market, valued at $67.45 million in 2025, is projected to experience robust growth, driven by several key factors. The increasing prevalence of diabetes globally, coupled with the rising cost of originator insulin products, fuels demand for more affordable biosimilar alternatives. This trend is further amplified by the expanding geriatric population, a demographic highly susceptible to diabetes. Furthermore, supportive regulatory frameworks in various regions are expediting the approval and market entry of new biosimilars, contributing significantly to market expansion. While challenges remain, such as potential concerns about biosimilarity and the need for robust clinical data to establish efficacy and safety, the overall market outlook remains positive. The competitive landscape, characterized by a mix of established pharmaceutical giants like Sanofi Aventis and Novo Nordisk A/S and emerging biopharmaceutical companies, is likely to intensify further, potentially leading to price competition and increased accessibility for patients. Growth will also be influenced by advancements in insulin delivery systems, such as insulin pens and pumps, which offer improved convenience and therapeutic outcomes, thereby increasing the overall demand for insulin biosimilars across all segments.
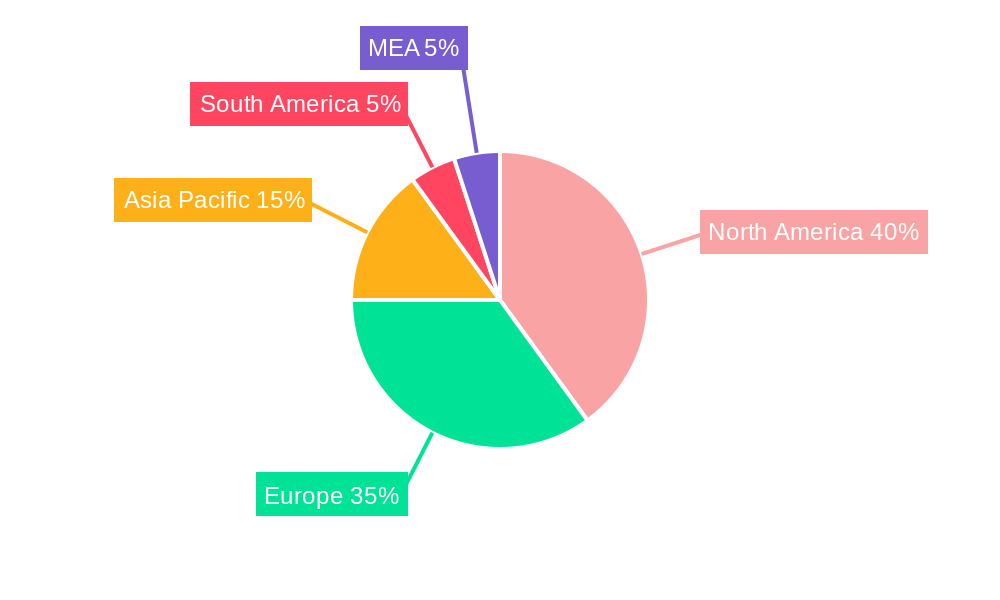
The market segmentation offers valuable insights into specific growth drivers. The Basal or Long-Acting Insulins segment is expected to dominate due to their widespread use in managing type 1 and type 2 diabetes. Similarly, within the device segment, insulin pens are projected to hold a significant share due to their ease of use and portability compared to other delivery methods. Geographical analysis reveals that North America and Europe currently hold the largest market share, driven by high diabetes prevalence rates and established healthcare infrastructure. However, emerging economies in Asia Pacific and South America are poised for substantial growth due to rising diabetes incidence and increasing healthcare spending in these regions. The forecast period (2025-2033) will witness continuous innovation in biosimilar technology, leading to the development of more effective and safer products, further propelling market expansion. The market's future trajectory depends on successful navigation of regulatory hurdles, demonstration of biosimilarity equivalence, and building patient and physician confidence in these cost-effective therapeutic alternatives.
This comprehensive report provides an in-depth analysis of the Insulin Biosimilars industry, encompassing market size, segmentation, growth drivers, challenges, and future opportunities from 2019 to 2033. The report leverages data from the historical period (2019-2024), base year (2025), and estimated year (2025) to forecast market trends until 2033. Key players such as Novo Nordisk A/S, Sanofi Aventis, Eli Lilly, and others are analyzed, offering crucial insights for industry stakeholders, investors, and researchers.
Insulin Biosimilars Industry Market Concentration & Innovation
The insulin biosimilars market exhibits a moderately concentrated landscape, with a few major players holding significant market share. However, the entry of new biosimilars and the ongoing development of innovative delivery systems are fostering increased competition. Market share data for 2025 estimates Novo Nordisk A/S holding approximately xx% market share, followed by Sanofi Aventis with xx%, and Eli Lilly with xx%. The remaining market share is distributed amongst other players including Biocon, and smaller emerging companies. Innovation is driven by the need for more convenient and effective insulin delivery methods, as well as the development of biosimilars with improved efficacy and safety profiles. The regulatory framework, while supportive of biosimilar development, poses challenges related to biosimilarity assessments and market approvals. The presence of established insulin brands acts as a major competitive pressure, and the landscape is characterized by ongoing mergers and acquisitions (M&A) activity. Significant M&A deals in the past five years have involved valuations totaling approximately $xx Million, signifying a consolidation trend in the industry. End-user trends indicate a growing preference for convenient delivery systems like insulin pens and pumps, driving innovation in device technology.
Insulin Biosimilars Industry Industry Trends & Insights
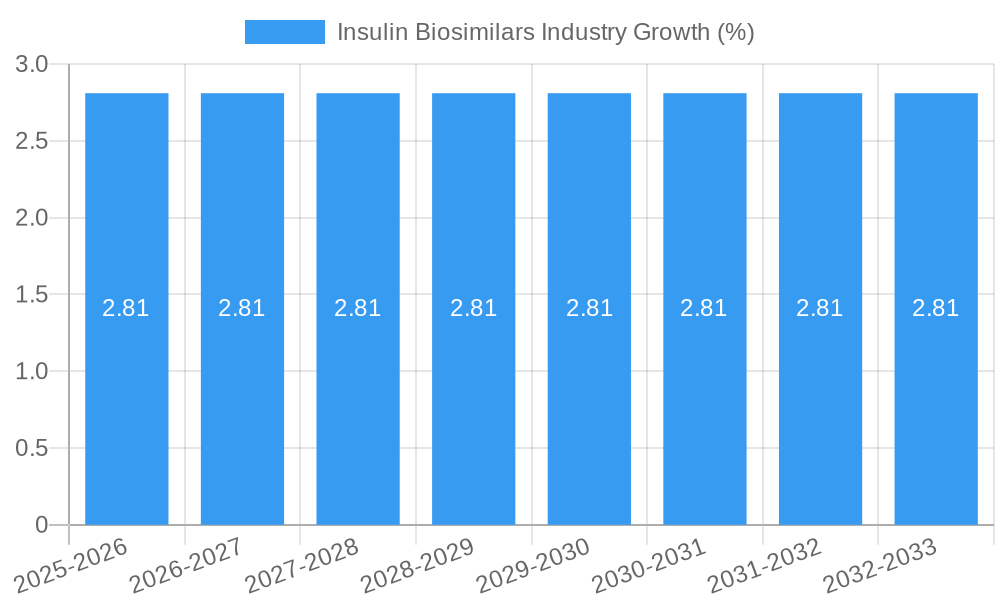
The insulin biosimilars market is poised for significant growth, driven by factors such as increasing prevalence of diabetes, rising demand for affordable insulin alternatives, and ongoing technological advancements. The market is expected to register a Compound Annual Growth Rate (CAGR) of xx% during the forecast period (2025-2033). This growth is fueled by several factors, including the expanding diabetic population globally, an increasing preference for cost-effective treatment options, and continuous improvements in biosimilar technology leading to enhanced efficacy and safety. Technological disruptions, such as the development of closed-loop insulin delivery systems and smart insulin pens, are revolutionizing diabetes management, improving patient outcomes, and creating new market opportunities. Consumer preferences are shifting toward more user-friendly devices and formulations, while competitive dynamics are characterized by the ongoing introduction of new biosimilars and innovative delivery systems. Market penetration of biosimilars is gradually increasing, although challenges remain in terms of physician and patient acceptance. By 2033, market penetration of biosimilars is projected to reach approximately xx%.
Dominant Markets & Segments in Insulin Biosimilars Industry
Dominant Regions & Countries: The North American market, particularly the United States, currently dominates the insulin biosimilars market due to high diabetes prevalence, robust healthcare infrastructure, and significant pharmaceutical spending. However, rapidly growing economies in Asia-Pacific and other emerging markets are witnessing increasing market penetration.
Dominant Segments:
- By Drug: The basal or long-acting insulin segment holds the largest market share owing to its widespread use in managing type 1 and type 2 diabetes. The combination insulin segment demonstrates faster growth potential due to the potential for improved glycemic control.
- By Device: Insulin pens are the dominant delivery device due to their convenience and ease of use. However, insulin pumps are experiencing significant growth fueled by technological advances and improved patient outcomes.
Key Drivers for Dominance:
- North America: High diabetes prevalence, advanced healthcare infrastructure, high disposable income.
- Asia-Pacific: Rapidly growing diabetic population, increasing healthcare expenditure, government initiatives to improve healthcare access.
Insulin Biosimilars Industry Product Developments
Recent innovations in insulin biosimilars focus on enhanced delivery systems, such as automated insulin delivery (AID) systems and smart insulin pens. These advancements improve patient convenience, adherence, and glycemic control. The development of once-weekly insulin formulations represents a key technological breakthrough, promising to significantly improve patient compliance and reduce the burden of daily injections. This is exemplified by Novo Nordisk's once-weekly insulin icodec. Furthermore, research into long-acting insulins with extended duration and improved safety profiles is ongoing, expanding treatment options and potentially improving patient outcomes. The market fit of these innovations is high, driven by the demand for more effective and convenient diabetes management solutions.
Report Scope & Segmentation Analysis
This report segments the insulin biosimilars market by drug type (Basal or Long Acting Insulins, Basaglar (Insulin glargine), Bolus or Fast Acting Insulins, Admelog (Insulin lispro Sanofi), Traditional Human Insulins, Insuman, Combination Insulins, Soliqua/Suliqua (Insulin glargine and Lixisenatide), and by device (Insulin Pumps, Insulin Infusion sets, Insulin Pens, Disposable insulin pens, Insulin Syringes, Insulin Jet Injectors). Each segment's growth is projected based on factors including market size, competitive dynamics, and technological advancements. For example, the basal or long-acting insulin segment is expected to maintain a substantial market share due to its established role in diabetes management. Conversely, the combination insulin segment is expected to show strong growth driven by the advantages of combined therapy. In the device segment, insulin pen usage is expected to remain high, but the adoption of insulin pumps is expected to increase, driven by technological advancements and rising preference for automated systems.
Key Drivers of Insulin Biosimilars Industry Growth
The growth of the insulin biosimilars market is primarily driven by the increasing prevalence of diabetes globally, coupled with the rising demand for cost-effective treatment options. Technological advancements in biosimilar manufacturing and delivery systems further fuel market expansion. Favorable regulatory environments in several countries have also played a key role in accelerating biosimilar adoption. For instance, the approval of several biosimilars in major markets has made these alternatives more readily accessible and affordable.
Challenges in the Insulin Biosimilars Industry Sector
Challenges to market growth include regulatory hurdles in securing biosimilar approvals, concerns regarding biosimilarity and interchangeability, and the potential for price competition to affect profitability. Supply chain disruptions, particularly concerning raw materials and manufacturing capacity, can also impact market supply and affordability. Furthermore, the extensive marketing and promotional activities by originator companies pose a challenge for biosimilar manufacturers in gaining market share. These challenges collectively contribute to slower-than-expected market penetration for some biosimilars, despite their potential cost-saving advantages.
Emerging Opportunities in Insulin Biosimilars Industry
Emerging opportunities lie in the development of novel insulin analogs with improved efficacy and safety profiles, advanced delivery systems, and personalized medicine approaches tailored to individual patient needs. Expanding into emerging markets with high diabetes prevalence and underpenetrated biosimilar markets also presents significant growth potential. Furthermore, the increasing integration of digital health technologies, such as continuous glucose monitoring (CGM) systems, with insulin delivery devices is opening up new avenues for innovation and market growth.
Leading Players in the Insulin Biosimilars Industry Market
- Ypsomed
- Julphar
- Eli Lilly
- Becton Dickinson
- Exir
- Medtronic
- Sanofi Aventis
- Biocon
- Insulet
- Novo Nordisk A/S
Key Developments in Insulin Biosimilars Industry Industry
- May 2023: FDA clearance of Beta Bionics iLet Bionic Pancreas system marks a significant advancement in automated insulin delivery, potentially impacting the insulin delivery device market.
- October 2022: Novo Nordisk's positive phase 3a trial results for once-weekly insulin icodec signal a potential shift towards more convenient insulin regimens, impacting market competition and patient preference.
Strategic Outlook for Insulin Biosimilars Industry Market
The insulin biosimilars market is projected to experience sustained growth over the next decade, driven by continuous technological innovations, expanding diabetes prevalence, and increasing demand for affordable treatment options. Opportunities for growth lie in developing innovative delivery systems, personalized medicine approaches, and expanding into emerging markets. Strategic partnerships and collaborations between biosimilar manufacturers and device companies will play a crucial role in shaping the future of the industry. Companies focusing on enhancing product accessibility and affordability are poised to gain a competitive advantage.
Insulin Biosimilars Industry Segmentation
-
1. Drug
- 1.1. Basal or Long Acting Insulins
- 1.2. Bolus or Fast Acting Insulins
- 1.3. Traditional Human Insulins
- 1.4. Combination Insulins
- 1.5. Biosimilar Insulins
-
2. Device
- 2.1. Insulin Pumps
- 2.2. Insulin Pens
- 2.3. Insulin Syringes
- 2.4. Insulin Jet Injectors
Insulin Biosimilars Industry Segmentation By Geography
-
1. North America
- 1.1. United States
- 1.2. Canada
- 1.3. Rest of North America
-
2. Europe
- 2.1. Germany
- 2.2. United Kingdom
- 2.3. France
- 2.4. Russia
- 2.5. Spain
- 2.6. Italy
- 2.7. Rest of Europe
-
3. Asia Pacific
- 3.1. Australia
- 3.2. India
- 3.3. China
- 3.4. Japan
- 3.5. Malaysia
- 3.6. South Korea
- 3.7. Thailand
- 3.8. Philippines
- 3.9. Vietnam
- 3.10. Indonesia
- 3.11. Rest of the Asia Pacific
-
4. Latin America
- 4.1. Brazil
- 4.2. Mexico
- 4.3. Rest of Latin America
-
5. Middle East and Africa
- 5.1. Saudi Arabia
- 5.2. Iran
- 5.3. Egypt
- 5.4. Oman
- 5.5. South Africa
- 5.6. Rest of the Middle East and Africa
Insulin Biosimilars Industry REPORT HIGHLIGHTS
| Aspects | Details |
|---|---|
| Study Period | 2019-2033 |
| Base Year | 2024 |
| Estimated Year | 2025 |
| Forecast Period | 2025-2033 |
| Historical Period | 2019-2024 |
| Growth Rate | CAGR of 3.73% from 2019-2033 |
| Segmentation |
|
Table of Contents
- 1. Introduction
- 1.1. Research Scope
- 1.2. Market Segmentation
- 1.3. Research Methodology
- 1.4. Definitions and Assumptions
- 2. Executive Summary
- 2.1. Introduction
- 3. Market Dynamics
- 3.1. Introduction
- 3.2. Market Drivers
- 3.2.1. ; The Rise in Global Prevalence of Cases of Obesity due to Modern Sedentary Lifestyles; Rise in Awareness and Disposable Income in Developed Economies
- 3.3. Market Restrains
- 3.3.1 ; Highly Cost of Branded Products in Emerging Countries; Severe Adverse Associated with Medication Including Seizures
- 3.3.2 Suicidal Attempts and Even Death; Adoption of Traditional Yoga and Herbal Products
- 3.4. Market Trends
- 3.4.1. Type-1 Diabetes Population Driving the Market In The Forecast Period
- 4. Market Factor Analysis
- 4.1. Porters Five Forces
- 4.2. Supply/Value Chain
- 4.3. PESTEL analysis
- 4.4. Market Entropy
- 4.5. Patent/Trademark Analysis
- 5. Global Insulin Biosimilars Industry Analysis, Insights and Forecast, 2019-2031
- 5.1. Market Analysis, Insights and Forecast - by Drug
- 5.1.1. Basal or Long Acting Insulins
- 5.1.2. Bolus or Fast Acting Insulins
- 5.1.3. Traditional Human Insulins
- 5.1.4. Combination Insulins
- 5.1.5. Biosimilar Insulins
- 5.2. Market Analysis, Insights and Forecast - by Device
- 5.2.1. Insulin Pumps
- 5.2.2. Insulin Pens
- 5.2.3. Insulin Syringes
- 5.2.4. Insulin Jet Injectors
- 5.3. Market Analysis, Insights and Forecast - by Region
- 5.3.1. North America
- 5.3.2. Europe
- 5.3.3. Asia Pacific
- 5.3.4. Latin America
- 5.3.5. Middle East and Africa
- 5.1. Market Analysis, Insights and Forecast - by Drug
- 6. North America Insulin Biosimilars Industry Analysis, Insights and Forecast, 2019-2031
- 6.1. Market Analysis, Insights and Forecast - by Drug
- 6.1.1. Basal or Long Acting Insulins
- 6.1.2. Bolus or Fast Acting Insulins
- 6.1.3. Traditional Human Insulins
- 6.1.4. Combination Insulins
- 6.1.5. Biosimilar Insulins
- 6.2. Market Analysis, Insights and Forecast - by Device
- 6.2.1. Insulin Pumps
- 6.2.2. Insulin Pens
- 6.2.3. Insulin Syringes
- 6.2.4. Insulin Jet Injectors
- 6.1. Market Analysis, Insights and Forecast - by Drug
- 7. Europe Insulin Biosimilars Industry Analysis, Insights and Forecast, 2019-2031
- 7.1. Market Analysis, Insights and Forecast - by Drug
- 7.1.1. Basal or Long Acting Insulins
- 7.1.2. Bolus or Fast Acting Insulins
- 7.1.3. Traditional Human Insulins
- 7.1.4. Combination Insulins
- 7.1.5. Biosimilar Insulins
- 7.2. Market Analysis, Insights and Forecast - by Device
- 7.2.1. Insulin Pumps
- 7.2.2. Insulin Pens
- 7.2.3. Insulin Syringes
- 7.2.4. Insulin Jet Injectors
- 7.1. Market Analysis, Insights and Forecast - by Drug
- 8. Asia Pacific Insulin Biosimilars Industry Analysis, Insights and Forecast, 2019-2031
- 8.1. Market Analysis, Insights and Forecast - by Drug
- 8.1.1. Basal or Long Acting Insulins
- 8.1.2. Bolus or Fast Acting Insulins
- 8.1.3. Traditional Human Insulins
- 8.1.4. Combination Insulins
- 8.1.5. Biosimilar Insulins
- 8.2. Market Analysis, Insights and Forecast - by Device
- 8.2.1. Insulin Pumps
- 8.2.2. Insulin Pens
- 8.2.3. Insulin Syringes
- 8.2.4. Insulin Jet Injectors
- 8.1. Market Analysis, Insights and Forecast - by Drug
- 9. Latin America Insulin Biosimilars Industry Analysis, Insights and Forecast, 2019-2031
- 9.1. Market Analysis, Insights and Forecast - by Drug
- 9.1.1. Basal or Long Acting Insulins
- 9.1.2. Bolus or Fast Acting Insulins
- 9.1.3. Traditional Human Insulins
- 9.1.4. Combination Insulins
- 9.1.5. Biosimilar Insulins
- 9.2. Market Analysis, Insights and Forecast - by Device
- 9.2.1. Insulin Pumps
- 9.2.2. Insulin Pens
- 9.2.3. Insulin Syringes
- 9.2.4. Insulin Jet Injectors
- 9.1. Market Analysis, Insights and Forecast - by Drug
- 10. Middle East and Africa Insulin Biosimilars Industry Analysis, Insights and Forecast, 2019-2031
- 10.1. Market Analysis, Insights and Forecast - by Drug
- 10.1.1. Basal or Long Acting Insulins
- 10.1.2. Bolus or Fast Acting Insulins
- 10.1.3. Traditional Human Insulins
- 10.1.4. Combination Insulins
- 10.1.5. Biosimilar Insulins
- 10.2. Market Analysis, Insights and Forecast - by Device
- 10.2.1. Insulin Pumps
- 10.2.2. Insulin Pens
- 10.2.3. Insulin Syringes
- 10.2.4. Insulin Jet Injectors
- 10.1. Market Analysis, Insights and Forecast - by Drug
- 11. North America Insulin Biosimilars Industry Analysis, Insights and Forecast, 2019-2031
- 11.1. Market Analysis, Insights and Forecast - By Country/Sub-region
- 11.1.1 United States
- 11.1.2 Canada
- 11.1.3 Mexico
- 12. Europe Insulin Biosimilars Industry Analysis, Insights and Forecast, 2019-2031
- 12.1. Market Analysis, Insights and Forecast - By Country/Sub-region
- 12.1.1 Germany
- 12.1.2 United Kingdom
- 12.1.3 France
- 12.1.4 Spain
- 12.1.5 Italy
- 12.1.6 Spain
- 12.1.7 Belgium
- 12.1.8 Netherland
- 12.1.9 Nordics
- 12.1.10 Rest of Europe
- 13. Asia Pacific Insulin Biosimilars Industry Analysis, Insights and Forecast, 2019-2031
- 13.1. Market Analysis, Insights and Forecast - By Country/Sub-region
- 13.1.1 China
- 13.1.2 Japan
- 13.1.3 India
- 13.1.4 South Korea
- 13.1.5 Southeast Asia
- 13.1.6 Australia
- 13.1.7 Indonesia
- 13.1.8 Phillipes
- 13.1.9 Singapore
- 13.1.10 Thailandc
- 13.1.11 Rest of Asia Pacific
- 14. South America Insulin Biosimilars Industry Analysis, Insights and Forecast, 2019-2031
- 14.1. Market Analysis, Insights and Forecast - By Country/Sub-region
- 14.1.1 Brazil
- 14.1.2 Argentina
- 14.1.3 Peru
- 14.1.4 Chile
- 14.1.5 Colombia
- 14.1.6 Ecuador
- 14.1.7 Venezuela
- 14.1.8 Rest of South America
- 15. North America Insulin Biosimilars Industry Analysis, Insights and Forecast, 2019-2031
- 15.1. Market Analysis, Insights and Forecast - By Country/Sub-region
- 15.1.1 United States
- 15.1.2 Canada
- 15.1.3 Mexico
- 16. MEA Insulin Biosimilars Industry Analysis, Insights and Forecast, 2019-2031
- 16.1. Market Analysis, Insights and Forecast - By Country/Sub-region
- 16.1.1 United Arab Emirates
- 16.1.2 Saudi Arabia
- 16.1.3 South Africa
- 16.1.4 Rest of Middle East and Africa
- 17. Competitive Analysis
- 17.1. Global Market Share Analysis 2024
- 17.2. Company Profiles
- 17.2.1 Ypsomed
- 17.2.1.1. Overview
- 17.2.1.2. Products
- 17.2.1.3. SWOT Analysis
- 17.2.1.4. Recent Developments
- 17.2.1.5. Financials (Based on Availability)
- 17.2.2 Julphar
- 17.2.2.1. Overview
- 17.2.2.2. Products
- 17.2.2.3. SWOT Analysis
- 17.2.2.4. Recent Developments
- 17.2.2.5. Financials (Based on Availability)
- 17.2.3 Eli Lilly
- 17.2.3.1. Overview
- 17.2.3.2. Products
- 17.2.3.3. SWOT Analysis
- 17.2.3.4. Recent Developments
- 17.2.3.5. Financials (Based on Availability)
- 17.2.4 Becton Dickinson
- 17.2.4.1. Overview
- 17.2.4.2. Products
- 17.2.4.3. SWOT Analysis
- 17.2.4.4. Recent Developments
- 17.2.4.5. Financials (Based on Availability)
- 17.2.5 Exir
- 17.2.5.1. Overview
- 17.2.5.2. Products
- 17.2.5.3. SWOT Analysis
- 17.2.5.4. Recent Developments
- 17.2.5.5. Financials (Based on Availability)
- 17.2.6 Medtronic
- 17.2.6.1. Overview
- 17.2.6.2. Products
- 17.2.6.3. SWOT Analysis
- 17.2.6.4. Recent Developments
- 17.2.6.5. Financials (Based on Availability)
- 17.2.7 Sanofi Aventis
- 17.2.7.1. Overview
- 17.2.7.2. Products
- 17.2.7.3. SWOT Analysis
- 17.2.7.4. Recent Developments
- 17.2.7.5. Financials (Based on Availability)
- 17.2.8 Biocon
- 17.2.8.1. Overview
- 17.2.8.2. Products
- 17.2.8.3. SWOT Analysis
- 17.2.8.4. Recent Developments
- 17.2.8.5. Financials (Based on Availability)
- 17.2.9 Insulet
- 17.2.9.1. Overview
- 17.2.9.2. Products
- 17.2.9.3. SWOT Analysis
- 17.2.9.4. Recent Developments
- 17.2.9.5. Financials (Based on Availability)
- 17.2.10 Novo Nordisk A/S
- 17.2.10.1. Overview
- 17.2.10.2. Products
- 17.2.10.3. SWOT Analysis
- 17.2.10.4. Recent Developments
- 17.2.10.5. Financials (Based on Availability)
- 17.2.1 Ypsomed
List of Figures
- Figure 1: Global Insulin Biosimilars Industry Revenue Breakdown (Million, %) by Region 2024 & 2032
- Figure 2: Global Insulin Biosimilars Industry Volume Breakdown (K Unit, %) by Region 2024 & 2032
- Figure 3: North America Insulin Biosimilars Industry Revenue (Million), by Country 2024 & 2032
- Figure 4: North America Insulin Biosimilars Industry Volume (K Unit), by Country 2024 & 2032
- Figure 5: North America Insulin Biosimilars Industry Revenue Share (%), by Country 2024 & 2032
- Figure 6: North America Insulin Biosimilars Industry Volume Share (%), by Country 2024 & 2032
- Figure 7: Europe Insulin Biosimilars Industry Revenue (Million), by Country 2024 & 2032
- Figure 8: Europe Insulin Biosimilars Industry Volume (K Unit), by Country 2024 & 2032
- Figure 9: Europe Insulin Biosimilars Industry Revenue Share (%), by Country 2024 & 2032
- Figure 10: Europe Insulin Biosimilars Industry Volume Share (%), by Country 2024 & 2032
- Figure 11: Asia Pacific Insulin Biosimilars Industry Revenue (Million), by Country 2024 & 2032
- Figure 12: Asia Pacific Insulin Biosimilars Industry Volume (K Unit), by Country 2024 & 2032
- Figure 13: Asia Pacific Insulin Biosimilars Industry Revenue Share (%), by Country 2024 & 2032
- Figure 14: Asia Pacific Insulin Biosimilars Industry Volume Share (%), by Country 2024 & 2032
- Figure 15: South America Insulin Biosimilars Industry Revenue (Million), by Country 2024 & 2032
- Figure 16: South America Insulin Biosimilars Industry Volume (K Unit), by Country 2024 & 2032
- Figure 17: South America Insulin Biosimilars Industry Revenue Share (%), by Country 2024 & 2032
- Figure 18: South America Insulin Biosimilars Industry Volume Share (%), by Country 2024 & 2032
- Figure 19: North America Insulin Biosimilars Industry Revenue (Million), by Country 2024 & 2032
- Figure 20: North America Insulin Biosimilars Industry Volume (K Unit), by Country 2024 & 2032
- Figure 21: North America Insulin Biosimilars Industry Revenue Share (%), by Country 2024 & 2032
- Figure 22: North America Insulin Biosimilars Industry Volume Share (%), by Country 2024 & 2032
- Figure 23: MEA Insulin Biosimilars Industry Revenue (Million), by Country 2024 & 2032
- Figure 24: MEA Insulin Biosimilars Industry Volume (K Unit), by Country 2024 & 2032
- Figure 25: MEA Insulin Biosimilars Industry Revenue Share (%), by Country 2024 & 2032
- Figure 26: MEA Insulin Biosimilars Industry Volume Share (%), by Country 2024 & 2032
- Figure 27: North America Insulin Biosimilars Industry Revenue (Million), by Drug 2024 & 2032
- Figure 28: North America Insulin Biosimilars Industry Volume (K Unit), by Drug 2024 & 2032
- Figure 29: North America Insulin Biosimilars Industry Revenue Share (%), by Drug 2024 & 2032
- Figure 30: North America Insulin Biosimilars Industry Volume Share (%), by Drug 2024 & 2032
- Figure 31: North America Insulin Biosimilars Industry Revenue (Million), by Device 2024 & 2032
- Figure 32: North America Insulin Biosimilars Industry Volume (K Unit), by Device 2024 & 2032
- Figure 33: North America Insulin Biosimilars Industry Revenue Share (%), by Device 2024 & 2032
- Figure 34: North America Insulin Biosimilars Industry Volume Share (%), by Device 2024 & 2032
- Figure 35: North America Insulin Biosimilars Industry Revenue (Million), by Country 2024 & 2032
- Figure 36: North America Insulin Biosimilars Industry Volume (K Unit), by Country 2024 & 2032
- Figure 37: North America Insulin Biosimilars Industry Revenue Share (%), by Country 2024 & 2032
- Figure 38: North America Insulin Biosimilars Industry Volume Share (%), by Country 2024 & 2032
- Figure 39: Europe Insulin Biosimilars Industry Revenue (Million), by Drug 2024 & 2032
- Figure 40: Europe Insulin Biosimilars Industry Volume (K Unit), by Drug 2024 & 2032
- Figure 41: Europe Insulin Biosimilars Industry Revenue Share (%), by Drug 2024 & 2032
- Figure 42: Europe Insulin Biosimilars Industry Volume Share (%), by Drug 2024 & 2032
- Figure 43: Europe Insulin Biosimilars Industry Revenue (Million), by Device 2024 & 2032
- Figure 44: Europe Insulin Biosimilars Industry Volume (K Unit), by Device 2024 & 2032
- Figure 45: Europe Insulin Biosimilars Industry Revenue Share (%), by Device 2024 & 2032
- Figure 46: Europe Insulin Biosimilars Industry Volume Share (%), by Device 2024 & 2032
- Figure 47: Europe Insulin Biosimilars Industry Revenue (Million), by Country 2024 & 2032
- Figure 48: Europe Insulin Biosimilars Industry Volume (K Unit), by Country 2024 & 2032
- Figure 49: Europe Insulin Biosimilars Industry Revenue Share (%), by Country 2024 & 2032
- Figure 50: Europe Insulin Biosimilars Industry Volume Share (%), by Country 2024 & 2032
- Figure 51: Asia Pacific Insulin Biosimilars Industry Revenue (Million), by Drug 2024 & 2032
- Figure 52: Asia Pacific Insulin Biosimilars Industry Volume (K Unit), by Drug 2024 & 2032
- Figure 53: Asia Pacific Insulin Biosimilars Industry Revenue Share (%), by Drug 2024 & 2032
- Figure 54: Asia Pacific Insulin Biosimilars Industry Volume Share (%), by Drug 2024 & 2032
- Figure 55: Asia Pacific Insulin Biosimilars Industry Revenue (Million), by Device 2024 & 2032
- Figure 56: Asia Pacific Insulin Biosimilars Industry Volume (K Unit), by Device 2024 & 2032
- Figure 57: Asia Pacific Insulin Biosimilars Industry Revenue Share (%), by Device 2024 & 2032
- Figure 58: Asia Pacific Insulin Biosimilars Industry Volume Share (%), by Device 2024 & 2032
- Figure 59: Asia Pacific Insulin Biosimilars Industry Revenue (Million), by Country 2024 & 2032
- Figure 60: Asia Pacific Insulin Biosimilars Industry Volume (K Unit), by Country 2024 & 2032
- Figure 61: Asia Pacific Insulin Biosimilars Industry Revenue Share (%), by Country 2024 & 2032
- Figure 62: Asia Pacific Insulin Biosimilars Industry Volume Share (%), by Country 2024 & 2032
- Figure 63: Latin America Insulin Biosimilars Industry Revenue (Million), by Drug 2024 & 2032
- Figure 64: Latin America Insulin Biosimilars Industry Volume (K Unit), by Drug 2024 & 2032
- Figure 65: Latin America Insulin Biosimilars Industry Revenue Share (%), by Drug 2024 & 2032
- Figure 66: Latin America Insulin Biosimilars Industry Volume Share (%), by Drug 2024 & 2032
- Figure 67: Latin America Insulin Biosimilars Industry Revenue (Million), by Device 2024 & 2032
- Figure 68: Latin America Insulin Biosimilars Industry Volume (K Unit), by Device 2024 & 2032
- Figure 69: Latin America Insulin Biosimilars Industry Revenue Share (%), by Device 2024 & 2032
- Figure 70: Latin America Insulin Biosimilars Industry Volume Share (%), by Device 2024 & 2032
- Figure 71: Latin America Insulin Biosimilars Industry Revenue (Million), by Country 2024 & 2032
- Figure 72: Latin America Insulin Biosimilars Industry Volume (K Unit), by Country 2024 & 2032
- Figure 73: Latin America Insulin Biosimilars Industry Revenue Share (%), by Country 2024 & 2032
- Figure 74: Latin America Insulin Biosimilars Industry Volume Share (%), by Country 2024 & 2032
- Figure 75: Middle East and Africa Insulin Biosimilars Industry Revenue (Million), by Drug 2024 & 2032
- Figure 76: Middle East and Africa Insulin Biosimilars Industry Volume (K Unit), by Drug 2024 & 2032
- Figure 77: Middle East and Africa Insulin Biosimilars Industry Revenue Share (%), by Drug 2024 & 2032
- Figure 78: Middle East and Africa Insulin Biosimilars Industry Volume Share (%), by Drug 2024 & 2032
- Figure 79: Middle East and Africa Insulin Biosimilars Industry Revenue (Million), by Device 2024 & 2032
- Figure 80: Middle East and Africa Insulin Biosimilars Industry Volume (K Unit), by Device 2024 & 2032
- Figure 81: Middle East and Africa Insulin Biosimilars Industry Revenue Share (%), by Device 2024 & 2032
- Figure 82: Middle East and Africa Insulin Biosimilars Industry Volume Share (%), by Device 2024 & 2032
- Figure 83: Middle East and Africa Insulin Biosimilars Industry Revenue (Million), by Country 2024 & 2032
- Figure 84: Middle East and Africa Insulin Biosimilars Industry Volume (K Unit), by Country 2024 & 2032
- Figure 85: Middle East and Africa Insulin Biosimilars Industry Revenue Share (%), by Country 2024 & 2032
- Figure 86: Middle East and Africa Insulin Biosimilars Industry Volume Share (%), by Country 2024 & 2032
List of Tables
- Table 1: Global Insulin Biosimilars Industry Revenue Million Forecast, by Region 2019 & 2032
- Table 2: Global Insulin Biosimilars Industry Volume K Unit Forecast, by Region 2019 & 2032
- Table 3: Global Insulin Biosimilars Industry Revenue Million Forecast, by Drug 2019 & 2032
- Table 4: Global Insulin Biosimilars Industry Volume K Unit Forecast, by Drug 2019 & 2032
- Table 5: Global Insulin Biosimilars Industry Revenue Million Forecast, by Device 2019 & 2032
- Table 6: Global Insulin Biosimilars Industry Volume K Unit Forecast, by Device 2019 & 2032
- Table 7: Global Insulin Biosimilars Industry Revenue Million Forecast, by Region 2019 & 2032
- Table 8: Global Insulin Biosimilars Industry Volume K Unit Forecast, by Region 2019 & 2032
- Table 9: Global Insulin Biosimilars Industry Revenue Million Forecast, by Country 2019 & 2032
- Table 10: Global Insulin Biosimilars Industry Volume K Unit Forecast, by Country 2019 & 2032
- Table 11: United States Insulin Biosimilars Industry Revenue (Million) Forecast, by Application 2019 & 2032
- Table 12: United States Insulin Biosimilars Industry Volume (K Unit) Forecast, by Application 2019 & 2032
- Table 13: Canada Insulin Biosimilars Industry Revenue (Million) Forecast, by Application 2019 & 2032
- Table 14: Canada Insulin Biosimilars Industry Volume (K Unit) Forecast, by Application 2019 & 2032
- Table 15: Mexico Insulin Biosimilars Industry Revenue (Million) Forecast, by Application 2019 & 2032
- Table 16: Mexico Insulin Biosimilars Industry Volume (K Unit) Forecast, by Application 2019 & 2032
- Table 17: Global Insulin Biosimilars Industry Revenue Million Forecast, by Country 2019 & 2032
- Table 18: Global Insulin Biosimilars Industry Volume K Unit Forecast, by Country 2019 & 2032
- Table 19: Germany Insulin Biosimilars Industry Revenue (Million) Forecast, by Application 2019 & 2032
- Table 20: Germany Insulin Biosimilars Industry Volume (K Unit) Forecast, by Application 2019 & 2032
- Table 21: United Kingdom Insulin Biosimilars Industry Revenue (Million) Forecast, by Application 2019 & 2032
- Table 22: United Kingdom Insulin Biosimilars Industry Volume (K Unit) Forecast, by Application 2019 & 2032
- Table 23: France Insulin Biosimilars Industry Revenue (Million) Forecast, by Application 2019 & 2032
- Table 24: France Insulin Biosimilars Industry Volume (K Unit) Forecast, by Application 2019 & 2032
- Table 25: Spain Insulin Biosimilars Industry Revenue (Million) Forecast, by Application 2019 & 2032
- Table 26: Spain Insulin Biosimilars Industry Volume (K Unit) Forecast, by Application 2019 & 2032
- Table 27: Italy Insulin Biosimilars Industry Revenue (Million) Forecast, by Application 2019 & 2032
- Table 28: Italy Insulin Biosimilars Industry Volume (K Unit) Forecast, by Application 2019 & 2032
- Table 29: Spain Insulin Biosimilars Industry Revenue (Million) Forecast, by Application 2019 & 2032
- Table 30: Spain Insulin Biosimilars Industry Volume (K Unit) Forecast, by Application 2019 & 2032
- Table 31: Belgium Insulin Biosimilars Industry Revenue (Million) Forecast, by Application 2019 & 2032
- Table 32: Belgium Insulin Biosimilars Industry Volume (K Unit) Forecast, by Application 2019 & 2032
- Table 33: Netherland Insulin Biosimilars Industry Revenue (Million) Forecast, by Application 2019 & 2032
- Table 34: Netherland Insulin Biosimilars Industry Volume (K Unit) Forecast, by Application 2019 & 2032
- Table 35: Nordics Insulin Biosimilars Industry Revenue (Million) Forecast, by Application 2019 & 2032
- Table 36: Nordics Insulin Biosimilars Industry Volume (K Unit) Forecast, by Application 2019 & 2032
- Table 37: Rest of Europe Insulin Biosimilars Industry Revenue (Million) Forecast, by Application 2019 & 2032
- Table 38: Rest of Europe Insulin Biosimilars Industry Volume (K Unit) Forecast, by Application 2019 & 2032
- Table 39: Global Insulin Biosimilars Industry Revenue Million Forecast, by Country 2019 & 2032
- Table 40: Global Insulin Biosimilars Industry Volume K Unit Forecast, by Country 2019 & 2032
- Table 41: China Insulin Biosimilars Industry Revenue (Million) Forecast, by Application 2019 & 2032
- Table 42: China Insulin Biosimilars Industry Volume (K Unit) Forecast, by Application 2019 & 2032
- Table 43: Japan Insulin Biosimilars Industry Revenue (Million) Forecast, by Application 2019 & 2032
- Table 44: Japan Insulin Biosimilars Industry Volume (K Unit) Forecast, by Application 2019 & 2032
- Table 45: India Insulin Biosimilars Industry Revenue (Million) Forecast, by Application 2019 & 2032
- Table 46: India Insulin Biosimilars Industry Volume (K Unit) Forecast, by Application 2019 & 2032
- Table 47: South Korea Insulin Biosimilars Industry Revenue (Million) Forecast, by Application 2019 & 2032
- Table 48: South Korea Insulin Biosimilars Industry Volume (K Unit) Forecast, by Application 2019 & 2032
- Table 49: Southeast Asia Insulin Biosimilars Industry Revenue (Million) Forecast, by Application 2019 & 2032
- Table 50: Southeast Asia Insulin Biosimilars Industry Volume (K Unit) Forecast, by Application 2019 & 2032
- Table 51: Australia Insulin Biosimilars Industry Revenue (Million) Forecast, by Application 2019 & 2032
- Table 52: Australia Insulin Biosimilars Industry Volume (K Unit) Forecast, by Application 2019 & 2032
- Table 53: Indonesia Insulin Biosimilars Industry Revenue (Million) Forecast, by Application 2019 & 2032
- Table 54: Indonesia Insulin Biosimilars Industry Volume (K Unit) Forecast, by Application 2019 & 2032
- Table 55: Phillipes Insulin Biosimilars Industry Revenue (Million) Forecast, by Application 2019 & 2032
- Table 56: Phillipes Insulin Biosimilars Industry Volume (K Unit) Forecast, by Application 2019 & 2032
- Table 57: Singapore Insulin Biosimilars Industry Revenue (Million) Forecast, by Application 2019 & 2032
- Table 58: Singapore Insulin Biosimilars Industry Volume (K Unit) Forecast, by Application 2019 & 2032
- Table 59: Thailandc Insulin Biosimilars Industry Revenue (Million) Forecast, by Application 2019 & 2032
- Table 60: Thailandc Insulin Biosimilars Industry Volume (K Unit) Forecast, by Application 2019 & 2032
- Table 61: Rest of Asia Pacific Insulin Biosimilars Industry Revenue (Million) Forecast, by Application 2019 & 2032
- Table 62: Rest of Asia Pacific Insulin Biosimilars Industry Volume (K Unit) Forecast, by Application 2019 & 2032
- Table 63: Global Insulin Biosimilars Industry Revenue Million Forecast, by Country 2019 & 2032
- Table 64: Global Insulin Biosimilars Industry Volume K Unit Forecast, by Country 2019 & 2032
- Table 65: Brazil Insulin Biosimilars Industry Revenue (Million) Forecast, by Application 2019 & 2032
- Table 66: Brazil Insulin Biosimilars Industry Volume (K Unit) Forecast, by Application 2019 & 2032
- Table 67: Argentina Insulin Biosimilars Industry Revenue (Million) Forecast, by Application 2019 & 2032
- Table 68: Argentina Insulin Biosimilars Industry Volume (K Unit) Forecast, by Application 2019 & 2032
- Table 69: Peru Insulin Biosimilars Industry Revenue (Million) Forecast, by Application 2019 & 2032
- Table 70: Peru Insulin Biosimilars Industry Volume (K Unit) Forecast, by Application 2019 & 2032
- Table 71: Chile Insulin Biosimilars Industry Revenue (Million) Forecast, by Application 2019 & 2032
- Table 72: Chile Insulin Biosimilars Industry Volume (K Unit) Forecast, by Application 2019 & 2032
- Table 73: Colombia Insulin Biosimilars Industry Revenue (Million) Forecast, by Application 2019 & 2032
- Table 74: Colombia Insulin Biosimilars Industry Volume (K Unit) Forecast, by Application 2019 & 2032
- Table 75: Ecuador Insulin Biosimilars Industry Revenue (Million) Forecast, by Application 2019 & 2032
- Table 76: Ecuador Insulin Biosimilars Industry Volume (K Unit) Forecast, by Application 2019 & 2032
- Table 77: Venezuela Insulin Biosimilars Industry Revenue (Million) Forecast, by Application 2019 & 2032
- Table 78: Venezuela Insulin Biosimilars Industry Volume (K Unit) Forecast, by Application 2019 & 2032
- Table 79: Rest of South America Insulin Biosimilars Industry Revenue (Million) Forecast, by Application 2019 & 2032
- Table 80: Rest of South America Insulin Biosimilars Industry Volume (K Unit) Forecast, by Application 2019 & 2032
- Table 81: Global Insulin Biosimilars Industry Revenue Million Forecast, by Country 2019 & 2032
- Table 82: Global Insulin Biosimilars Industry Volume K Unit Forecast, by Country 2019 & 2032
- Table 83: United States Insulin Biosimilars Industry Revenue (Million) Forecast, by Application 2019 & 2032
- Table 84: United States Insulin Biosimilars Industry Volume (K Unit) Forecast, by Application 2019 & 2032
- Table 85: Canada Insulin Biosimilars Industry Revenue (Million) Forecast, by Application 2019 & 2032
- Table 86: Canada Insulin Biosimilars Industry Volume (K Unit) Forecast, by Application 2019 & 2032
- Table 87: Mexico Insulin Biosimilars Industry Revenue (Million) Forecast, by Application 2019 & 2032
- Table 88: Mexico Insulin Biosimilars Industry Volume (K Unit) Forecast, by Application 2019 & 2032
- Table 89: Global Insulin Biosimilars Industry Revenue Million Forecast, by Country 2019 & 2032
- Table 90: Global Insulin Biosimilars Industry Volume K Unit Forecast, by Country 2019 & 2032
- Table 91: United Arab Emirates Insulin Biosimilars Industry Revenue (Million) Forecast, by Application 2019 & 2032
- Table 92: United Arab Emirates Insulin Biosimilars Industry Volume (K Unit) Forecast, by Application 2019 & 2032
- Table 93: Saudi Arabia Insulin Biosimilars Industry Revenue (Million) Forecast, by Application 2019 & 2032
- Table 94: Saudi Arabia Insulin Biosimilars Industry Volume (K Unit) Forecast, by Application 2019 & 2032
- Table 95: South Africa Insulin Biosimilars Industry Revenue (Million) Forecast, by Application 2019 & 2032
- Table 96: South Africa Insulin Biosimilars Industry Volume (K Unit) Forecast, by Application 2019 & 2032
- Table 97: Rest of Middle East and Africa Insulin Biosimilars Industry Revenue (Million) Forecast, by Application 2019 & 2032
- Table 98: Rest of Middle East and Africa Insulin Biosimilars Industry Volume (K Unit) Forecast, by Application 2019 & 2032
- Table 99: Global Insulin Biosimilars Industry Revenue Million Forecast, by Drug 2019 & 2032
- Table 100: Global Insulin Biosimilars Industry Volume K Unit Forecast, by Drug 2019 & 2032
- Table 101: Global Insulin Biosimilars Industry Revenue Million Forecast, by Device 2019 & 2032
- Table 102: Global Insulin Biosimilars Industry Volume K Unit Forecast, by Device 2019 & 2032
- Table 103: Global Insulin Biosimilars Industry Revenue Million Forecast, by Country 2019 & 2032
- Table 104: Global Insulin Biosimilars Industry Volume K Unit Forecast, by Country 2019 & 2032
- Table 105: United States Insulin Biosimilars Industry Revenue (Million) Forecast, by Application 2019 & 2032
- Table 106: United States Insulin Biosimilars Industry Volume (K Unit) Forecast, by Application 2019 & 2032
- Table 107: Canada Insulin Biosimilars Industry Revenue (Million) Forecast, by Application 2019 & 2032
- Table 108: Canada Insulin Biosimilars Industry Volume (K Unit) Forecast, by Application 2019 & 2032
- Table 109: Rest of North America Insulin Biosimilars Industry Revenue (Million) Forecast, by Application 2019 & 2032
- Table 110: Rest of North America Insulin Biosimilars Industry Volume (K Unit) Forecast, by Application 2019 & 2032
- Table 111: Global Insulin Biosimilars Industry Revenue Million Forecast, by Drug 2019 & 2032
- Table 112: Global Insulin Biosimilars Industry Volume K Unit Forecast, by Drug 2019 & 2032
- Table 113: Global Insulin Biosimilars Industry Revenue Million Forecast, by Device 2019 & 2032
- Table 114: Global Insulin Biosimilars Industry Volume K Unit Forecast, by Device 2019 & 2032
- Table 115: Global Insulin Biosimilars Industry Revenue Million Forecast, by Country 2019 & 2032
- Table 116: Global Insulin Biosimilars Industry Volume K Unit Forecast, by Country 2019 & 2032
- Table 117: Germany Insulin Biosimilars Industry Revenue (Million) Forecast, by Application 2019 & 2032
- Table 118: Germany Insulin Biosimilars Industry Volume (K Unit) Forecast, by Application 2019 & 2032
- Table 119: United Kingdom Insulin Biosimilars Industry Revenue (Million) Forecast, by Application 2019 & 2032
- Table 120: United Kingdom Insulin Biosimilars Industry Volume (K Unit) Forecast, by Application 2019 & 2032
- Table 121: France Insulin Biosimilars Industry Revenue (Million) Forecast, by Application 2019 & 2032
- Table 122: France Insulin Biosimilars Industry Volume (K Unit) Forecast, by Application 2019 & 2032
- Table 123: Russia Insulin Biosimilars Industry Revenue (Million) Forecast, by Application 2019 & 2032
- Table 124: Russia Insulin Biosimilars Industry Volume (K Unit) Forecast, by Application 2019 & 2032
- Table 125: Spain Insulin Biosimilars Industry Revenue (Million) Forecast, by Application 2019 & 2032
- Table 126: Spain Insulin Biosimilars Industry Volume (K Unit) Forecast, by Application 2019 & 2032
- Table 127: Italy Insulin Biosimilars Industry Revenue (Million) Forecast, by Application 2019 & 2032
- Table 128: Italy Insulin Biosimilars Industry Volume (K Unit) Forecast, by Application 2019 & 2032
- Table 129: Rest of Europe Insulin Biosimilars Industry Revenue (Million) Forecast, by Application 2019 & 2032
- Table 130: Rest of Europe Insulin Biosimilars Industry Volume (K Unit) Forecast, by Application 2019 & 2032
- Table 131: Global Insulin Biosimilars Industry Revenue Million Forecast, by Drug 2019 & 2032
- Table 132: Global Insulin Biosimilars Industry Volume K Unit Forecast, by Drug 2019 & 2032
- Table 133: Global Insulin Biosimilars Industry Revenue Million Forecast, by Device 2019 & 2032
- Table 134: Global Insulin Biosimilars Industry Volume K Unit Forecast, by Device 2019 & 2032
- Table 135: Global Insulin Biosimilars Industry Revenue Million Forecast, by Country 2019 & 2032
- Table 136: Global Insulin Biosimilars Industry Volume K Unit Forecast, by Country 2019 & 2032
- Table 137: Australia Insulin Biosimilars Industry Revenue (Million) Forecast, by Application 2019 & 2032
- Table 138: Australia Insulin Biosimilars Industry Volume (K Unit) Forecast, by Application 2019 & 2032
- Table 139: India Insulin Biosimilars Industry Revenue (Million) Forecast, by Application 2019 & 2032
- Table 140: India Insulin Biosimilars Industry Volume (K Unit) Forecast, by Application 2019 & 2032
- Table 141: China Insulin Biosimilars Industry Revenue (Million) Forecast, by Application 2019 & 2032
- Table 142: China Insulin Biosimilars Industry Volume (K Unit) Forecast, by Application 2019 & 2032
- Table 143: Japan Insulin Biosimilars Industry Revenue (Million) Forecast, by Application 2019 & 2032
- Table 144: Japan Insulin Biosimilars Industry Volume (K Unit) Forecast, by Application 2019 & 2032
- Table 145: Malaysia Insulin Biosimilars Industry Revenue (Million) Forecast, by Application 2019 & 2032
- Table 146: Malaysia Insulin Biosimilars Industry Volume (K Unit) Forecast, by Application 2019 & 2032
- Table 147: South Korea Insulin Biosimilars Industry Revenue (Million) Forecast, by Application 2019 & 2032
- Table 148: South Korea Insulin Biosimilars Industry Volume (K Unit) Forecast, by Application 2019 & 2032
- Table 149: Thailand Insulin Biosimilars Industry Revenue (Million) Forecast, by Application 2019 & 2032
- Table 150: Thailand Insulin Biosimilars Industry Volume (K Unit) Forecast, by Application 2019 & 2032
- Table 151: Philippines Insulin Biosimilars Industry Revenue (Million) Forecast, by Application 2019 & 2032
- Table 152: Philippines Insulin Biosimilars Industry Volume (K Unit) Forecast, by Application 2019 & 2032
- Table 153: Vietnam Insulin Biosimilars Industry Revenue (Million) Forecast, by Application 2019 & 2032
- Table 154: Vietnam Insulin Biosimilars Industry Volume (K Unit) Forecast, by Application 2019 & 2032
- Table 155: Indonesia Insulin Biosimilars Industry Revenue (Million) Forecast, by Application 2019 & 2032
- Table 156: Indonesia Insulin Biosimilars Industry Volume (K Unit) Forecast, by Application 2019 & 2032
- Table 157: Rest of the Asia Pacific Insulin Biosimilars Industry Revenue (Million) Forecast, by Application 2019 & 2032
- Table 158: Rest of the Asia Pacific Insulin Biosimilars Industry Volume (K Unit) Forecast, by Application 2019 & 2032
- Table 159: Global Insulin Biosimilars Industry Revenue Million Forecast, by Drug 2019 & 2032
- Table 160: Global Insulin Biosimilars Industry Volume K Unit Forecast, by Drug 2019 & 2032
- Table 161: Global Insulin Biosimilars Industry Revenue Million Forecast, by Device 2019 & 2032
- Table 162: Global Insulin Biosimilars Industry Volume K Unit Forecast, by Device 2019 & 2032
- Table 163: Global Insulin Biosimilars Industry Revenue Million Forecast, by Country 2019 & 2032
- Table 164: Global Insulin Biosimilars Industry Volume K Unit Forecast, by Country 2019 & 2032
- Table 165: Brazil Insulin Biosimilars Industry Revenue (Million) Forecast, by Application 2019 & 2032
- Table 166: Brazil Insulin Biosimilars Industry Volume (K Unit) Forecast, by Application 2019 & 2032
- Table 167: Mexico Insulin Biosimilars Industry Revenue (Million) Forecast, by Application 2019 & 2032
- Table 168: Mexico Insulin Biosimilars Industry Volume (K Unit) Forecast, by Application 2019 & 2032
- Table 169: Rest of Latin America Insulin Biosimilars Industry Revenue (Million) Forecast, by Application 2019 & 2032
- Table 170: Rest of Latin America Insulin Biosimilars Industry Volume (K Unit) Forecast, by Application 2019 & 2032
- Table 171: Global Insulin Biosimilars Industry Revenue Million Forecast, by Drug 2019 & 2032
- Table 172: Global Insulin Biosimilars Industry Volume K Unit Forecast, by Drug 2019 & 2032
- Table 173: Global Insulin Biosimilars Industry Revenue Million Forecast, by Device 2019 & 2032
- Table 174: Global Insulin Biosimilars Industry Volume K Unit Forecast, by Device 2019 & 2032
- Table 175: Global Insulin Biosimilars Industry Revenue Million Forecast, by Country 2019 & 2032
- Table 176: Global Insulin Biosimilars Industry Volume K Unit Forecast, by Country 2019 & 2032
- Table 177: Saudi Arabia Insulin Biosimilars Industry Revenue (Million) Forecast, by Application 2019 & 2032
- Table 178: Saudi Arabia Insulin Biosimilars Industry Volume (K Unit) Forecast, by Application 2019 & 2032
- Table 179: Iran Insulin Biosimilars Industry Revenue (Million) Forecast, by Application 2019 & 2032
- Table 180: Iran Insulin Biosimilars Industry Volume (K Unit) Forecast, by Application 2019 & 2032
- Table 181: Egypt Insulin Biosimilars Industry Revenue (Million) Forecast, by Application 2019 & 2032
- Table 182: Egypt Insulin Biosimilars Industry Volume (K Unit) Forecast, by Application 2019 & 2032
- Table 183: Oman Insulin Biosimilars Industry Revenue (Million) Forecast, by Application 2019 & 2032
- Table 184: Oman Insulin Biosimilars Industry Volume (K Unit) Forecast, by Application 2019 & 2032
- Table 185: South Africa Insulin Biosimilars Industry Revenue (Million) Forecast, by Application 2019 & 2032
- Table 186: South Africa Insulin Biosimilars Industry Volume (K Unit) Forecast, by Application 2019 & 2032
- Table 187: Rest of the Middle East and Africa Insulin Biosimilars Industry Revenue (Million) Forecast, by Application 2019 & 2032
- Table 188: Rest of the Middle East and Africa Insulin Biosimilars Industry Volume (K Unit) Forecast, by Application 2019 & 2032
Frequently Asked Questions
1. What is the projected Compound Annual Growth Rate (CAGR) of the Insulin Biosimilars Industry?
The projected CAGR is approximately 3.73%.
2. Which companies are prominent players in the Insulin Biosimilars Industry?
Key companies in the market include Ypsomed, Julphar, Eli Lilly, Becton Dickinson, Exir, Medtronic, Sanofi Aventis, Biocon, Insulet, Novo Nordisk A/S.
3. What are the main segments of the Insulin Biosimilars Industry?
The market segments include Drug, Device.
4. Can you provide details about the market size?
The market size is estimated to be USD 67.45 Million as of 2022.
5. What are some drivers contributing to market growth?
; The Rise in Global Prevalence of Cases of Obesity due to Modern Sedentary Lifestyles; Rise in Awareness and Disposable Income in Developed Economies.
6. What are the notable trends driving market growth?
Type-1 Diabetes Population Driving the Market In The Forecast Period.
7. Are there any restraints impacting market growth?
; Highly Cost of Branded Products in Emerging Countries; Severe Adverse Associated with Medication Including Seizures. Suicidal Attempts and Even Death; Adoption of Traditional Yoga and Herbal Products.
8. Can you provide examples of recent developments in the market?
May 2023: The U.S. Food and Drug Administration cleared the Beta Bionics iLet ACE Pump and the iLet Dosing Decision Software for people six years of age and older with type 1 diabetes. These two devices, along with a compatible FDA-cleared integrated continuous glucose monitor (iCGM), will form a new system called the iLet Bionic Pancreas. This new automated insulin dosing (AID) system uses an algorithm to determine and command insulin delivery.
9. What pricing options are available for accessing the report?
Pricing options include single-user, multi-user, and enterprise licenses priced at USD 4750, USD 5250, and USD 8750 respectively.
10. Is the market size provided in terms of value or volume?
The market size is provided in terms of value, measured in Million and volume, measured in K Unit.
11. Are there any specific market keywords associated with the report?
Yes, the market keyword associated with the report is "Insulin Biosimilars Industry," which aids in identifying and referencing the specific market segment covered.
12. How do I determine which pricing option suits my needs best?
The pricing options vary based on user requirements and access needs. Individual users may opt for single-user licenses, while businesses requiring broader access may choose multi-user or enterprise licenses for cost-effective access to the report.
13. Are there any additional resources or data provided in the Insulin Biosimilars Industry report?
While the report offers comprehensive insights, it's advisable to review the specific contents or supplementary materials provided to ascertain if additional resources or data are available.
14. How can I stay updated on further developments or reports in the Insulin Biosimilars Industry?
To stay informed about further developments, trends, and reports in the Insulin Biosimilars Industry, consider subscribing to industry newsletters, following relevant companies and organizations, or regularly checking reputable industry news sources and publications.
Methodology
Step 1 - Identification of Relevant Samples Size from Population Database


Step 2 - Approaches for Defining Global Market Size (Value, Volume* & Price*)

Note*: In applicable scenarios
Step 3 - Data Sources
Primary Research
- Web Analytics
- Survey Reports
- Research Institute
- Latest Research Reports
- Opinion Leaders
Secondary Research
- Annual Reports
- White Paper
- Latest Press Release
- Industry Association
- Paid Database
- Investor Presentations

Step 4 - Data Triangulation
Involves using different sources of information in order to increase the validity of a study
These sources are likely to be stakeholders in a program - participants, other researchers, program staff, other community members, and so on.
Then we put all data in single framework & apply various statistical tools to find out the dynamic on the market.
During the analysis stage, feedback from the stakeholder groups would be compared to determine areas of agreement as well as areas of divergence


