

Key Insights
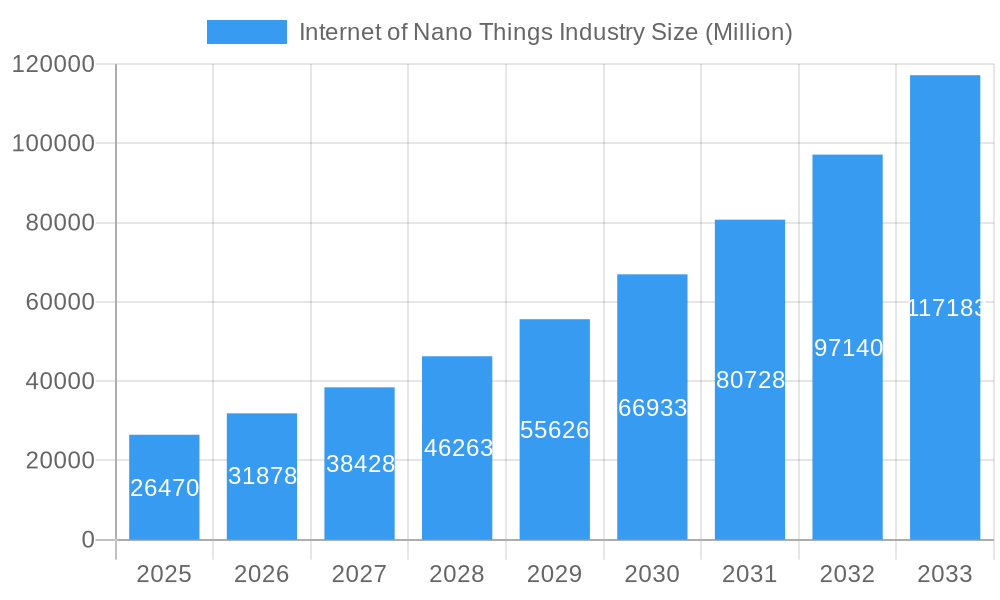
The Internet of Nano Things (IoNT) market is poised for explosive growth, projected to reach a substantial size within the forecast period (2025-2033). The 20.23% CAGR from 2019-2024 indicates a strong upward trajectory driven by several key factors. Miniaturization of sensors and actuators, coupled with advancements in nanomaterials and wireless communication technologies, are enabling the creation of incredibly small, low-power devices capable of sensing and interacting with their environment. This fuels adoption across diverse sectors, including healthcare (for personalized medicine and advanced diagnostics), logistics (for real-time tracking and efficient supply chains), and manufacturing (for predictive maintenance and process optimization). The increasing demand for automation, improved efficiency, and real-time data analysis across various industries contributes significantly to the market's expansion. Moreover, ongoing research and development in nanotechnology are continually unlocking new applications and improving the capabilities of IoNT devices, further solidifying its growth potential.
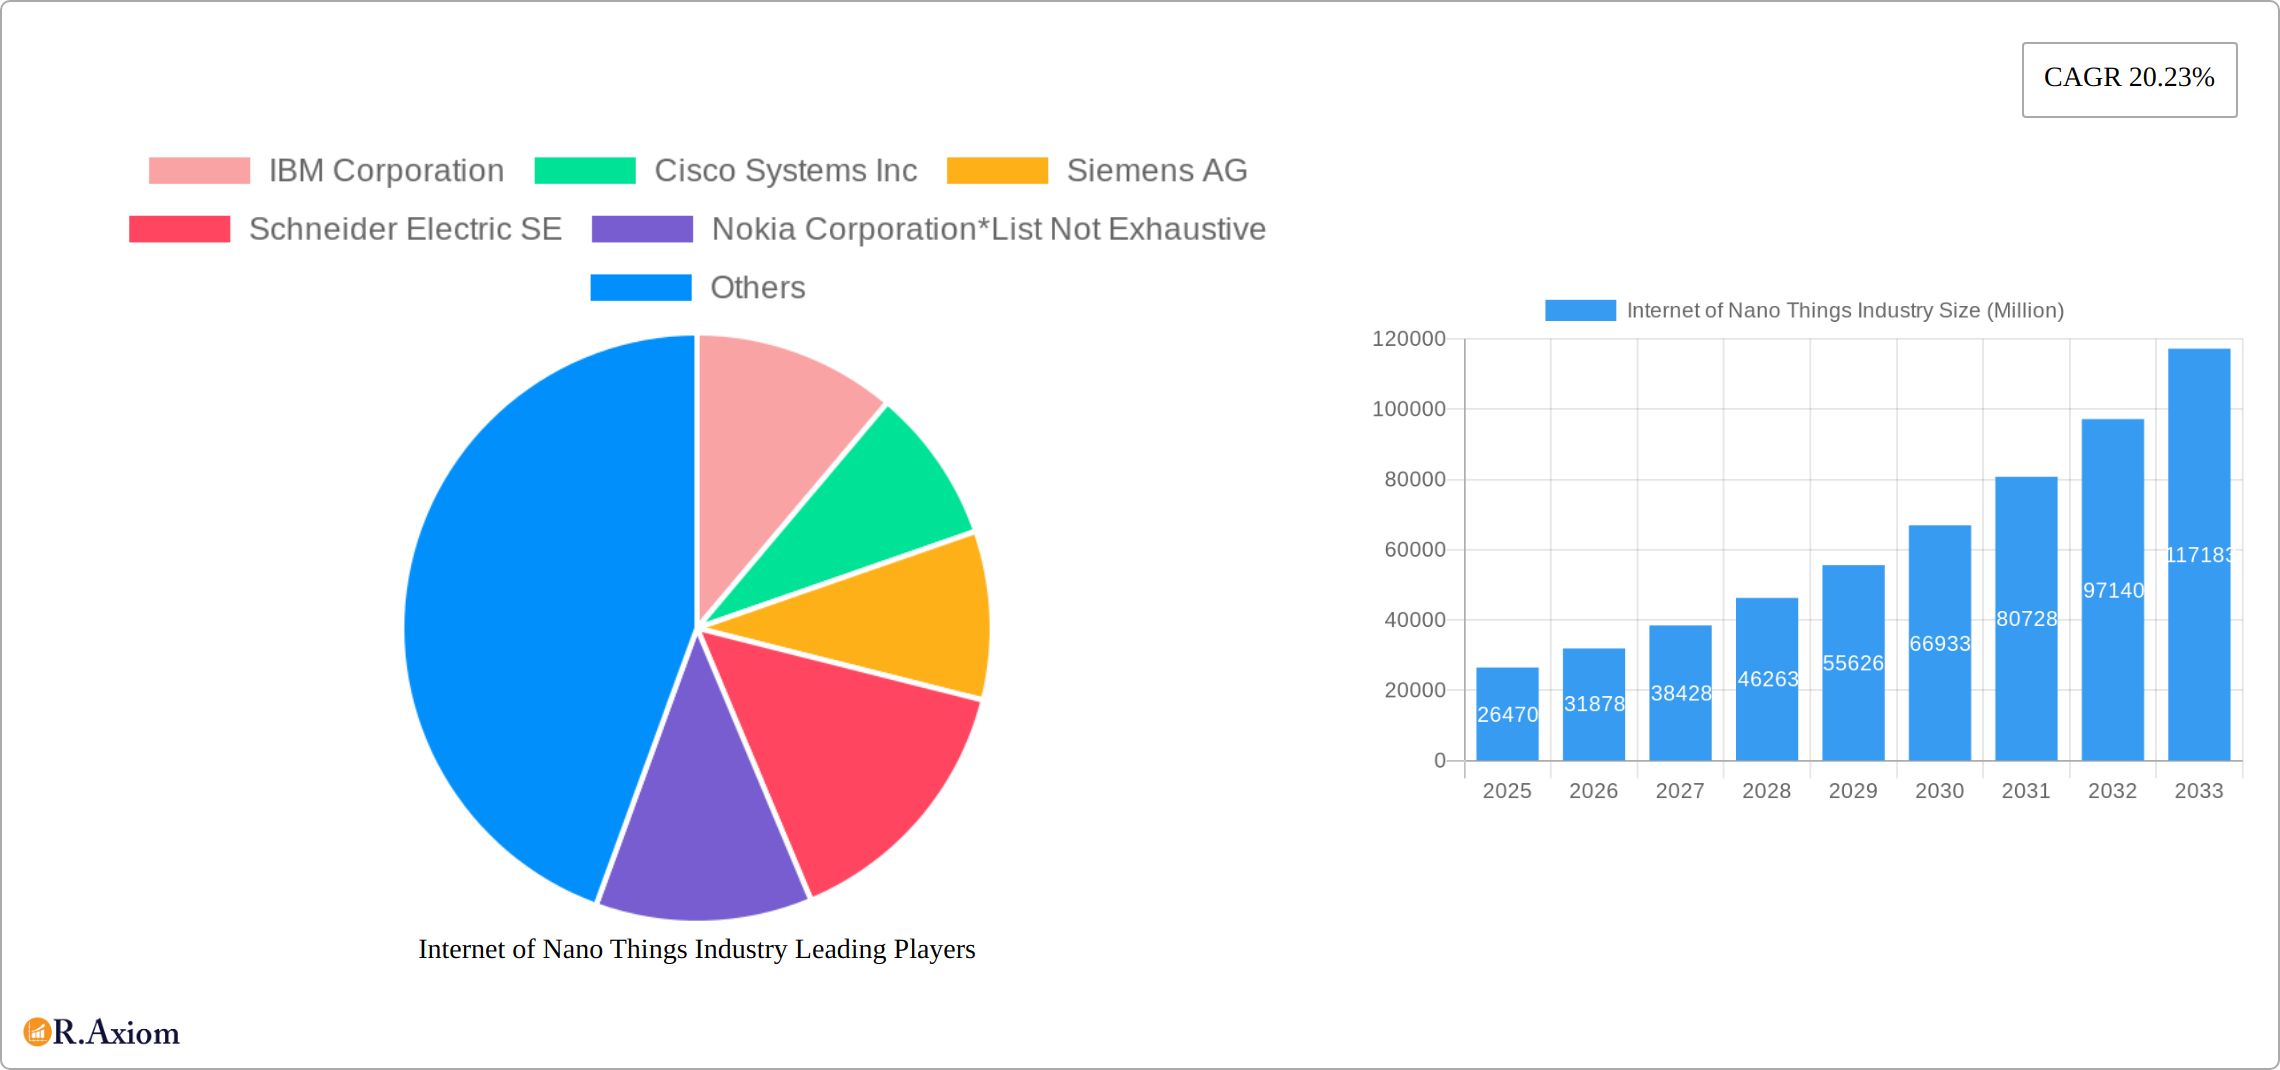
Internet of Nano Things Industry Market Size (In Billion)
The market segmentation reveals a significant contribution from both hardware and software components. Hardware encompasses the nano-scale sensors, actuators, and communication modules, while software is crucial for data processing, analysis, and integration with larger systems. Connectivity/services, including secure data transmission and cloud-based platforms, are also vital components. The healthcare segment likely dominates the end-user market due to the immense potential of IoNT in personalized medicine and disease monitoring. However, other sectors like logistics, manufacturing, and energy and power are experiencing rapid growth, reflecting the broad applicability of this technology. While challenges such as interoperability issues and data security concerns exist, ongoing technological advancements and increasing industry collaboration are actively addressing these hurdles, paving the way for a rapidly evolving and expanding IoNT market. Major players like IBM, Cisco, Siemens, and Qualcomm are strategically investing in research and development, driving innovation and competition within this dynamic sector.
Internet of Nano Things Industry Company Market Share
Internet of Nano Things (IoNT) Industry Market Report: 2019-2033
This comprehensive report provides a detailed analysis of the Internet of Nano Things (IoNT) industry, offering invaluable insights for stakeholders seeking to navigate this rapidly evolving landscape. Covering the period from 2019 to 2033, with a focus on 2025, this report examines market size, growth drivers, challenges, and opportunities, providing a robust foundation for informed strategic decision-making. The report projects a market value exceeding xx Million by 2033.
Internet of Nano Things Industry Market Concentration & Innovation
The Internet of Nano Things (IoNT) industry presents a moderately concentrated market landscape, with several key players commanding substantial market shares. However, the competitive dynamics are fluid, constantly reshaped by continuous innovation and a brisk pace of mergers and acquisitions (M&A) activity. Leading companies such as IBM Corporation, Cisco Systems Inc., Siemens AG, Schneider Electric SE, and Nokia Corporation, among others, are spearheading technological advancements and expanding market penetration. Market share analysis projects that the top five players will collectively hold approximately [Insert Percentage]% of the market by 2025, with the remaining share distributed across numerous smaller participants. The total value of M&A deals within the sector from 2019 to 2024 is estimated at approximately [Insert Amount] million, signifying a high degree of industry consolidation and substantial investment.
- Market Concentration: Top 5 players projected to hold [Insert Percentage]% market share (2025).
- Innovation Drivers: Significant advancements in nanotechnology, artificial intelligence (AI), and enhanced connectivity are the primary catalysts for innovation.
- Regulatory Frameworks: Emerging regulations concerning data privacy and security are significantly influencing market growth trajectories.
- Product Substitutes: The current lack of direct substitutes bolsters the market potential of IoNT solutions.
- End-User Trends: The burgeoning adoption of IoNT across healthcare, manufacturing, and logistics sectors is driving robust demand.
- M&A Activity: The substantial M&A activity ([Insert Amount] million in 2019-2024) underscores the ongoing market consolidation.
Internet of Nano Things Industry Industry Trends & Insights
The IoNT market is experiencing robust growth, fueled by continuous technological advancements and increasing demand across diverse sectors. The Compound Annual Growth Rate (CAGR) is projected to be [Insert Percentage]% during the forecast period (2025-2033). Market penetration is steadily expanding, with higher adoption rates observed in developed economies. Technological disruptions, such as the development of more efficient and cost-effective nanomaterials and sensors, are creating lucrative new opportunities. A notable shift in consumer preferences towards smaller, more efficient, and interconnected devices further accelerates market expansion. Competitive dynamics are characterized by a blend of collaboration and competition, with companies forging strategic alliances while simultaneously striving for market leadership. The growing emphasis on sustainability and energy efficiency is also stimulating adoption within sectors like energy and power.
Dominant Markets & Segments in Internet of Nano Things Industry
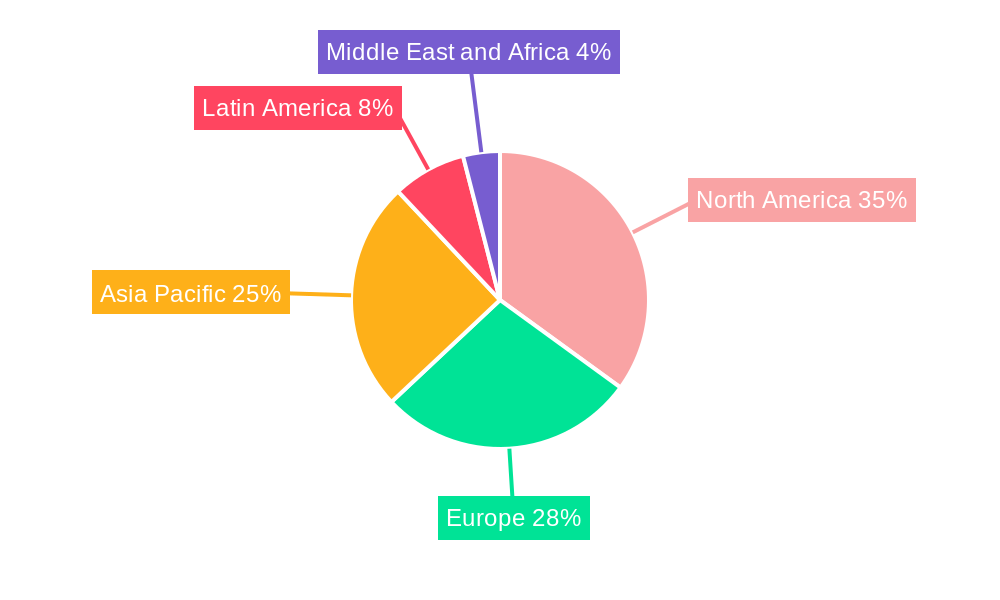
The IoNT market is geographically diverse, with significant growth observed across various regions. However, North America currently holds the largest market share, driven by strong technological advancements, substantial investments in R&D, and early adoption by various industries.
By Component:
- Hardware: The hardware segment is projected to dominate, driven by the need for advanced sensors and actuators.
- Software: The software segment is experiencing rapid growth due to the increasing demand for data analytics and management solutions.
- Connectivity/Services: This segment is witnessing substantial growth due to the need for reliable and secure connectivity solutions.
By End User:
- Healthcare: The healthcare segment is experiencing exponential growth due to applications in diagnostics, drug delivery, and personalized medicine.
- Manufacturing: This segment is experiencing a steady increase in adoption as manufacturers leverage IoNT to improve efficiency and quality control.
- Logistics: Adoption of IoNT in the logistics sector is growing due to the need for improved tracking, monitoring, and automation.
Key Drivers (Examples):
- Economic Policies: Government initiatives promoting technological innovation and digital transformation are boosting market growth.
- Infrastructure: Investments in advanced communication infrastructure are crucial for IoNT adoption and expansion.
Internet of Nano Things Industry Product Developments
Recent product innovations within the IoNT sector encompass advancements in nanosensors, nanomaterials, and low-power communication technologies. These innovations are driving the development of more efficient, cost-effective, and versatile applications across various industries. Key competitive advantages include improved accuracy, reduced power consumption, and enhanced data processing capabilities. The integration of AI and machine learning is further enhancing the capabilities of IoNT devices, facilitating real-time data analysis and enabling more informed decision-making.
Report Scope & Segmentation Analysis
This report provides a comprehensive segmentation of the IoNT market based on component (Hardware, Software, Connectivity/Services) and end-user (Healthcare, Logistics, Defense and Aerospace, Manufacturing, Energy and Power, Retail, Other End Users). Each segment's growth projections, market size, and competitive dynamics are analyzed in detail, offering a clear understanding of market opportunities and potential challenges.
- Hardware Segment: xx Million in 2025, projected to reach xx Million by 2033.
- Software Segment: xx Million in 2025, projected to reach xx Million by 2033.
- Connectivity/Services Segment: xx Million in 2025, projected to reach xx Million by 2033.
- Healthcare Segment: xx Million in 2025, projected to reach xx Million by 2033.
- Logistics Segment: xx Million in 2025, projected to reach xx Million by 2033.
- Other Segments: Similar detailed breakdowns provided for remaining segments.
Key Drivers of Internet of Nano Things Industry Growth
The growth of the IoNT industry is primarily propelled by technological advancements, favorable economic conditions, and supportive regulatory frameworks. The development of highly sensitive and selective nanosensors is leading to the creation of novel applications across a wide range of sectors. Government investments in research and development are further stimulating innovation. Moreover, the increasing demand for real-time data analytics and automation is driving adoption across multiple industries.
Challenges in the Internet of Nano Things Industry Sector
The IoNT industry faces several significant challenges, including regulatory hurdles related to data privacy and security, supply chain complexities associated with the production of nanomaterials, and intense competitive pressures from both established players and new entrants. These challenges can impact market growth and necessitate careful strategic planning and robust risk mitigation strategies. The high cost of development and implementation can also limit wider adoption, particularly in resource-constrained environments.
Emerging Opportunities in Internet of Nano Things Industry
Emerging opportunities in the IoNT industry include the development of new applications in areas such as environmental monitoring, precision agriculture, and smart cities. The integration of IoNT with other emerging technologies, such as artificial intelligence and blockchain, will create new avenues for growth. Expanding market penetration in emerging economies presents a significant opportunity for expansion.
Leading Players in the Internet of Nano Things Industry Market
- IBM Corporation
- Cisco Systems Inc
- Siemens AG
- Schneider Electric SE
- Nokia Corporation
- Juniper Networks Inc
- Qualcomm Inc
- SAP SE
- Intel Corporation
Key Developments in Internet of Nano Things Industry Industry
- February 2023: Siemens Digital Industries Software launched the latest update of its NX software, leveraging AI and advanced simulation, enhancing design and manufacturing capabilities. This signifies a significant boost to the software segment of the IoNT market.
- January 2023: Advanced Material Development (AMD) secured an InnovateUK grant to develop next-generation nanomaterial-based gas sensors, highlighting advancements in sensor technology and potential applications in environmental monitoring and industrial safety.
Strategic Outlook for Internet of Nano Things Industry Market
The IoNT market is poised for substantial growth in the coming years, driven by technological advancements, increasing demand across various sectors, and favorable economic conditions. Strategic partnerships, acquisitions, and investments in research and development will play a key role in shaping the future of the industry. The focus on developing sustainable and energy-efficient solutions will further drive market growth. Companies with strong technological capabilities, innovative product offerings, and robust supply chains will be well-positioned to capitalize on the emerging opportunities.
Internet of Nano Things Industry Segmentation
-
1. Component
- 1.1. Hardware
- 1.2. Software
- 1.3. Connectivity/Services
-
2. End User
- 2.1. Healthcare
- 2.2. Logistics
- 2.3. Defense and Aerospace
- 2.4. Manufacturing
- 2.5. Energy and Power
- 2.6. Retail
- 2.7. Other End Users
Internet of Nano Things Industry Segmentation By Geography
- 1. North America
- 2. Europe
- 3. Asia
- 4. Australia and New Zealand
- 5. Latin America
- 6. Middle East and Africa
Internet of Nano Things Industry Regional Market Share
Geographic Coverage of Internet of Nano Things Industry
Internet of Nano Things Industry REPORT HIGHLIGHTS
| Aspects | Details |
|---|---|
| Study Period | 2020-2034 |
| Base Year | 2025 |
| Estimated Year | 2026 |
| Forecast Period | 2026-2034 |
| Historical Period | 2020-2025 |
| Growth Rate | CAGR of 20.23% from 2020-2034 |
| Segmentation |
|
Table of Contents
- 1. Introduction
- 1.1. Research Scope
- 1.2. Market Segmentation
- 1.3. Research Methodology
- 1.4. Definitions and Assumptions
- 2. Executive Summary
- 2.1. Introduction
- 3. Market Dynamics
- 3.1. Introduction
- 3.2. Market Drivers
- 3.2.1. Wide Connectivity in Devices; Emergence of Nanotechnology
- 3.3. Market Restrains
- 3.3.1. Security Concerns; High Costs of the Technology
- 3.4. Market Trends
- 3.4.1. Healthcare Industry is Expected to Hold a Significant Share
- 4. Market Factor Analysis
- 4.1. Porters Five Forces
- 4.2. Supply/Value Chain
- 4.3. PESTEL analysis
- 4.4. Market Entropy
- 4.5. Patent/Trademark Analysis
- 5. Global Internet of Nano Things Industry Analysis, Insights and Forecast, 2020-2032
- 5.1. Market Analysis, Insights and Forecast - by Component
- 5.1.1. Hardware
- 5.1.2. Software
- 5.1.3. Connectivity/Services
- 5.2. Market Analysis, Insights and Forecast - by End User
- 5.2.1. Healthcare
- 5.2.2. Logistics
- 5.2.3. Defense and Aerospace
- 5.2.4. Manufacturing
- 5.2.5. Energy and Power
- 5.2.6. Retail
- 5.2.7. Other End Users
- 5.3. Market Analysis, Insights and Forecast - by Region
- 5.3.1. North America
- 5.3.2. Europe
- 5.3.3. Asia
- 5.3.4. Australia and New Zealand
- 5.3.5. Latin America
- 5.3.6. Middle East and Africa
- 5.1. Market Analysis, Insights and Forecast - by Component
- 6. North America Internet of Nano Things Industry Analysis, Insights and Forecast, 2020-2032
- 6.1. Market Analysis, Insights and Forecast - by Component
- 6.1.1. Hardware
- 6.1.2. Software
- 6.1.3. Connectivity/Services
- 6.2. Market Analysis, Insights and Forecast - by End User
- 6.2.1. Healthcare
- 6.2.2. Logistics
- 6.2.3. Defense and Aerospace
- 6.2.4. Manufacturing
- 6.2.5. Energy and Power
- 6.2.6. Retail
- 6.2.7. Other End Users
- 6.1. Market Analysis, Insights and Forecast - by Component
- 7. Europe Internet of Nano Things Industry Analysis, Insights and Forecast, 2020-2032
- 7.1. Market Analysis, Insights and Forecast - by Component
- 7.1.1. Hardware
- 7.1.2. Software
- 7.1.3. Connectivity/Services
- 7.2. Market Analysis, Insights and Forecast - by End User
- 7.2.1. Healthcare
- 7.2.2. Logistics
- 7.2.3. Defense and Aerospace
- 7.2.4. Manufacturing
- 7.2.5. Energy and Power
- 7.2.6. Retail
- 7.2.7. Other End Users
- 7.1. Market Analysis, Insights and Forecast - by Component
- 8. Asia Internet of Nano Things Industry Analysis, Insights and Forecast, 2020-2032
- 8.1. Market Analysis, Insights and Forecast - by Component
- 8.1.1. Hardware
- 8.1.2. Software
- 8.1.3. Connectivity/Services
- 8.2. Market Analysis, Insights and Forecast - by End User
- 8.2.1. Healthcare
- 8.2.2. Logistics
- 8.2.3. Defense and Aerospace
- 8.2.4. Manufacturing
- 8.2.5. Energy and Power
- 8.2.6. Retail
- 8.2.7. Other End Users
- 8.1. Market Analysis, Insights and Forecast - by Component
- 9. Australia and New Zealand Internet of Nano Things Industry Analysis, Insights and Forecast, 2020-2032
- 9.1. Market Analysis, Insights and Forecast - by Component
- 9.1.1. Hardware
- 9.1.2. Software
- 9.1.3. Connectivity/Services
- 9.2. Market Analysis, Insights and Forecast - by End User
- 9.2.1. Healthcare
- 9.2.2. Logistics
- 9.2.3. Defense and Aerospace
- 9.2.4. Manufacturing
- 9.2.5. Energy and Power
- 9.2.6. Retail
- 9.2.7. Other End Users
- 9.1. Market Analysis, Insights and Forecast - by Component
- 10. Latin America Internet of Nano Things Industry Analysis, Insights and Forecast, 2020-2032
- 10.1. Market Analysis, Insights and Forecast - by Component
- 10.1.1. Hardware
- 10.1.2. Software
- 10.1.3. Connectivity/Services
- 10.2. Market Analysis, Insights and Forecast - by End User
- 10.2.1. Healthcare
- 10.2.2. Logistics
- 10.2.3. Defense and Aerospace
- 10.2.4. Manufacturing
- 10.2.5. Energy and Power
- 10.2.6. Retail
- 10.2.7. Other End Users
- 10.1. Market Analysis, Insights and Forecast - by Component
- 11. Middle East and Africa Internet of Nano Things Industry Analysis, Insights and Forecast, 2020-2032
- 11.1. Market Analysis, Insights and Forecast - by Component
- 11.1.1. Hardware
- 11.1.2. Software
- 11.1.3. Connectivity/Services
- 11.2. Market Analysis, Insights and Forecast - by End User
- 11.2.1. Healthcare
- 11.2.2. Logistics
- 11.2.3. Defense and Aerospace
- 11.2.4. Manufacturing
- 11.2.5. Energy and Power
- 11.2.6. Retail
- 11.2.7. Other End Users
- 11.1. Market Analysis, Insights and Forecast - by Component
- 12. Competitive Analysis
- 12.1. Global Market Share Analysis 2025
- 12.2. Company Profiles
- 12.2.1 IBM Corporation
- 12.2.1.1. Overview
- 12.2.1.2. Products
- 12.2.1.3. SWOT Analysis
- 12.2.1.4. Recent Developments
- 12.2.1.5. Financials (Based on Availability)
- 12.2.2 Cisco Systems Inc
- 12.2.2.1. Overview
- 12.2.2.2. Products
- 12.2.2.3. SWOT Analysis
- 12.2.2.4. Recent Developments
- 12.2.2.5. Financials (Based on Availability)
- 12.2.3 Siemens AG
- 12.2.3.1. Overview
- 12.2.3.2. Products
- 12.2.3.3. SWOT Analysis
- 12.2.3.4. Recent Developments
- 12.2.3.5. Financials (Based on Availability)
- 12.2.4 Schneider Electric SE
- 12.2.4.1. Overview
- 12.2.4.2. Products
- 12.2.4.3. SWOT Analysis
- 12.2.4.4. Recent Developments
- 12.2.4.5. Financials (Based on Availability)
- 12.2.5 Nokia Corporation*List Not Exhaustive
- 12.2.5.1. Overview
- 12.2.5.2. Products
- 12.2.5.3. SWOT Analysis
- 12.2.5.4. Recent Developments
- 12.2.5.5. Financials (Based on Availability)
- 12.2.6 Juniper Networks Inc
- 12.2.6.1. Overview
- 12.2.6.2. Products
- 12.2.6.3. SWOT Analysis
- 12.2.6.4. Recent Developments
- 12.2.6.5. Financials (Based on Availability)
- 12.2.7 Qualcomm Inc
- 12.2.7.1. Overview
- 12.2.7.2. Products
- 12.2.7.3. SWOT Analysis
- 12.2.7.4. Recent Developments
- 12.2.7.5. Financials (Based on Availability)
- 12.2.8 SAP SE
- 12.2.8.1. Overview
- 12.2.8.2. Products
- 12.2.8.3. SWOT Analysis
- 12.2.8.4. Recent Developments
- 12.2.8.5. Financials (Based on Availability)
- 12.2.9 Intel Corporation
- 12.2.9.1. Overview
- 12.2.9.2. Products
- 12.2.9.3. SWOT Analysis
- 12.2.9.4. Recent Developments
- 12.2.9.5. Financials (Based on Availability)
- 12.2.1 IBM Corporation
List of Figures
- Figure 1: Global Internet of Nano Things Industry Revenue Breakdown (Million, %) by Region 2025 & 2033
- Figure 2: North America Internet of Nano Things Industry Revenue (Million), by Component 2025 & 2033
- Figure 3: North America Internet of Nano Things Industry Revenue Share (%), by Component 2025 & 2033
- Figure 4: North America Internet of Nano Things Industry Revenue (Million), by End User 2025 & 2033
- Figure 5: North America Internet of Nano Things Industry Revenue Share (%), by End User 2025 & 2033
- Figure 6: North America Internet of Nano Things Industry Revenue (Million), by Country 2025 & 2033
- Figure 7: North America Internet of Nano Things Industry Revenue Share (%), by Country 2025 & 2033
- Figure 8: Europe Internet of Nano Things Industry Revenue (Million), by Component 2025 & 2033
- Figure 9: Europe Internet of Nano Things Industry Revenue Share (%), by Component 2025 & 2033
- Figure 10: Europe Internet of Nano Things Industry Revenue (Million), by End User 2025 & 2033
- Figure 11: Europe Internet of Nano Things Industry Revenue Share (%), by End User 2025 & 2033
- Figure 12: Europe Internet of Nano Things Industry Revenue (Million), by Country 2025 & 2033
- Figure 13: Europe Internet of Nano Things Industry Revenue Share (%), by Country 2025 & 2033
- Figure 14: Asia Internet of Nano Things Industry Revenue (Million), by Component 2025 & 2033
- Figure 15: Asia Internet of Nano Things Industry Revenue Share (%), by Component 2025 & 2033
- Figure 16: Asia Internet of Nano Things Industry Revenue (Million), by End User 2025 & 2033
- Figure 17: Asia Internet of Nano Things Industry Revenue Share (%), by End User 2025 & 2033
- Figure 18: Asia Internet of Nano Things Industry Revenue (Million), by Country 2025 & 2033
- Figure 19: Asia Internet of Nano Things Industry Revenue Share (%), by Country 2025 & 2033
- Figure 20: Australia and New Zealand Internet of Nano Things Industry Revenue (Million), by Component 2025 & 2033
- Figure 21: Australia and New Zealand Internet of Nano Things Industry Revenue Share (%), by Component 2025 & 2033
- Figure 22: Australia and New Zealand Internet of Nano Things Industry Revenue (Million), by End User 2025 & 2033
- Figure 23: Australia and New Zealand Internet of Nano Things Industry Revenue Share (%), by End User 2025 & 2033
- Figure 24: Australia and New Zealand Internet of Nano Things Industry Revenue (Million), by Country 2025 & 2033
- Figure 25: Australia and New Zealand Internet of Nano Things Industry Revenue Share (%), by Country 2025 & 2033
- Figure 26: Latin America Internet of Nano Things Industry Revenue (Million), by Component 2025 & 2033
- Figure 27: Latin America Internet of Nano Things Industry Revenue Share (%), by Component 2025 & 2033
- Figure 28: Latin America Internet of Nano Things Industry Revenue (Million), by End User 2025 & 2033
- Figure 29: Latin America Internet of Nano Things Industry Revenue Share (%), by End User 2025 & 2033
- Figure 30: Latin America Internet of Nano Things Industry Revenue (Million), by Country 2025 & 2033
- Figure 31: Latin America Internet of Nano Things Industry Revenue Share (%), by Country 2025 & 2033
- Figure 32: Middle East and Africa Internet of Nano Things Industry Revenue (Million), by Component 2025 & 2033
- Figure 33: Middle East and Africa Internet of Nano Things Industry Revenue Share (%), by Component 2025 & 2033
- Figure 34: Middle East and Africa Internet of Nano Things Industry Revenue (Million), by End User 2025 & 2033
- Figure 35: Middle East and Africa Internet of Nano Things Industry Revenue Share (%), by End User 2025 & 2033
- Figure 36: Middle East and Africa Internet of Nano Things Industry Revenue (Million), by Country 2025 & 2033
- Figure 37: Middle East and Africa Internet of Nano Things Industry Revenue Share (%), by Country 2025 & 2033
List of Tables
- Table 1: Global Internet of Nano Things Industry Revenue Million Forecast, by Component 2020 & 2033
- Table 2: Global Internet of Nano Things Industry Revenue Million Forecast, by End User 2020 & 2033
- Table 3: Global Internet of Nano Things Industry Revenue Million Forecast, by Region 2020 & 2033
- Table 4: Global Internet of Nano Things Industry Revenue Million Forecast, by Component 2020 & 2033
- Table 5: Global Internet of Nano Things Industry Revenue Million Forecast, by End User 2020 & 2033
- Table 6: Global Internet of Nano Things Industry Revenue Million Forecast, by Country 2020 & 2033
- Table 7: Global Internet of Nano Things Industry Revenue Million Forecast, by Component 2020 & 2033
- Table 8: Global Internet of Nano Things Industry Revenue Million Forecast, by End User 2020 & 2033
- Table 9: Global Internet of Nano Things Industry Revenue Million Forecast, by Country 2020 & 2033
- Table 10: Global Internet of Nano Things Industry Revenue Million Forecast, by Component 2020 & 2033
- Table 11: Global Internet of Nano Things Industry Revenue Million Forecast, by End User 2020 & 2033
- Table 12: Global Internet of Nano Things Industry Revenue Million Forecast, by Country 2020 & 2033
- Table 13: Global Internet of Nano Things Industry Revenue Million Forecast, by Component 2020 & 2033
- Table 14: Global Internet of Nano Things Industry Revenue Million Forecast, by End User 2020 & 2033
- Table 15: Global Internet of Nano Things Industry Revenue Million Forecast, by Country 2020 & 2033
- Table 16: Global Internet of Nano Things Industry Revenue Million Forecast, by Component 2020 & 2033
- Table 17: Global Internet of Nano Things Industry Revenue Million Forecast, by End User 2020 & 2033
- Table 18: Global Internet of Nano Things Industry Revenue Million Forecast, by Country 2020 & 2033
- Table 19: Global Internet of Nano Things Industry Revenue Million Forecast, by Component 2020 & 2033
- Table 20: Global Internet of Nano Things Industry Revenue Million Forecast, by End User 2020 & 2033
- Table 21: Global Internet of Nano Things Industry Revenue Million Forecast, by Country 2020 & 2033
Frequently Asked Questions
1. What is the projected Compound Annual Growth Rate (CAGR) of the Internet of Nano Things Industry?
The projected CAGR is approximately 20.23%.
2. Which companies are prominent players in the Internet of Nano Things Industry?
Key companies in the market include IBM Corporation, Cisco Systems Inc, Siemens AG, Schneider Electric SE, Nokia Corporation*List Not Exhaustive, Juniper Networks Inc, Qualcomm Inc, SAP SE, Intel Corporation.
3. What are the main segments of the Internet of Nano Things Industry?
The market segments include Component, End User.
4. Can you provide details about the market size?
The market size is estimated to be USD 26.47 Million as of 2022.
5. What are some drivers contributing to market growth?
Wide Connectivity in Devices; Emergence of Nanotechnology.
6. What are the notable trends driving market growth?
Healthcare Industry is Expected to Hold a Significant Share.
7. Are there any restraints impacting market growth?
Security Concerns; High Costs of the Technology.
8. Can you provide examples of recent developments in the market?
February 2023: Siemens Digital Industries Software launched the latest update of its industry-leading NX software, part of the Xcelerator portfolio of software and services. The newest update of NX software leverages advanced technologies, such as artificial intelligence (AI) and advanced simulation capabilities, while continuing to invest in significant productivity and capability enhancements to enable its community of designers, engineers, and manufacturers to innovate more quickly.
9. What pricing options are available for accessing the report?
Pricing options include single-user, multi-user, and enterprise licenses priced at USD 4750, USD 5250, and USD 8750 respectively.
10. Is the market size provided in terms of value or volume?
The market size is provided in terms of value, measured in Million.
11. Are there any specific market keywords associated with the report?
Yes, the market keyword associated with the report is "Internet of Nano Things Industry," which aids in identifying and referencing the specific market segment covered.
12. How do I determine which pricing option suits my needs best?
The pricing options vary based on user requirements and access needs. Individual users may opt for single-user licenses, while businesses requiring broader access may choose multi-user or enterprise licenses for cost-effective access to the report.
13. Are there any additional resources or data provided in the Internet of Nano Things Industry report?
While the report offers comprehensive insights, it's advisable to review the specific contents or supplementary materials provided to ascertain if additional resources or data are available.
14. How can I stay updated on further developments or reports in the Internet of Nano Things Industry?
To stay informed about further developments, trends, and reports in the Internet of Nano Things Industry, consider subscribing to industry newsletters, following relevant companies and organizations, or regularly checking reputable industry news sources and publications.
Methodology
Step 1 - Identification of Relevant Samples Size from Population Database


Step 2 - Approaches for Defining Global Market Size (Value, Volume* & Price*)

Note*: In applicable scenarios
Step 3 - Data Sources
Primary Research
- Web Analytics
- Survey Reports
- Research Institute
- Latest Research Reports
- Opinion Leaders
Secondary Research
- Annual Reports
- White Paper
- Latest Press Release
- Industry Association
- Paid Database
- Investor Presentations

Step 4 - Data Triangulation
Involves using different sources of information in order to increase the validity of a study
These sources are likely to be stakeholders in a program - participants, other researchers, program staff, other community members, and so on.
Then we put all data in single framework & apply various statistical tools to find out the dynamic on the market.
During the analysis stage, feedback from the stakeholder groups would be compared to determine areas of agreement as well as areas of divergence