
Key Insights
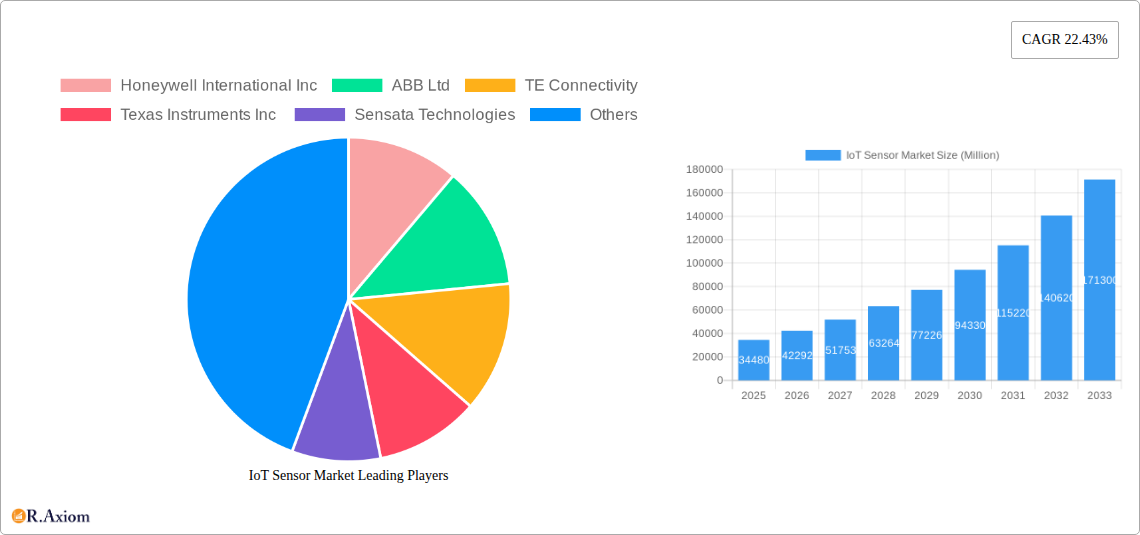
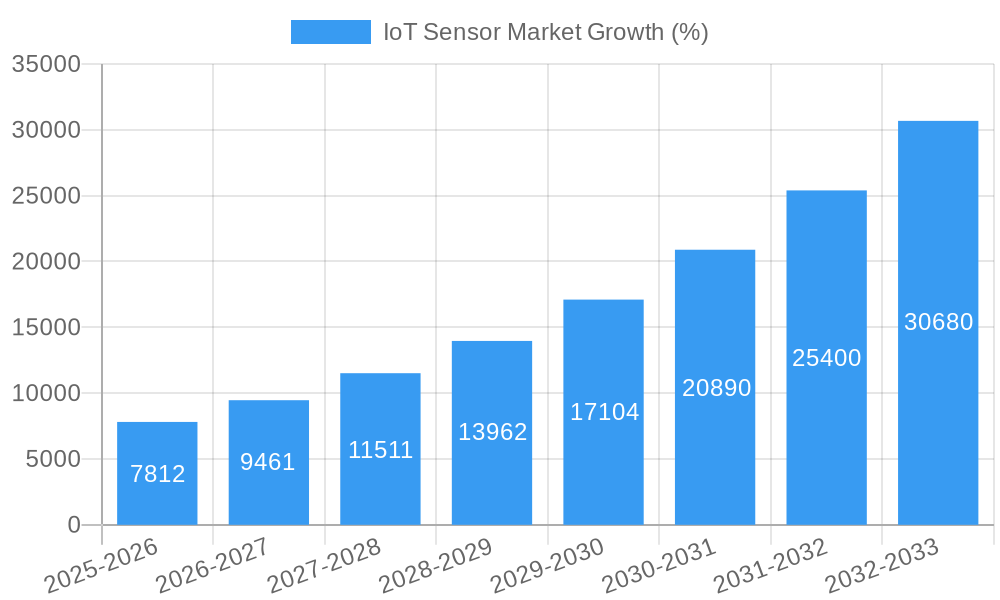
The global IoT sensor market, valued at $34.48 billion in 2025, is experiencing robust growth, projected to expand at a Compound Annual Growth Rate (CAGR) of 22.43% from 2025 to 2033. This significant expansion is fueled by several key drivers. The increasing adoption of smart devices and the Internet of Things (IoT) across diverse sectors like healthcare, automotive, and manufacturing is a primary catalyst. Advancements in sensor technology, leading to smaller, more energy-efficient, and cost-effective sensors, are further accelerating market growth. Furthermore, the rising demand for real-time data analytics and predictive maintenance in industrial applications significantly contributes to market expansion. The market is segmented by sensor type (pressure, temperature, chemical, motion/proximity, and others) and end-user industries. While the healthcare and automotive sectors are currently leading adopters, substantial growth is anticipated from the manufacturing and industrial sectors driven by Industry 4.0 initiatives and the need for enhanced operational efficiency and automation. Competitive landscape analysis reveals key players like Honeywell, ABB, TE Connectivity, and Texas Instruments, among others, actively shaping the market through innovation and strategic partnerships. Geographic expansion, particularly in rapidly developing economies within the Asia-Pacific region, presents significant opportunities for market growth in the coming years.
The market's restraints primarily involve challenges related to data security and privacy concerns surrounding the vast amount of data generated by IoT sensors. Interoperability issues among diverse sensor technologies also present a hurdle to seamless integration and widespread adoption. However, ongoing advancements in data security protocols and the development of standardized communication protocols are actively addressing these limitations. The market is also witnessing the emergence of new trends like AI-powered sensor analytics, enabling more sophisticated data interpretation and decision-making. The integration of edge computing capabilities within sensor networks is further enhancing real-time processing and reducing reliance on cloud infrastructure. This combination of technological advancements and increasing industry demand positions the IoT sensor market for sustained, high-growth trajectory throughout the forecast period.
IoT Sensor Market: A Comprehensive Report (2019-2033)
This in-depth report provides a comprehensive analysis of the IoT sensor market, covering market size, growth drivers, challenges, and opportunities from 2019 to 2033. It delves into key segments, leading players, and significant industry developments, offering actionable insights for stakeholders across the value chain. The report leverages extensive market research and data analysis to forecast market trends and provide strategic recommendations. The study period spans from 2019 to 2033, with 2025 serving as the base and estimated year.
IoT Sensor Market Market Concentration & Innovation
The IoT sensor market exhibits a moderately concentrated landscape, with a few major players holding significant market share. However, the market is also characterized by intense competition and continuous innovation, driven by the rapid advancement of sensor technologies and the expanding applications of IoT across various sectors. Key players such as Honeywell International Inc, ABB Ltd, TE Connectivity, Texas Instruments Inc, and Sensata Technologies are constantly striving for market differentiation through technological advancements, strategic partnerships, and mergers and acquisitions (M&A).
- Market Share: The top 5 players account for approximately xx% of the global market share in 2025. This share is projected to slightly decrease to xx% by 2033 due to the increasing entry of new players and the expansion of the market.
- Innovation Drivers: Miniaturization of sensors, enhanced power efficiency, improved data processing capabilities, and the development of advanced sensing technologies such as MEMS and LiDAR are pivotal drivers. Moreover, the increasing integration of AI and machine learning in IoT sensor systems further fuels innovation.
- Regulatory Frameworks: Government regulations concerning data privacy, cybersecurity, and industrial safety significantly impact the market. Compliance with these regulations becomes a crucial factor for market players.
- Product Substitutes: While no direct substitutes exist for IoT sensors, advancements in alternative technologies may affect specific sensor applications.
- End-User Trends: Growing demand for smart homes, smart cities, and industrial automation is driving the market’s expansion. The adoption of Industry 4.0 further accelerates the market growth across the manufacturing and industrial sectors.
- M&A Activities: The IoT sensor market witnesses a moderate level of M&A activity. Deal values vary depending on the size and scope of the acquired companies. In 2024, the total value of M&A deals in this sector was estimated at approximately $xx Million.
IoT Sensor Market Industry Trends & Insights
The IoT sensor market is experiencing robust growth, driven by factors such as the increasing adoption of smart devices, rising demand for real-time data analytics, and the growing need for improved operational efficiency across industries. The compound annual growth rate (CAGR) is projected to be xx% during the forecast period (2025-2033). Market penetration is increasing across various sectors, with the manufacturing/industrial segment exhibiting the highest growth.
Technological disruptions, such as the advent of 5G, are expected to significantly enhance the performance and capabilities of IoT sensor networks, boosting market expansion. Consumer preferences are shifting towards more energy-efficient and cost-effective sensors, creating opportunities for manufacturers to develop and launch innovative products. Competitive dynamics are intense, with companies focusing on product differentiation, strategic partnerships, and technological innovation to gain a competitive edge.
Dominant Markets & Segments in IoT Sensor Market
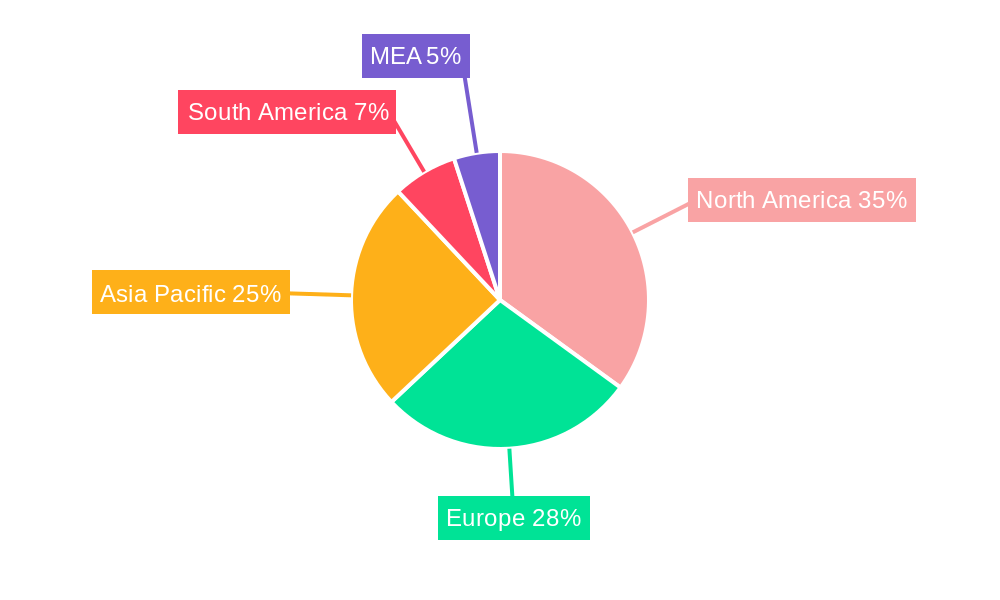
The Manufacturing/Industrial sector currently holds the largest market share in the IoT sensor market, followed by the Automotive and Transportation sector. Within sensor types, the Temperature and Pressure sensor segments dominate, accounting for a combined xx% of the market in 2025. This is expected to remain relatively stable throughout the forecast period. Geographic dominance varies across segments; however, North America and Europe currently account for the largest share of the global market.
- Key Drivers for Manufacturing/Industrial Dominance:
- Automation and digitalization initiatives in manufacturing processes.
- Growing demand for predictive maintenance and improved operational efficiency.
- Implementation of Industry 4.0 technologies.
- Key Drivers for Automotive/Transportation Dominance:
- Increasing adoption of Advanced Driver-Assistance Systems (ADAS) and autonomous vehicles.
- Rising demand for improved vehicle safety and performance monitoring.
- Stringent government regulations concerning vehicle emissions and fuel efficiency.
IoT Sensor Market Product Developments
Recent product innovations focus on enhanced accuracy, miniaturization, low power consumption, and improved connectivity. Sensors with advanced analytics capabilities, enabling real-time data processing and decision-making, are gaining traction. The market observes a strong focus on wireless connectivity options like Bluetooth, Wi-Fi, and LoRaWAN to improve deployment flexibility and reduce infrastructure costs. These advancements cater to diverse applications, offering competitive advantages through superior performance, cost-effectiveness, and ease of integration.
Report Scope & Segmentation Analysis
This report comprehensively segments the IoT sensor market based on type and end-user.
- Type: Pressure sensors, temperature sensors, chemical sensors, motion/proximity sensors, and other types (e.g., humidity, light, gas sensors). The market size for each type is projected to grow at varying rates depending on technological advancements and market demand.
- End-User: Healthcare, automotive and transportation, manufacturing/industrial, and other end-users (e.g., agriculture, smart cities, consumer electronics). Each segment showcases distinct growth trajectories, shaped by specific application demands and adoption rates.
Key Drivers of IoT Sensor Market Growth
The IoT sensor market’s growth is fueled by several key factors: the increasing adoption of IoT across various sectors, the demand for real-time data analytics, technological advancements leading to improved sensor performance and affordability, and supportive government policies promoting digitalization. Examples include the rising adoption of smart city initiatives, industrial automation projects, and the deployment of connected devices in various applications.
Challenges in the IoT Sensor Market Sector
Challenges include maintaining data security and privacy, managing the complexity of IoT networks, dealing with interoperability issues among different sensor technologies, and addressing the cost-effectiveness of deploying and maintaining large-scale sensor networks. Supply chain disruptions and the shortage of skilled professionals further pose significant hurdles to market expansion. The total estimated financial impact of these challenges in 2024 was approximately $xx Million.
Emerging Opportunities in IoT Sensor Market
Emerging opportunities stem from the growing adoption of AI and machine learning in sensor data analytics, the development of low-power wide-area network (LPWAN) technologies for wider sensor deployment, and the increasing demand for smart agriculture and environmental monitoring solutions. Furthermore, the rise of edge computing opens avenues for real-time data processing closer to the source, improving efficiency and reducing latency.
Leading Players in the IoT Sensor Market Market
- Honeywell International Inc
- ABB Ltd
- TE Connectivity
- Texas Instruments Inc
- Sensata Technologies
- Schneider Electric SE
- STMicroelectronics NV
- Robert Bosch GmbH
- OMRON Corporation
- TDK Corporation
Key Developments in IoT Sensor Market Industry
- September 2021: Heijman deployed 20,000 LoRaWAN smart building sensors, showcasing the growing adoption of IoT in the construction sector for enhanced building management.
- August 2021: Bouchaine Vineyards integrated Cisco's sensor technology for precision viticulture, highlighting the use of IoT sensors in agriculture for optimized resource management.
- September 2020: Amazon launched a mailbox sensor, illustrating the expanding consumer applications of IoT sensors and the potential for market expansion in smart home solutions.
Strategic Outlook for IoT Sensor Market Market
The IoT sensor market exhibits significant growth potential, driven by continuous technological advancements, increasing digitalization across industries, and the growing adoption of IoT across various applications. The market is expected to witness sustained growth throughout the forecast period, with opportunities arising from innovations in sensor technology, improved data analytics capabilities, and the expansion of IoT into new sectors and applications. Companies focused on innovation, strategic partnerships, and efficient supply chain management are well-positioned to capitalize on the market’s growth potential.
IoT Sensor Market Segmentation
-
1. Type
- 1.1. Pressure
- 1.2. Temperature
- 1.3. Chemical
- 1.4. Motion/Proximity
- 1.5. Other Types
-
2. End User
- 2.1. Healthcare
- 2.2. Automotive and Transportation
- 2.3. Manufacturing / Industrial
- 2.4. Other End Users
IoT Sensor Market Segmentation By Geography
-
1. North America
- 1.1. United States
- 1.2. Canada
-
2. Europe
- 2.1. United Kingdom
- 2.2. France
- 2.3. Germany
- 2.4. Rest of Europe
-
3. Asia Pacific
- 3.1. China
- 3.2. Japan
- 3.3. South Korea
- 3.4. India
- 3.5. Rest of the Asia Pacific
-
4. Rest of the World
- 4.1. Latin America
- 4.2. Middle East
IoT Sensor Market REPORT HIGHLIGHTS
| Aspects | Details |
|---|---|
| Study Period | 2019-2033 |
| Base Year | 2024 |
| Estimated Year | 2025 |
| Forecast Period | 2025-2033 |
| Historical Period | 2019-2024 |
| Growth Rate | CAGR of 22.43% from 2019-2033 |
| Segmentation |
|
Table of Contents
- 1. Introduction
- 1.1. Research Scope
- 1.2. Market Segmentation
- 1.3. Research Methodology
- 1.4. Definitions and Assumptions
- 2. Executive Summary
- 2.1. Introduction
- 3. Market Dynamics
- 3.1. Introduction
- 3.2. Market Drivers
- 3.2.1. Rising use of IoT sensors due to reduced cost and size; Increasing applications of Industry 4.0 and connected devices
- 3.3. Market Restrains
- 3.3.1. Rising concerns related to data security
- 3.4. Market Trends
- 3.4.1. Automotive and Transportation Industry to Drive the Market Growth
- 4. Market Factor Analysis
- 4.1. Porters Five Forces
- 4.2. Supply/Value Chain
- 4.3. PESTEL analysis
- 4.4. Market Entropy
- 4.5. Patent/Trademark Analysis
- 5. Global IoT Sensor Market Analysis, Insights and Forecast, 2019-2031
- 5.1. Market Analysis, Insights and Forecast - by Type
- 5.1.1. Pressure
- 5.1.2. Temperature
- 5.1.3. Chemical
- 5.1.4. Motion/Proximity
- 5.1.5. Other Types
- 5.2. Market Analysis, Insights and Forecast - by End User
- 5.2.1. Healthcare
- 5.2.2. Automotive and Transportation
- 5.2.3. Manufacturing / Industrial
- 5.2.4. Other End Users
- 5.3. Market Analysis, Insights and Forecast - by Region
- 5.3.1. North America
- 5.3.2. Europe
- 5.3.3. Asia Pacific
- 5.3.4. Rest of the World
- 5.1. Market Analysis, Insights and Forecast - by Type
- 6. North America IoT Sensor Market Analysis, Insights and Forecast, 2019-2031
- 6.1. Market Analysis, Insights and Forecast - by Type
- 6.1.1. Pressure
- 6.1.2. Temperature
- 6.1.3. Chemical
- 6.1.4. Motion/Proximity
- 6.1.5. Other Types
- 6.2. Market Analysis, Insights and Forecast - by End User
- 6.2.1. Healthcare
- 6.2.2. Automotive and Transportation
- 6.2.3. Manufacturing / Industrial
- 6.2.4. Other End Users
- 6.1. Market Analysis, Insights and Forecast - by Type
- 7. Europe IoT Sensor Market Analysis, Insights and Forecast, 2019-2031
- 7.1. Market Analysis, Insights and Forecast - by Type
- 7.1.1. Pressure
- 7.1.2. Temperature
- 7.1.3. Chemical
- 7.1.4. Motion/Proximity
- 7.1.5. Other Types
- 7.2. Market Analysis, Insights and Forecast - by End User
- 7.2.1. Healthcare
- 7.2.2. Automotive and Transportation
- 7.2.3. Manufacturing / Industrial
- 7.2.4. Other End Users
- 7.1. Market Analysis, Insights and Forecast - by Type
- 8. Asia Pacific IoT Sensor Market Analysis, Insights and Forecast, 2019-2031
- 8.1. Market Analysis, Insights and Forecast - by Type
- 8.1.1. Pressure
- 8.1.2. Temperature
- 8.1.3. Chemical
- 8.1.4. Motion/Proximity
- 8.1.5. Other Types
- 8.2. Market Analysis, Insights and Forecast - by End User
- 8.2.1. Healthcare
- 8.2.2. Automotive and Transportation
- 8.2.3. Manufacturing / Industrial
- 8.2.4. Other End Users
- 8.1. Market Analysis, Insights and Forecast - by Type
- 9. Rest of the World IoT Sensor Market Analysis, Insights and Forecast, 2019-2031
- 9.1. Market Analysis, Insights and Forecast - by Type
- 9.1.1. Pressure
- 9.1.2. Temperature
- 9.1.3. Chemical
- 9.1.4. Motion/Proximity
- 9.1.5. Other Types
- 9.2. Market Analysis, Insights and Forecast - by End User
- 9.2.1. Healthcare
- 9.2.2. Automotive and Transportation
- 9.2.3. Manufacturing / Industrial
- 9.2.4. Other End Users
- 9.1. Market Analysis, Insights and Forecast - by Type
- 10. North America IoT Sensor Market Analysis, Insights and Forecast, 2019-2031
- 10.1. Market Analysis, Insights and Forecast - By Country/Sub-region
- 10.1.1. undefined
- 11. Europe IoT Sensor Market Analysis, Insights and Forecast, 2019-2031
- 11.1. Market Analysis, Insights and Forecast - By Country/Sub-region
- 11.1.1. undefined
- 12. Asia Pacific IoT Sensor Market Analysis, Insights and Forecast, 2019-2031
- 12.1. Market Analysis, Insights and Forecast - By Country/Sub-region
- 12.1.1. undefined
- 13. South America IoT Sensor Market Analysis, Insights and Forecast, 2019-2031
- 13.1. Market Analysis, Insights and Forecast - By Country/Sub-region
- 13.1.1. undefined
- 14. North America IoT Sensor Market Analysis, Insights and Forecast, 2019-2031
- 14.1. Market Analysis, Insights and Forecast - By Country/Sub-region
- 14.1.1. undefined
- 15. MEA IoT Sensor Market Analysis, Insights and Forecast, 2019-2031
- 15.1. Market Analysis, Insights and Forecast - By Country/Sub-region
- 15.1.1. undefined
- 16. Competitive Analysis
- 16.1. Global Market Share Analysis 2024
- 16.2. Company Profiles
- 16.2.1 Honeywell International Inc
- 16.2.1.1. Overview
- 16.2.1.2. Products
- 16.2.1.3. SWOT Analysis
- 16.2.1.4. Recent Developments
- 16.2.1.5. Financials (Based on Availability)
- 16.2.2 ABB Ltd
- 16.2.2.1. Overview
- 16.2.2.2. Products
- 16.2.2.3. SWOT Analysis
- 16.2.2.4. Recent Developments
- 16.2.2.5. Financials (Based on Availability)
- 16.2.3 TE Connectivity
- 16.2.3.1. Overview
- 16.2.3.2. Products
- 16.2.3.3. SWOT Analysis
- 16.2.3.4. Recent Developments
- 16.2.3.5. Financials (Based on Availability)
- 16.2.4 Texas Instruments Inc
- 16.2.4.1. Overview
- 16.2.4.2. Products
- 16.2.4.3. SWOT Analysis
- 16.2.4.4. Recent Developments
- 16.2.4.5. Financials (Based on Availability)
- 16.2.5 Sensata Technologies
- 16.2.5.1. Overview
- 16.2.5.2. Products
- 16.2.5.3. SWOT Analysis
- 16.2.5.4. Recent Developments
- 16.2.5.5. Financials (Based on Availability)
- 16.2.6 Schneider Electric SE
- 16.2.6.1. Overview
- 16.2.6.2. Products
- 16.2.6.3. SWOT Analysis
- 16.2.6.4. Recent Developments
- 16.2.6.5. Financials (Based on Availability)
- 16.2.7 STMicroelectronics NV
- 16.2.7.1. Overview
- 16.2.7.2. Products
- 16.2.7.3. SWOT Analysis
- 16.2.7.4. Recent Developments
- 16.2.7.5. Financials (Based on Availability)
- 16.2.8 Robert Bosch GmbH
- 16.2.8.1. Overview
- 16.2.8.2. Products
- 16.2.8.3. SWOT Analysis
- 16.2.8.4. Recent Developments
- 16.2.8.5. Financials (Based on Availability)
- 16.2.9 OMRON Corporation
- 16.2.9.1. Overview
- 16.2.9.2. Products
- 16.2.9.3. SWOT Analysis
- 16.2.9.4. Recent Developments
- 16.2.9.5. Financials (Based on Availability)
- 16.2.10 TDK Corporation
- 16.2.10.1. Overview
- 16.2.10.2. Products
- 16.2.10.3. SWOT Analysis
- 16.2.10.4. Recent Developments
- 16.2.10.5. Financials (Based on Availability)
- 16.2.1 Honeywell International Inc
List of Figures
- Figure 1: Global IoT Sensor Market Revenue Breakdown (Million, %) by Region 2024 & 2032
- Figure 2: Global IoT Sensor Market Volume Breakdown (K Unit, %) by Region 2024 & 2032
- Figure 3: North America IoT Sensor Market Revenue (Million), by Country 2024 & 2032
- Figure 4: North America IoT Sensor Market Volume (K Unit), by Country 2024 & 2032
- Figure 5: North America IoT Sensor Market Revenue Share (%), by Country 2024 & 2032
- Figure 6: North America IoT Sensor Market Volume Share (%), by Country 2024 & 2032
- Figure 7: Europe IoT Sensor Market Revenue (Million), by Country 2024 & 2032
- Figure 8: Europe IoT Sensor Market Volume (K Unit), by Country 2024 & 2032
- Figure 9: Europe IoT Sensor Market Revenue Share (%), by Country 2024 & 2032
- Figure 10: Europe IoT Sensor Market Volume Share (%), by Country 2024 & 2032
- Figure 11: Asia Pacific IoT Sensor Market Revenue (Million), by Country 2024 & 2032
- Figure 12: Asia Pacific IoT Sensor Market Volume (K Unit), by Country 2024 & 2032
- Figure 13: Asia Pacific IoT Sensor Market Revenue Share (%), by Country 2024 & 2032
- Figure 14: Asia Pacific IoT Sensor Market Volume Share (%), by Country 2024 & 2032
- Figure 15: South America IoT Sensor Market Revenue (Million), by Country 2024 & 2032
- Figure 16: South America IoT Sensor Market Volume (K Unit), by Country 2024 & 2032
- Figure 17: South America IoT Sensor Market Revenue Share (%), by Country 2024 & 2032
- Figure 18: South America IoT Sensor Market Volume Share (%), by Country 2024 & 2032
- Figure 19: North America IoT Sensor Market Revenue (Million), by Country 2024 & 2032
- Figure 20: North America IoT Sensor Market Volume (K Unit), by Country 2024 & 2032
- Figure 21: North America IoT Sensor Market Revenue Share (%), by Country 2024 & 2032
- Figure 22: North America IoT Sensor Market Volume Share (%), by Country 2024 & 2032
- Figure 23: MEA IoT Sensor Market Revenue (Million), by Country 2024 & 2032
- Figure 24: MEA IoT Sensor Market Volume (K Unit), by Country 2024 & 2032
- Figure 25: MEA IoT Sensor Market Revenue Share (%), by Country 2024 & 2032
- Figure 26: MEA IoT Sensor Market Volume Share (%), by Country 2024 & 2032
- Figure 27: North America IoT Sensor Market Revenue (Million), by Type 2024 & 2032
- Figure 28: North America IoT Sensor Market Volume (K Unit), by Type 2024 & 2032
- Figure 29: North America IoT Sensor Market Revenue Share (%), by Type 2024 & 2032
- Figure 30: North America IoT Sensor Market Volume Share (%), by Type 2024 & 2032
- Figure 31: North America IoT Sensor Market Revenue (Million), by End User 2024 & 2032
- Figure 32: North America IoT Sensor Market Volume (K Unit), by End User 2024 & 2032
- Figure 33: North America IoT Sensor Market Revenue Share (%), by End User 2024 & 2032
- Figure 34: North America IoT Sensor Market Volume Share (%), by End User 2024 & 2032
- Figure 35: North America IoT Sensor Market Revenue (Million), by Country 2024 & 2032
- Figure 36: North America IoT Sensor Market Volume (K Unit), by Country 2024 & 2032
- Figure 37: North America IoT Sensor Market Revenue Share (%), by Country 2024 & 2032
- Figure 38: North America IoT Sensor Market Volume Share (%), by Country 2024 & 2032
- Figure 39: Europe IoT Sensor Market Revenue (Million), by Type 2024 & 2032
- Figure 40: Europe IoT Sensor Market Volume (K Unit), by Type 2024 & 2032
- Figure 41: Europe IoT Sensor Market Revenue Share (%), by Type 2024 & 2032
- Figure 42: Europe IoT Sensor Market Volume Share (%), by Type 2024 & 2032
- Figure 43: Europe IoT Sensor Market Revenue (Million), by End User 2024 & 2032
- Figure 44: Europe IoT Sensor Market Volume (K Unit), by End User 2024 & 2032
- Figure 45: Europe IoT Sensor Market Revenue Share (%), by End User 2024 & 2032
- Figure 46: Europe IoT Sensor Market Volume Share (%), by End User 2024 & 2032
- Figure 47: Europe IoT Sensor Market Revenue (Million), by Country 2024 & 2032
- Figure 48: Europe IoT Sensor Market Volume (K Unit), by Country 2024 & 2032
- Figure 49: Europe IoT Sensor Market Revenue Share (%), by Country 2024 & 2032
- Figure 50: Europe IoT Sensor Market Volume Share (%), by Country 2024 & 2032
- Figure 51: Asia Pacific IoT Sensor Market Revenue (Million), by Type 2024 & 2032
- Figure 52: Asia Pacific IoT Sensor Market Volume (K Unit), by Type 2024 & 2032
- Figure 53: Asia Pacific IoT Sensor Market Revenue Share (%), by Type 2024 & 2032
- Figure 54: Asia Pacific IoT Sensor Market Volume Share (%), by Type 2024 & 2032
- Figure 55: Asia Pacific IoT Sensor Market Revenue (Million), by End User 2024 & 2032
- Figure 56: Asia Pacific IoT Sensor Market Volume (K Unit), by End User 2024 & 2032
- Figure 57: Asia Pacific IoT Sensor Market Revenue Share (%), by End User 2024 & 2032
- Figure 58: Asia Pacific IoT Sensor Market Volume Share (%), by End User 2024 & 2032
- Figure 59: Asia Pacific IoT Sensor Market Revenue (Million), by Country 2024 & 2032
- Figure 60: Asia Pacific IoT Sensor Market Volume (K Unit), by Country 2024 & 2032
- Figure 61: Asia Pacific IoT Sensor Market Revenue Share (%), by Country 2024 & 2032
- Figure 62: Asia Pacific IoT Sensor Market Volume Share (%), by Country 2024 & 2032
- Figure 63: Rest of the World IoT Sensor Market Revenue (Million), by Type 2024 & 2032
- Figure 64: Rest of the World IoT Sensor Market Volume (K Unit), by Type 2024 & 2032
- Figure 65: Rest of the World IoT Sensor Market Revenue Share (%), by Type 2024 & 2032
- Figure 66: Rest of the World IoT Sensor Market Volume Share (%), by Type 2024 & 2032
- Figure 67: Rest of the World IoT Sensor Market Revenue (Million), by End User 2024 & 2032
- Figure 68: Rest of the World IoT Sensor Market Volume (K Unit), by End User 2024 & 2032
- Figure 69: Rest of the World IoT Sensor Market Revenue Share (%), by End User 2024 & 2032
- Figure 70: Rest of the World IoT Sensor Market Volume Share (%), by End User 2024 & 2032
- Figure 71: Rest of the World IoT Sensor Market Revenue (Million), by Country 2024 & 2032
- Figure 72: Rest of the World IoT Sensor Market Volume (K Unit), by Country 2024 & 2032
- Figure 73: Rest of the World IoT Sensor Market Revenue Share (%), by Country 2024 & 2032
- Figure 74: Rest of the World IoT Sensor Market Volume Share (%), by Country 2024 & 2032
List of Tables
- Table 1: Global IoT Sensor Market Revenue Million Forecast, by Region 2019 & 2032
- Table 2: Global IoT Sensor Market Volume K Unit Forecast, by Region 2019 & 2032
- Table 3: Global IoT Sensor Market Revenue Million Forecast, by Type 2019 & 2032
- Table 4: Global IoT Sensor Market Volume K Unit Forecast, by Type 2019 & 2032
- Table 5: Global IoT Sensor Market Revenue Million Forecast, by End User 2019 & 2032
- Table 6: Global IoT Sensor Market Volume K Unit Forecast, by End User 2019 & 2032
- Table 7: Global IoT Sensor Market Revenue Million Forecast, by Region 2019 & 2032
- Table 8: Global IoT Sensor Market Volume K Unit Forecast, by Region 2019 & 2032
- Table 9: Global IoT Sensor Market Revenue Million Forecast, by Country 2019 & 2032
- Table 10: Global IoT Sensor Market Volume K Unit Forecast, by Country 2019 & 2032
- Table 11: Global IoT Sensor Market Revenue Million Forecast, by Country 2019 & 2032
- Table 12: Global IoT Sensor Market Volume K Unit Forecast, by Country 2019 & 2032
- Table 13: Global IoT Sensor Market Revenue Million Forecast, by Country 2019 & 2032
- Table 14: Global IoT Sensor Market Volume K Unit Forecast, by Country 2019 & 2032
- Table 15: Global IoT Sensor Market Revenue Million Forecast, by Country 2019 & 2032
- Table 16: Global IoT Sensor Market Volume K Unit Forecast, by Country 2019 & 2032
- Table 17: Global IoT Sensor Market Revenue Million Forecast, by Country 2019 & 2032
- Table 18: Global IoT Sensor Market Volume K Unit Forecast, by Country 2019 & 2032
- Table 19: Global IoT Sensor Market Revenue Million Forecast, by Country 2019 & 2032
- Table 20: Global IoT Sensor Market Volume K Unit Forecast, by Country 2019 & 2032
- Table 21: Global IoT Sensor Market Revenue Million Forecast, by Type 2019 & 2032
- Table 22: Global IoT Sensor Market Volume K Unit Forecast, by Type 2019 & 2032
- Table 23: Global IoT Sensor Market Revenue Million Forecast, by End User 2019 & 2032
- Table 24: Global IoT Sensor Market Volume K Unit Forecast, by End User 2019 & 2032
- Table 25: Global IoT Sensor Market Revenue Million Forecast, by Country 2019 & 2032
- Table 26: Global IoT Sensor Market Volume K Unit Forecast, by Country 2019 & 2032
- Table 27: United States IoT Sensor Market Revenue (Million) Forecast, by Application 2019 & 2032
- Table 28: United States IoT Sensor Market Volume (K Unit) Forecast, by Application 2019 & 2032
- Table 29: Canada IoT Sensor Market Revenue (Million) Forecast, by Application 2019 & 2032
- Table 30: Canada IoT Sensor Market Volume (K Unit) Forecast, by Application 2019 & 2032
- Table 31: Global IoT Sensor Market Revenue Million Forecast, by Type 2019 & 2032
- Table 32: Global IoT Sensor Market Volume K Unit Forecast, by Type 2019 & 2032
- Table 33: Global IoT Sensor Market Revenue Million Forecast, by End User 2019 & 2032
- Table 34: Global IoT Sensor Market Volume K Unit Forecast, by End User 2019 & 2032
- Table 35: Global IoT Sensor Market Revenue Million Forecast, by Country 2019 & 2032
- Table 36: Global IoT Sensor Market Volume K Unit Forecast, by Country 2019 & 2032
- Table 37: United Kingdom IoT Sensor Market Revenue (Million) Forecast, by Application 2019 & 2032
- Table 38: United Kingdom IoT Sensor Market Volume (K Unit) Forecast, by Application 2019 & 2032
- Table 39: France IoT Sensor Market Revenue (Million) Forecast, by Application 2019 & 2032
- Table 40: France IoT Sensor Market Volume (K Unit) Forecast, by Application 2019 & 2032
- Table 41: Germany IoT Sensor Market Revenue (Million) Forecast, by Application 2019 & 2032
- Table 42: Germany IoT Sensor Market Volume (K Unit) Forecast, by Application 2019 & 2032
- Table 43: Rest of Europe IoT Sensor Market Revenue (Million) Forecast, by Application 2019 & 2032
- Table 44: Rest of Europe IoT Sensor Market Volume (K Unit) Forecast, by Application 2019 & 2032
- Table 45: Global IoT Sensor Market Revenue Million Forecast, by Type 2019 & 2032
- Table 46: Global IoT Sensor Market Volume K Unit Forecast, by Type 2019 & 2032
- Table 47: Global IoT Sensor Market Revenue Million Forecast, by End User 2019 & 2032
- Table 48: Global IoT Sensor Market Volume K Unit Forecast, by End User 2019 & 2032
- Table 49: Global IoT Sensor Market Revenue Million Forecast, by Country 2019 & 2032
- Table 50: Global IoT Sensor Market Volume K Unit Forecast, by Country 2019 & 2032
- Table 51: China IoT Sensor Market Revenue (Million) Forecast, by Application 2019 & 2032
- Table 52: China IoT Sensor Market Volume (K Unit) Forecast, by Application 2019 & 2032
- Table 53: Japan IoT Sensor Market Revenue (Million) Forecast, by Application 2019 & 2032
- Table 54: Japan IoT Sensor Market Volume (K Unit) Forecast, by Application 2019 & 2032
- Table 55: South Korea IoT Sensor Market Revenue (Million) Forecast, by Application 2019 & 2032
- Table 56: South Korea IoT Sensor Market Volume (K Unit) Forecast, by Application 2019 & 2032
- Table 57: India IoT Sensor Market Revenue (Million) Forecast, by Application 2019 & 2032
- Table 58: India IoT Sensor Market Volume (K Unit) Forecast, by Application 2019 & 2032
- Table 59: Rest of the Asia Pacific IoT Sensor Market Revenue (Million) Forecast, by Application 2019 & 2032
- Table 60: Rest of the Asia Pacific IoT Sensor Market Volume (K Unit) Forecast, by Application 2019 & 2032
- Table 61: Global IoT Sensor Market Revenue Million Forecast, by Type 2019 & 2032
- Table 62: Global IoT Sensor Market Volume K Unit Forecast, by Type 2019 & 2032
- Table 63: Global IoT Sensor Market Revenue Million Forecast, by End User 2019 & 2032
- Table 64: Global IoT Sensor Market Volume K Unit Forecast, by End User 2019 & 2032
- Table 65: Global IoT Sensor Market Revenue Million Forecast, by Country 2019 & 2032
- Table 66: Global IoT Sensor Market Volume K Unit Forecast, by Country 2019 & 2032
- Table 67: Latin America IoT Sensor Market Revenue (Million) Forecast, by Application 2019 & 2032
- Table 68: Latin America IoT Sensor Market Volume (K Unit) Forecast, by Application 2019 & 2032
- Table 69: Middle East IoT Sensor Market Revenue (Million) Forecast, by Application 2019 & 2032
- Table 70: Middle East IoT Sensor Market Volume (K Unit) Forecast, by Application 2019 & 2032
Frequently Asked Questions
1. What is the projected Compound Annual Growth Rate (CAGR) of the IoT Sensor Market?
The projected CAGR is approximately 22.43%.
2. Which companies are prominent players in the IoT Sensor Market?
Key companies in the market include Honeywell International Inc, ABB Ltd, TE Connectivity, Texas Instruments Inc , Sensata Technologies, Schneider Electric SE, STMicroelectronics NV, Robert Bosch GmbH, OMRON Corporation, TDK Corporation.
3. What are the main segments of the IoT Sensor Market?
The market segments include Type, End User.
4. Can you provide details about the market size?
The market size is estimated to be USD 34.48 Million as of 2022.
5. What are some drivers contributing to market growth?
Rising use of IoT sensors due to reduced cost and size; Increasing applications of Industry 4.0 and connected devices.
6. What are the notable trends driving market growth?
Automotive and Transportation Industry to Drive the Market Growth.
7. Are there any restraints impacting market growth?
Rising concerns related to data security.
8. Can you provide examples of recent developments in the market?
September 2021: Through its subsidiary Beyond Eyes, the Dutch construction company Heijman has deployed some 20,000 LORAWAN smart buildings IoT sensors for its customers. The aim is to enhance the management of buildings by leveraging real-time insights regarding energy and water usage, light intensity, humidity levels, carbon emissions levels, and noise levels while providing occupants with smart home functionalities. Beyond Eyes partnered with IoT connectivity solution firm Actility and IoT senor company Clickey to implement its smart building concept across the Netherlands.
9. What pricing options are available for accessing the report?
Pricing options include single-user, multi-user, and enterprise licenses priced at USD 4750, USD 5250, and USD 8750 respectively.
10. Is the market size provided in terms of value or volume?
The market size is provided in terms of value, measured in Million and volume, measured in K Unit.
11. Are there any specific market keywords associated with the report?
Yes, the market keyword associated with the report is "IoT Sensor Market," which aids in identifying and referencing the specific market segment covered.
12. How do I determine which pricing option suits my needs best?
The pricing options vary based on user requirements and access needs. Individual users may opt for single-user licenses, while businesses requiring broader access may choose multi-user or enterprise licenses for cost-effective access to the report.
13. Are there any additional resources or data provided in the IoT Sensor Market report?
While the report offers comprehensive insights, it's advisable to review the specific contents or supplementary materials provided to ascertain if additional resources or data are available.
14. How can I stay updated on further developments or reports in the IoT Sensor Market?
To stay informed about further developments, trends, and reports in the IoT Sensor Market, consider subscribing to industry newsletters, following relevant companies and organizations, or regularly checking reputable industry news sources and publications.
Methodology
Step 1 - Identification of Relevant Samples Size from Population Database


Step 2 - Approaches for Defining Global Market Size (Value, Volume* & Price*)

Note*: In applicable scenarios
Step 3 - Data Sources
Primary Research
- Web Analytics
- Survey Reports
- Research Institute
- Latest Research Reports
- Opinion Leaders
Secondary Research
- Annual Reports
- White Paper
- Latest Press Release
- Industry Association
- Paid Database
- Investor Presentations

Step 4 - Data Triangulation
Involves using different sources of information in order to increase the validity of a study
These sources are likely to be stakeholders in a program - participants, other researchers, program staff, other community members, and so on.
Then we put all data in single framework & apply various statistical tools to find out the dynamic on the market.
During the analysis stage, feedback from the stakeholder groups would be compared to determine areas of agreement as well as areas of divergence


