
Key Insights
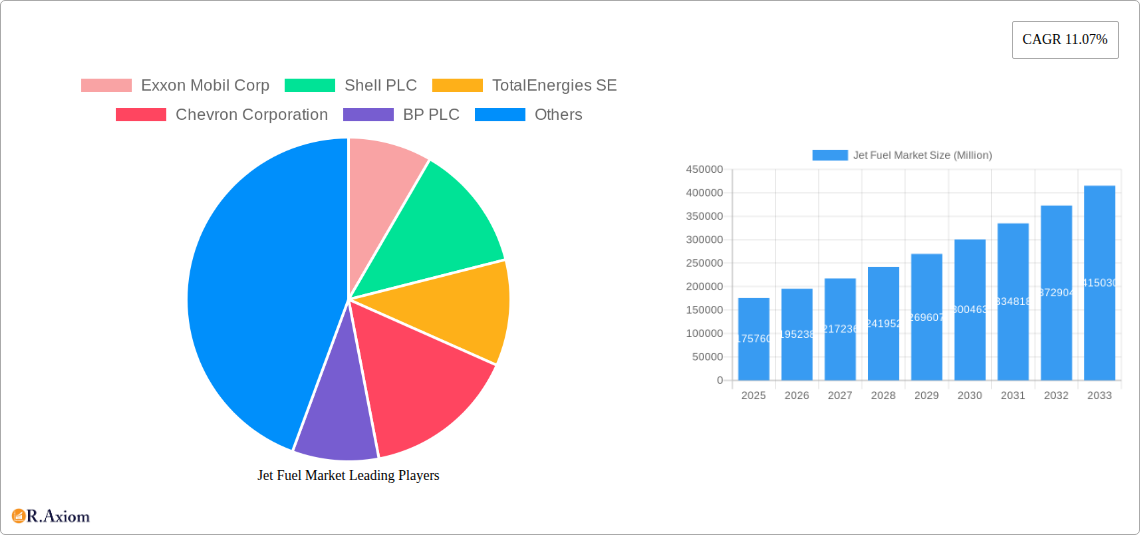
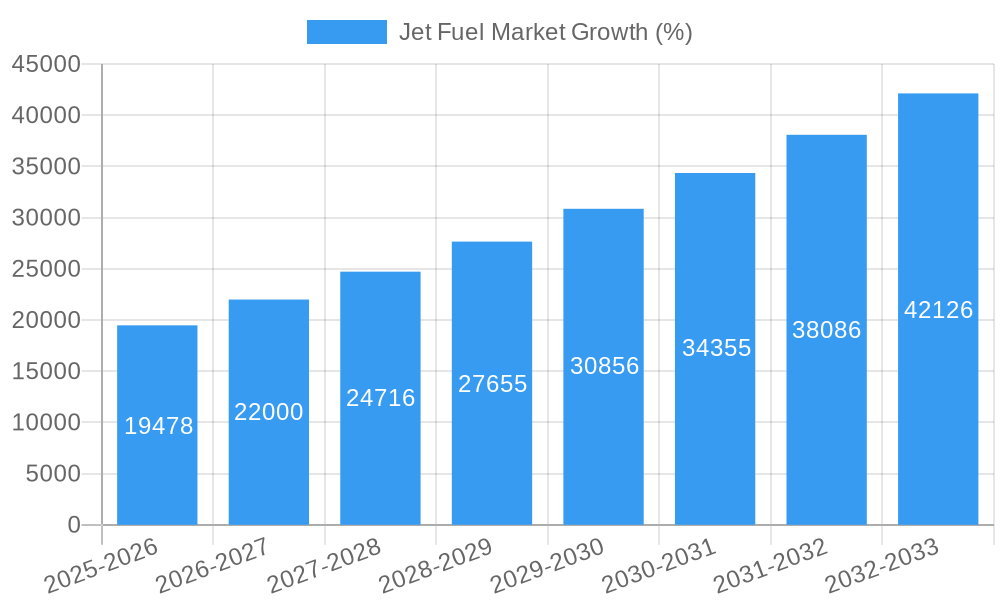
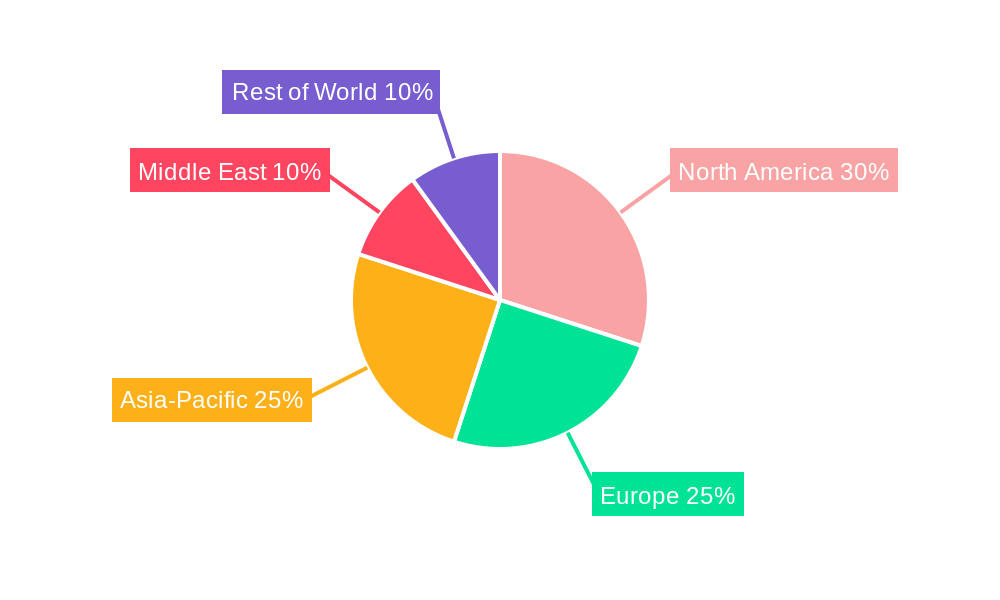
The global jet fuel market, valued at $175.76 billion in 2025, is projected to experience robust growth, driven by the resurgence of air travel following the pandemic and the expansion of the global aviation industry. A compound annual growth rate (CAGR) of 11.07% from 2025 to 2033 indicates significant market expansion. Key drivers include increasing passenger numbers, the growth of low-cost carriers, and the expansion of air freight services. Furthermore, technological advancements in fuel efficiency and sustainable aviation fuels (SAFs) are influencing market dynamics, though the high cost of SAFs currently presents a restraint. The market is segmented by region, with North America and Europe likely holding the largest shares due to their established aviation industries and high air passenger traffic. Leading players like Exxon Mobil, Shell, TotalEnergies, Chevron, and BP dominate the market, leveraging their extensive refining capabilities and global distribution networks. Increased government regulations promoting sustainable aviation practices are also shaping the market landscape, pushing industry players toward investing in SAF research and development. The competitive landscape is characterized by both established players and regional fuel suppliers, driving innovation and price competition.
The forecast period from 2025-2033 suggests continued growth fueled by long-term projections of air travel growth. However, potential economic downturns and geopolitical instability could impact demand. The increasing focus on environmental sustainability is a crucial long-term driver, with the adoption of SAFs expected to accelerate, albeit gradually, due to production challenges and cost limitations. Consequently, strategic partnerships and investments in SAF technology will be critical for companies seeking a sustainable competitive advantage in the coming years. The market's future hinges on a delicate balance between satisfying the growing demand for air travel and mitigating its environmental impact, fostering a market poised for substantial growth, though not without its challenges.
This in-depth report provides a comprehensive analysis of the global Jet Fuel market, covering the period from 2019 to 2033. With a focus on market dynamics, competitive landscape, and future growth potential, this report is an essential resource for industry stakeholders, investors, and strategic decision-makers. The report leverages extensive primary and secondary research to offer actionable insights and forecasts, providing a detailed understanding of the market's current state and future trajectory. The study period is 2019-2033, with 2025 as the base and estimated year. The forecast period is 2025-2033, and the historical period is 2019-2024.
Jet Fuel Market Concentration & Innovation
This section analyzes the competitive landscape of the jet fuel market, examining market concentration, innovation drivers, regulatory frameworks, product substitutes, end-user trends, and mergers and acquisitions (M&A) activities.
The global jet fuel market exhibits a moderately concentrated structure, with a few major players holding significant market share. Exxon Mobil Corp, Shell PLC, TotalEnergies SE, Chevron Corporation, and BP PLC are among the dominant players, collectively accounting for an estimated xx% of the global market share in 2024. Smaller players, including regional distributors and specialized suppliers, cater to niche markets and regional demands.
- Market Concentration: The Herfindahl-Hirschman Index (HHI) is estimated to be xx in 2024, indicating a moderately concentrated market.
- Innovation Drivers: The primary drivers of innovation include stricter environmental regulations, the push for sustainable aviation fuel (SAF), and the ongoing need for enhanced fuel efficiency.
- Regulatory Frameworks: International Civil Aviation Organization (ICAO) regulations and national-level environmental policies significantly influence the market. Compliance with emission standards drives investment in SAF and advanced fuel technologies.
- Product Substitutes: The primary substitute for traditional jet fuel is SAF, which is gaining traction due to its environmental benefits. Biofuels and other alternative fuels are also emerging as potential substitutes.
- End-User Trends: The aviation industry's growth and evolving operational needs are key factors impacting jet fuel demand. The increasing preference for sustainable practices among airlines influences the demand for SAF.
- M&A Activities: The jet fuel market has witnessed several M&A activities in recent years, driven by the need to consolidate market share, expand geographic reach, and gain access to innovative technologies. The total value of M&A deals in the sector from 2019 to 2024 is estimated to be around USD xx Million.
Jet Fuel Market Industry Trends & Insights
This section delves into the key trends shaping the jet fuel market, including growth drivers, technological advancements, consumer preferences, and competitive dynamics. The market is experiencing significant transformation driven by factors like rising air travel, the increasing adoption of sustainable aviation fuel (SAF), and technological advancements in fuel production and refining processes.
The global jet fuel market is projected to register a Compound Annual Growth Rate (CAGR) of xx% during the forecast period (2025-2033). This growth can be attributed to several factors. The continued expansion of the global airline industry is a major driver, with increasing passenger numbers and air freight volume driving demand for jet fuel.
Technological advancements in fuel production and refining are improving efficiency and reducing costs, leading to an increase in supply. Moreover, the growing focus on environmental sustainability is driving the development and adoption of SAF, a key trend that will likely reshape the jet fuel market in the coming years. The market penetration of SAF is expected to reach xx% by 2033, driven by stringent emission regulations and growing consumer and investor awareness of environmental issues. Competitive dynamics are intense, with major players focusing on mergers and acquisitions, technological innovation, and strategic partnerships to gain a competitive edge.
Dominant Markets & Segments in Jet Fuel Market
This section identifies the leading regions, countries, or segments within the jet fuel market, providing a detailed dominance analysis along with key drivers for each.
- North America: The region holds a dominant position due to the large presence of major airlines and airports, strong economic growth, and robust aviation infrastructure.
- Key Drivers: Strong domestic air travel, robust infrastructure, and substantial investments in the aviation sector.
- Europe: The European market is characterized by stringent environmental regulations, driving the adoption of SAF and influencing the demand for sustainable alternatives.
- Key Drivers: Stringent environmental regulations, substantial air travel demand, and growing emphasis on sustainable aviation.
- Asia-Pacific: This region exhibits strong growth potential, fueled by rapid economic development, a burgeoning middle class, and expanding air travel infrastructure.
- Key Drivers: Rapid economic growth, rising disposable income, and expansion of airport infrastructure.
Jet Fuel Market Product Developments
Recent product innovations in the jet fuel market primarily center on sustainable aviation fuels (SAF). These biofuels, made from sources like used cooking oil and agricultural residues, offer significant reductions in greenhouse gas emissions compared to traditional jet fuel. This technological trend directly addresses growing environmental concerns within the aviation industry and meets increasing regulatory pressure. The market fit for SAF is strong due to its potential to reduce carbon footprints and meet sustainability targets, although challenges related to production scale and cost remain.
Report Scope & Segmentation Analysis
This report segments the jet fuel market based on several key parameters including fuel type (conventional jet fuel, sustainable aviation fuel), aircraft type (narrow-body, wide-body, regional jets), application (commercial aviation, military aviation, general aviation) and geography (North America, Europe, Asia-Pacific, Middle East & Africa, South America). Each segment presents varying growth prospects, market sizes and competitive landscapes. For example, the SAF segment is experiencing significant growth due to environmental concerns, while the conventional jet fuel segment is anticipated to grow at a steady pace aligned with overall air travel demand.
Key Drivers of Jet Fuel Market Growth
The jet fuel market’s growth is propelled by several key factors. The robust growth of the global aviation industry directly translates to increased demand for jet fuel. Furthermore, economic growth in developing economies fuels air travel demand, particularly in Asia-Pacific. Government policies and regulations regarding aviation safety and emissions are pivotal, encouraging the development and adoption of cleaner fuels like SAF.
Challenges in the Jet Fuel Market Sector
The jet fuel market faces several significant challenges. The volatility of crude oil prices directly impacts jet fuel costs, impacting airline profitability and potentially consumer fares. Stringent environmental regulations and the push towards SAF pose significant technological and economic challenges for producers. Moreover, maintaining a stable and secure supply chain is crucial, given the global nature of the aviation industry. The estimated overall impact of these challenges on market growth is a reduction of approximately xx% from the initial projected growth rate.
Emerging Opportunities in Jet Fuel Market
Significant opportunities exist in the jet fuel market. The increasing demand for SAF presents a major growth opportunity for companies investing in sustainable fuel technologies. Furthermore, advancements in biofuel production methods are reducing costs and improving efficiency, increasing the market viability of these alternative fuels. Exploration of novel feedstocks for SAF production and investment in advanced biofuel refining technologies are key areas for future growth and innovation.
Leading Players in the Jet Fuel Market Market
- Exxon Mobil Corp (Exxon Mobil Corp)
- Shell PLC (Shell PLC)
- TotalEnergies SE (TotalEnergies SE)
- Chevron Corporation (Chevron Corporation)
- BP PLC (BP PLC)
- Qatar Jet Fuel Company
- Allied Aviation Services Inc
- Bharat Petroleum Corp Ltd
- Gazprom Neft PJSC
- *List Not Exhaustive
Key Developments in Jet Fuel Market Industry
- April 2023: Indian Oil Corporation announced a USD 366 Million joint venture with LanzaJet Inc and domestic airlines to produce SAF using alcohol-to-jet technology. This development signifies a major step towards the wider adoption of SAF in India and globally.
- March 2023: NREL’s regional analysis highlighted the potential of SAF to significantly reduce aviation GHG emissions, accelerating its production and delivery. This underscores the increasing importance of SAF in addressing the environmental impact of the aviation industry.
Strategic Outlook for Jet Fuel Market Market
The future of the jet fuel market is closely tied to the continued growth of air travel and the escalating adoption of SAF. The transition towards a more sustainable aviation sector presents immense growth potential for companies investing in SAF production and related technologies. The market's long-term outlook is positive, driven by technological innovation, increasing regulatory pressures, and a growing awareness of environmental sustainability. However, continued volatility in crude oil prices and potential supply chain disruptions remain key risk factors to consider.
Jet Fuel Market Segmentation
-
1. Fuel Type
- 1.1. Jet A
- 1.2. Jet A1
- 1.3. Jet B
-
2. Application
- 2.1. Commercial
- 2.2. Defense
- 2.3. General Aviation
Jet Fuel Market Segmentation By Geography
-
1. North America
- 1.1. United States of America
- 1.2. Canada
- 1.3. Rest of the North America
-
2. Europe
- 2.1. Germany
- 2.2. United Kingdom
- 2.3. Italy
- 2.4. France
- 2.5. Rest of the Europe
-
3. Asia Pacific
- 3.1. China
- 3.2. India
- 3.3. South Korea
- 3.4. Rest of the Asia Pacific
-
4. South America
- 4.1. Brazil
- 4.2. Argentina
- 4.3. Rest of the South America
-
5. Middle East and Africa
- 5.1. United Arab Emirates
- 5.2. Saudi Arabia
- 5.3. South Africa
- 5.4. Rest of the Middle East and Africa
Jet Fuel Market REPORT HIGHLIGHTS
| Aspects | Details |
|---|---|
| Study Period | 2019-2033 |
| Base Year | 2024 |
| Estimated Year | 2025 |
| Forecast Period | 2025-2033 |
| Historical Period | 2019-2024 |
| Growth Rate | CAGR of 11.07% from 2019-2033 |
| Segmentation |
|
Table of Contents
- 1. Introduction
- 1.1. Research Scope
- 1.2. Market Segmentation
- 1.3. Research Methodology
- 1.4. Definitions and Assumptions
- 2. Executive Summary
- 2.1. Introduction
- 3. Market Dynamics
- 3.1. Introduction
- 3.2. Market Drivers
- 3.2.1. 4.; The Increasing Number of Air Passengers4.; Increasing use of Aircraft in Defence Sector
- 3.3. Market Restrains
- 3.3.1. 4.; The Increasing Number of Air Passengers4.; Increasing use of Aircraft in Defence Sector
- 3.4. Market Trends
- 3.4.1. The Commercial Segment to Dominate the Market
- 4. Market Factor Analysis
- 4.1. Porters Five Forces
- 4.2. Supply/Value Chain
- 4.3. PESTEL analysis
- 4.4. Market Entropy
- 4.5. Patent/Trademark Analysis
- 5. Global Jet Fuel Market Analysis, Insights and Forecast, 2019-2031
- 5.1. Market Analysis, Insights and Forecast - by Fuel Type
- 5.1.1. Jet A
- 5.1.2. Jet A1
- 5.1.3. Jet B
- 5.2. Market Analysis, Insights and Forecast - by Application
- 5.2.1. Commercial
- 5.2.2. Defense
- 5.2.3. General Aviation
- 5.3. Market Analysis, Insights and Forecast - by Region
- 5.3.1. North America
- 5.3.2. Europe
- 5.3.3. Asia Pacific
- 5.3.4. South America
- 5.3.5. Middle East and Africa
- 5.1. Market Analysis, Insights and Forecast - by Fuel Type
- 6. North America Jet Fuel Market Analysis, Insights and Forecast, 2019-2031
- 6.1. Market Analysis, Insights and Forecast - by Fuel Type
- 6.1.1. Jet A
- 6.1.2. Jet A1
- 6.1.3. Jet B
- 6.2. Market Analysis, Insights and Forecast - by Application
- 6.2.1. Commercial
- 6.2.2. Defense
- 6.2.3. General Aviation
- 6.1. Market Analysis, Insights and Forecast - by Fuel Type
- 7. Europe Jet Fuel Market Analysis, Insights and Forecast, 2019-2031
- 7.1. Market Analysis, Insights and Forecast - by Fuel Type
- 7.1.1. Jet A
- 7.1.2. Jet A1
- 7.1.3. Jet B
- 7.2. Market Analysis, Insights and Forecast - by Application
- 7.2.1. Commercial
- 7.2.2. Defense
- 7.2.3. General Aviation
- 7.1. Market Analysis, Insights and Forecast - by Fuel Type
- 8. Asia Pacific Jet Fuel Market Analysis, Insights and Forecast, 2019-2031
- 8.1. Market Analysis, Insights and Forecast - by Fuel Type
- 8.1.1. Jet A
- 8.1.2. Jet A1
- 8.1.3. Jet B
- 8.2. Market Analysis, Insights and Forecast - by Application
- 8.2.1. Commercial
- 8.2.2. Defense
- 8.2.3. General Aviation
- 8.1. Market Analysis, Insights and Forecast - by Fuel Type
- 9. South America Jet Fuel Market Analysis, Insights and Forecast, 2019-2031
- 9.1. Market Analysis, Insights and Forecast - by Fuel Type
- 9.1.1. Jet A
- 9.1.2. Jet A1
- 9.1.3. Jet B
- 9.2. Market Analysis, Insights and Forecast - by Application
- 9.2.1. Commercial
- 9.2.2. Defense
- 9.2.3. General Aviation
- 9.1. Market Analysis, Insights and Forecast - by Fuel Type
- 10. Middle East and Africa Jet Fuel Market Analysis, Insights and Forecast, 2019-2031
- 10.1. Market Analysis, Insights and Forecast - by Fuel Type
- 10.1.1. Jet A
- 10.1.2. Jet A1
- 10.1.3. Jet B
- 10.2. Market Analysis, Insights and Forecast - by Application
- 10.2.1. Commercial
- 10.2.2. Defense
- 10.2.3. General Aviation
- 10.1. Market Analysis, Insights and Forecast - by Fuel Type
- 11. Competitive Analysis
- 11.1. Global Market Share Analysis 2024
- 11.2. Company Profiles
- 11.2.1 Exxon Mobil Corp
- 11.2.1.1. Overview
- 11.2.1.2. Products
- 11.2.1.3. SWOT Analysis
- 11.2.1.4. Recent Developments
- 11.2.1.5. Financials (Based on Availability)
- 11.2.2 Shell PLC
- 11.2.2.1. Overview
- 11.2.2.2. Products
- 11.2.2.3. SWOT Analysis
- 11.2.2.4. Recent Developments
- 11.2.2.5. Financials (Based on Availability)
- 11.2.3 TotalEnergies SE
- 11.2.3.1. Overview
- 11.2.3.2. Products
- 11.2.3.3. SWOT Analysis
- 11.2.3.4. Recent Developments
- 11.2.3.5. Financials (Based on Availability)
- 11.2.4 Chevron Corporation
- 11.2.4.1. Overview
- 11.2.4.2. Products
- 11.2.4.3. SWOT Analysis
- 11.2.4.4. Recent Developments
- 11.2.4.5. Financials (Based on Availability)
- 11.2.5 BP PLC
- 11.2.5.1. Overview
- 11.2.5.2. Products
- 11.2.5.3. SWOT Analysis
- 11.2.5.4. Recent Developments
- 11.2.5.5. Financials (Based on Availability)
- 11.2.6 Qatar Jet Fuel Company
- 11.2.6.1. Overview
- 11.2.6.2. Products
- 11.2.6.3. SWOT Analysis
- 11.2.6.4. Recent Developments
- 11.2.6.5. Financials (Based on Availability)
- 11.2.7 Allied Aviation Services Inc
- 11.2.7.1. Overview
- 11.2.7.2. Products
- 11.2.7.3. SWOT Analysis
- 11.2.7.4. Recent Developments
- 11.2.7.5. Financials (Based on Availability)
- 11.2.8 Bharat Petroleum Corp Ltd
- 11.2.8.1. Overview
- 11.2.8.2. Products
- 11.2.8.3. SWOT Analysis
- 11.2.8.4. Recent Developments
- 11.2.8.5. Financials (Based on Availability)
- 11.2.9 Gazprom Neft PJSC*List Not Exhaustive
- 11.2.9.1. Overview
- 11.2.9.2. Products
- 11.2.9.3. SWOT Analysis
- 11.2.9.4. Recent Developments
- 11.2.9.5. Financials (Based on Availability)
- 11.2.1 Exxon Mobil Corp
List of Figures
- Figure 1: Global Jet Fuel Market Revenue Breakdown (Million, %) by Region 2024 & 2032
- Figure 2: Global Jet Fuel Market Volume Breakdown (Billion, %) by Region 2024 & 2032
- Figure 3: North America Jet Fuel Market Revenue (Million), by Fuel Type 2024 & 2032
- Figure 4: North America Jet Fuel Market Volume (Billion), by Fuel Type 2024 & 2032
- Figure 5: North America Jet Fuel Market Revenue Share (%), by Fuel Type 2024 & 2032
- Figure 6: North America Jet Fuel Market Volume Share (%), by Fuel Type 2024 & 2032
- Figure 7: North America Jet Fuel Market Revenue (Million), by Application 2024 & 2032
- Figure 8: North America Jet Fuel Market Volume (Billion), by Application 2024 & 2032
- Figure 9: North America Jet Fuel Market Revenue Share (%), by Application 2024 & 2032
- Figure 10: North America Jet Fuel Market Volume Share (%), by Application 2024 & 2032
- Figure 11: North America Jet Fuel Market Revenue (Million), by Country 2024 & 2032
- Figure 12: North America Jet Fuel Market Volume (Billion), by Country 2024 & 2032
- Figure 13: North America Jet Fuel Market Revenue Share (%), by Country 2024 & 2032
- Figure 14: North America Jet Fuel Market Volume Share (%), by Country 2024 & 2032
- Figure 15: Europe Jet Fuel Market Revenue (Million), by Fuel Type 2024 & 2032
- Figure 16: Europe Jet Fuel Market Volume (Billion), by Fuel Type 2024 & 2032
- Figure 17: Europe Jet Fuel Market Revenue Share (%), by Fuel Type 2024 & 2032
- Figure 18: Europe Jet Fuel Market Volume Share (%), by Fuel Type 2024 & 2032
- Figure 19: Europe Jet Fuel Market Revenue (Million), by Application 2024 & 2032
- Figure 20: Europe Jet Fuel Market Volume (Billion), by Application 2024 & 2032
- Figure 21: Europe Jet Fuel Market Revenue Share (%), by Application 2024 & 2032
- Figure 22: Europe Jet Fuel Market Volume Share (%), by Application 2024 & 2032
- Figure 23: Europe Jet Fuel Market Revenue (Million), by Country 2024 & 2032
- Figure 24: Europe Jet Fuel Market Volume (Billion), by Country 2024 & 2032
- Figure 25: Europe Jet Fuel Market Revenue Share (%), by Country 2024 & 2032
- Figure 26: Europe Jet Fuel Market Volume Share (%), by Country 2024 & 2032
- Figure 27: Asia Pacific Jet Fuel Market Revenue (Million), by Fuel Type 2024 & 2032
- Figure 28: Asia Pacific Jet Fuel Market Volume (Billion), by Fuel Type 2024 & 2032
- Figure 29: Asia Pacific Jet Fuel Market Revenue Share (%), by Fuel Type 2024 & 2032
- Figure 30: Asia Pacific Jet Fuel Market Volume Share (%), by Fuel Type 2024 & 2032
- Figure 31: Asia Pacific Jet Fuel Market Revenue (Million), by Application 2024 & 2032
- Figure 32: Asia Pacific Jet Fuel Market Volume (Billion), by Application 2024 & 2032
- Figure 33: Asia Pacific Jet Fuel Market Revenue Share (%), by Application 2024 & 2032
- Figure 34: Asia Pacific Jet Fuel Market Volume Share (%), by Application 2024 & 2032
- Figure 35: Asia Pacific Jet Fuel Market Revenue (Million), by Country 2024 & 2032
- Figure 36: Asia Pacific Jet Fuel Market Volume (Billion), by Country 2024 & 2032
- Figure 37: Asia Pacific Jet Fuel Market Revenue Share (%), by Country 2024 & 2032
- Figure 38: Asia Pacific Jet Fuel Market Volume Share (%), by Country 2024 & 2032
- Figure 39: South America Jet Fuel Market Revenue (Million), by Fuel Type 2024 & 2032
- Figure 40: South America Jet Fuel Market Volume (Billion), by Fuel Type 2024 & 2032
- Figure 41: South America Jet Fuel Market Revenue Share (%), by Fuel Type 2024 & 2032
- Figure 42: South America Jet Fuel Market Volume Share (%), by Fuel Type 2024 & 2032
- Figure 43: South America Jet Fuel Market Revenue (Million), by Application 2024 & 2032
- Figure 44: South America Jet Fuel Market Volume (Billion), by Application 2024 & 2032
- Figure 45: South America Jet Fuel Market Revenue Share (%), by Application 2024 & 2032
- Figure 46: South America Jet Fuel Market Volume Share (%), by Application 2024 & 2032
- Figure 47: South America Jet Fuel Market Revenue (Million), by Country 2024 & 2032
- Figure 48: South America Jet Fuel Market Volume (Billion), by Country 2024 & 2032
- Figure 49: South America Jet Fuel Market Revenue Share (%), by Country 2024 & 2032
- Figure 50: South America Jet Fuel Market Volume Share (%), by Country 2024 & 2032
- Figure 51: Middle East and Africa Jet Fuel Market Revenue (Million), by Fuel Type 2024 & 2032
- Figure 52: Middle East and Africa Jet Fuel Market Volume (Billion), by Fuel Type 2024 & 2032
- Figure 53: Middle East and Africa Jet Fuel Market Revenue Share (%), by Fuel Type 2024 & 2032
- Figure 54: Middle East and Africa Jet Fuel Market Volume Share (%), by Fuel Type 2024 & 2032
- Figure 55: Middle East and Africa Jet Fuel Market Revenue (Million), by Application 2024 & 2032
- Figure 56: Middle East and Africa Jet Fuel Market Volume (Billion), by Application 2024 & 2032
- Figure 57: Middle East and Africa Jet Fuel Market Revenue Share (%), by Application 2024 & 2032
- Figure 58: Middle East and Africa Jet Fuel Market Volume Share (%), by Application 2024 & 2032
- Figure 59: Middle East and Africa Jet Fuel Market Revenue (Million), by Country 2024 & 2032
- Figure 60: Middle East and Africa Jet Fuel Market Volume (Billion), by Country 2024 & 2032
- Figure 61: Middle East and Africa Jet Fuel Market Revenue Share (%), by Country 2024 & 2032
- Figure 62: Middle East and Africa Jet Fuel Market Volume Share (%), by Country 2024 & 2032
List of Tables
- Table 1: Global Jet Fuel Market Revenue Million Forecast, by Region 2019 & 2032
- Table 2: Global Jet Fuel Market Volume Billion Forecast, by Region 2019 & 2032
- Table 3: Global Jet Fuel Market Revenue Million Forecast, by Fuel Type 2019 & 2032
- Table 4: Global Jet Fuel Market Volume Billion Forecast, by Fuel Type 2019 & 2032
- Table 5: Global Jet Fuel Market Revenue Million Forecast, by Application 2019 & 2032
- Table 6: Global Jet Fuel Market Volume Billion Forecast, by Application 2019 & 2032
- Table 7: Global Jet Fuel Market Revenue Million Forecast, by Region 2019 & 2032
- Table 8: Global Jet Fuel Market Volume Billion Forecast, by Region 2019 & 2032
- Table 9: Global Jet Fuel Market Revenue Million Forecast, by Fuel Type 2019 & 2032
- Table 10: Global Jet Fuel Market Volume Billion Forecast, by Fuel Type 2019 & 2032
- Table 11: Global Jet Fuel Market Revenue Million Forecast, by Application 2019 & 2032
- Table 12: Global Jet Fuel Market Volume Billion Forecast, by Application 2019 & 2032
- Table 13: Global Jet Fuel Market Revenue Million Forecast, by Country 2019 & 2032
- Table 14: Global Jet Fuel Market Volume Billion Forecast, by Country 2019 & 2032
- Table 15: United States of America Jet Fuel Market Revenue (Million) Forecast, by Application 2019 & 2032
- Table 16: United States of America Jet Fuel Market Volume (Billion) Forecast, by Application 2019 & 2032
- Table 17: Canada Jet Fuel Market Revenue (Million) Forecast, by Application 2019 & 2032
- Table 18: Canada Jet Fuel Market Volume (Billion) Forecast, by Application 2019 & 2032
- Table 19: Rest of the North America Jet Fuel Market Revenue (Million) Forecast, by Application 2019 & 2032
- Table 20: Rest of the North America Jet Fuel Market Volume (Billion) Forecast, by Application 2019 & 2032
- Table 21: Global Jet Fuel Market Revenue Million Forecast, by Fuel Type 2019 & 2032
- Table 22: Global Jet Fuel Market Volume Billion Forecast, by Fuel Type 2019 & 2032
- Table 23: Global Jet Fuel Market Revenue Million Forecast, by Application 2019 & 2032
- Table 24: Global Jet Fuel Market Volume Billion Forecast, by Application 2019 & 2032
- Table 25: Global Jet Fuel Market Revenue Million Forecast, by Country 2019 & 2032
- Table 26: Global Jet Fuel Market Volume Billion Forecast, by Country 2019 & 2032
- Table 27: Germany Jet Fuel Market Revenue (Million) Forecast, by Application 2019 & 2032
- Table 28: Germany Jet Fuel Market Volume (Billion) Forecast, by Application 2019 & 2032
- Table 29: United Kingdom Jet Fuel Market Revenue (Million) Forecast, by Application 2019 & 2032
- Table 30: United Kingdom Jet Fuel Market Volume (Billion) Forecast, by Application 2019 & 2032
- Table 31: Italy Jet Fuel Market Revenue (Million) Forecast, by Application 2019 & 2032
- Table 32: Italy Jet Fuel Market Volume (Billion) Forecast, by Application 2019 & 2032
- Table 33: France Jet Fuel Market Revenue (Million) Forecast, by Application 2019 & 2032
- Table 34: France Jet Fuel Market Volume (Billion) Forecast, by Application 2019 & 2032
- Table 35: Rest of the Europe Jet Fuel Market Revenue (Million) Forecast, by Application 2019 & 2032
- Table 36: Rest of the Europe Jet Fuel Market Volume (Billion) Forecast, by Application 2019 & 2032
- Table 37: Global Jet Fuel Market Revenue Million Forecast, by Fuel Type 2019 & 2032
- Table 38: Global Jet Fuel Market Volume Billion Forecast, by Fuel Type 2019 & 2032
- Table 39: Global Jet Fuel Market Revenue Million Forecast, by Application 2019 & 2032
- Table 40: Global Jet Fuel Market Volume Billion Forecast, by Application 2019 & 2032
- Table 41: Global Jet Fuel Market Revenue Million Forecast, by Country 2019 & 2032
- Table 42: Global Jet Fuel Market Volume Billion Forecast, by Country 2019 & 2032
- Table 43: China Jet Fuel Market Revenue (Million) Forecast, by Application 2019 & 2032
- Table 44: China Jet Fuel Market Volume (Billion) Forecast, by Application 2019 & 2032
- Table 45: India Jet Fuel Market Revenue (Million) Forecast, by Application 2019 & 2032
- Table 46: India Jet Fuel Market Volume (Billion) Forecast, by Application 2019 & 2032
- Table 47: South Korea Jet Fuel Market Revenue (Million) Forecast, by Application 2019 & 2032
- Table 48: South Korea Jet Fuel Market Volume (Billion) Forecast, by Application 2019 & 2032
- Table 49: Rest of the Asia Pacific Jet Fuel Market Revenue (Million) Forecast, by Application 2019 & 2032
- Table 50: Rest of the Asia Pacific Jet Fuel Market Volume (Billion) Forecast, by Application 2019 & 2032
- Table 51: Global Jet Fuel Market Revenue Million Forecast, by Fuel Type 2019 & 2032
- Table 52: Global Jet Fuel Market Volume Billion Forecast, by Fuel Type 2019 & 2032
- Table 53: Global Jet Fuel Market Revenue Million Forecast, by Application 2019 & 2032
- Table 54: Global Jet Fuel Market Volume Billion Forecast, by Application 2019 & 2032
- Table 55: Global Jet Fuel Market Revenue Million Forecast, by Country 2019 & 2032
- Table 56: Global Jet Fuel Market Volume Billion Forecast, by Country 2019 & 2032
- Table 57: Brazil Jet Fuel Market Revenue (Million) Forecast, by Application 2019 & 2032
- Table 58: Brazil Jet Fuel Market Volume (Billion) Forecast, by Application 2019 & 2032
- Table 59: Argentina Jet Fuel Market Revenue (Million) Forecast, by Application 2019 & 2032
- Table 60: Argentina Jet Fuel Market Volume (Billion) Forecast, by Application 2019 & 2032
- Table 61: Rest of the South America Jet Fuel Market Revenue (Million) Forecast, by Application 2019 & 2032
- Table 62: Rest of the South America Jet Fuel Market Volume (Billion) Forecast, by Application 2019 & 2032
- Table 63: Global Jet Fuel Market Revenue Million Forecast, by Fuel Type 2019 & 2032
- Table 64: Global Jet Fuel Market Volume Billion Forecast, by Fuel Type 2019 & 2032
- Table 65: Global Jet Fuel Market Revenue Million Forecast, by Application 2019 & 2032
- Table 66: Global Jet Fuel Market Volume Billion Forecast, by Application 2019 & 2032
- Table 67: Global Jet Fuel Market Revenue Million Forecast, by Country 2019 & 2032
- Table 68: Global Jet Fuel Market Volume Billion Forecast, by Country 2019 & 2032
- Table 69: United Arab Emirates Jet Fuel Market Revenue (Million) Forecast, by Application 2019 & 2032
- Table 70: United Arab Emirates Jet Fuel Market Volume (Billion) Forecast, by Application 2019 & 2032
- Table 71: Saudi Arabia Jet Fuel Market Revenue (Million) Forecast, by Application 2019 & 2032
- Table 72: Saudi Arabia Jet Fuel Market Volume (Billion) Forecast, by Application 2019 & 2032
- Table 73: South Africa Jet Fuel Market Revenue (Million) Forecast, by Application 2019 & 2032
- Table 74: South Africa Jet Fuel Market Volume (Billion) Forecast, by Application 2019 & 2032
- Table 75: Rest of the Middle East and Africa Jet Fuel Market Revenue (Million) Forecast, by Application 2019 & 2032
- Table 76: Rest of the Middle East and Africa Jet Fuel Market Volume (Billion) Forecast, by Application 2019 & 2032
Frequently Asked Questions
1. What is the projected Compound Annual Growth Rate (CAGR) of the Jet Fuel Market?
The projected CAGR is approximately 11.07%.
2. Which companies are prominent players in the Jet Fuel Market?
Key companies in the market include Exxon Mobil Corp, Shell PLC, TotalEnergies SE, Chevron Corporation, BP PLC, Qatar Jet Fuel Company, Allied Aviation Services Inc, Bharat Petroleum Corp Ltd, Gazprom Neft PJSC*List Not Exhaustive.
3. What are the main segments of the Jet Fuel Market?
The market segments include Fuel Type, Application.
4. Can you provide details about the market size?
The market size is estimated to be USD 175.76 Million as of 2022.
5. What are some drivers contributing to market growth?
4.; The Increasing Number of Air Passengers4.; Increasing use of Aircraft in Defence Sector.
6. What are the notable trends driving market growth?
The Commercial Segment to Dominate the Market.
7. Are there any restraints impacting market growth?
4.; The Increasing Number of Air Passengers4.; Increasing use of Aircraft in Defence Sector.
8. Can you provide examples of recent developments in the market?
April 2023: Indian Oil Corporation intends to form a joint venture with US-based clean energy technology company LanzaJet Inc and numerous domestic airlines to produce sustainable aviation fuel (SAF). At USD 366 million, the proposed business will establish a factory to manufacture SAF using alcohol-to-jet technology at the state-run company's Panipat refinery in Haryana.
9. What pricing options are available for accessing the report?
Pricing options include single-user, multi-user, and enterprise licenses priced at USD 4750, USD 5250, and USD 8750 respectively.
10. Is the market size provided in terms of value or volume?
The market size is provided in terms of value, measured in Million and volume, measured in Billion.
11. Are there any specific market keywords associated with the report?
Yes, the market keyword associated with the report is "Jet Fuel Market," which aids in identifying and referencing the specific market segment covered.
12. How do I determine which pricing option suits my needs best?
The pricing options vary based on user requirements and access needs. Individual users may opt for single-user licenses, while businesses requiring broader access may choose multi-user or enterprise licenses for cost-effective access to the report.
13. Are there any additional resources or data provided in the Jet Fuel Market report?
While the report offers comprehensive insights, it's advisable to review the specific contents or supplementary materials provided to ascertain if additional resources or data are available.
14. How can I stay updated on further developments or reports in the Jet Fuel Market?
To stay informed about further developments, trends, and reports in the Jet Fuel Market, consider subscribing to industry newsletters, following relevant companies and organizations, or regularly checking reputable industry news sources and publications.
Methodology
Step 1 - Identification of Relevant Samples Size from Population Database


Step 2 - Approaches for Defining Global Market Size (Value, Volume* & Price*)

Note*: In applicable scenarios
Step 3 - Data Sources
Primary Research
- Web Analytics
- Survey Reports
- Research Institute
- Latest Research Reports
- Opinion Leaders
Secondary Research
- Annual Reports
- White Paper
- Latest Press Release
- Industry Association
- Paid Database
- Investor Presentations

Step 4 - Data Triangulation
Involves using different sources of information in order to increase the validity of a study
These sources are likely to be stakeholders in a program - participants, other researchers, program staff, other community members, and so on.
Then we put all data in single framework & apply various statistical tools to find out the dynamic on the market.
During the analysis stage, feedback from the stakeholder groups would be compared to determine areas of agreement as well as areas of divergence


