
Key Insights
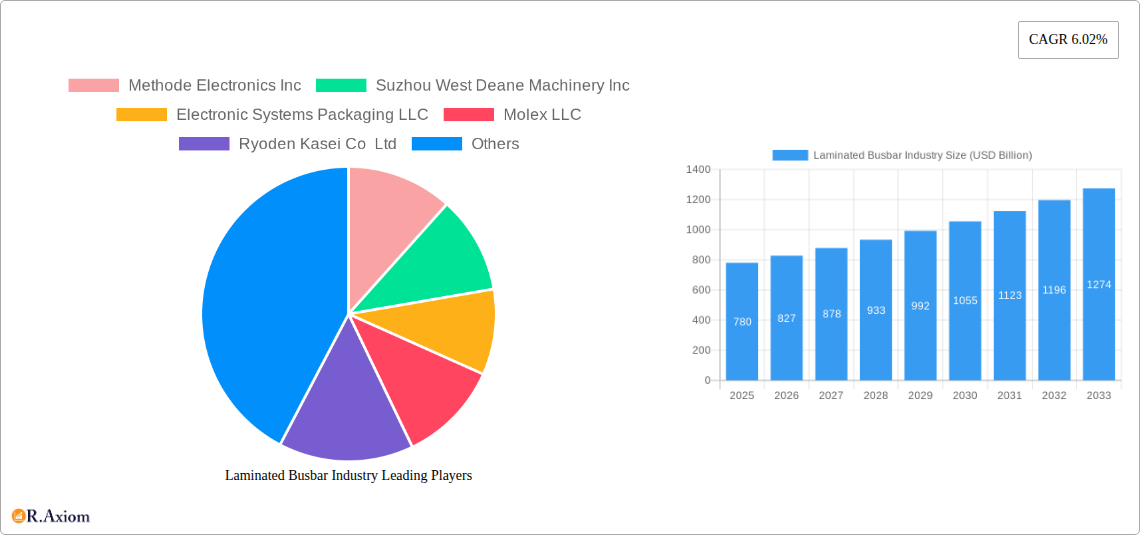
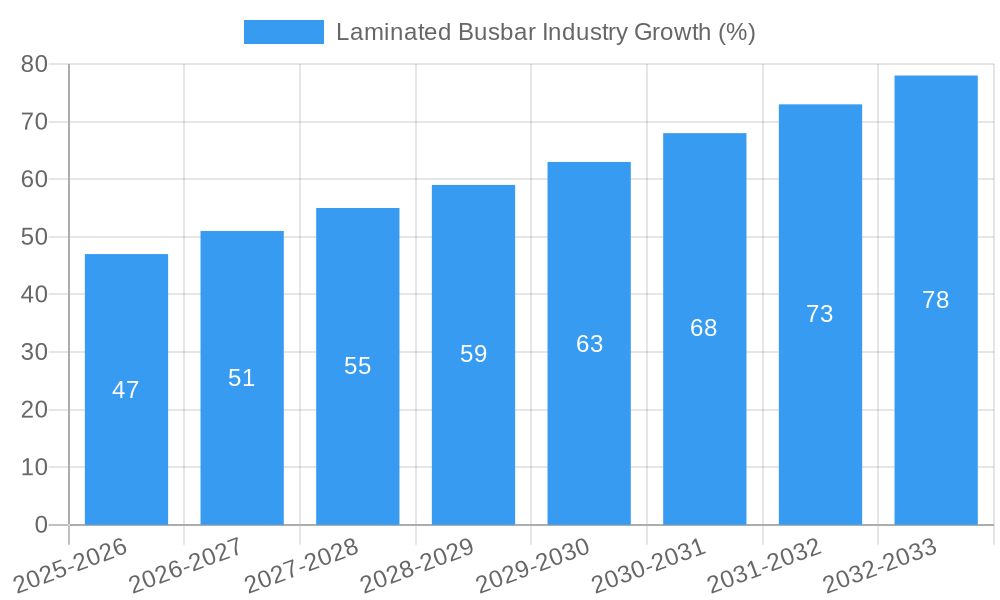
The laminated busbar market, valued at $0.78 billion in 2025, is projected to experience robust growth, driven by the increasing demand for efficient power transmission and distribution systems across diverse sectors. The Compound Annual Growth Rate (CAGR) of 6.02% from 2025 to 2033 indicates a significant expansion, fueled by several key factors. The rising adoption of renewable energy sources necessitates improved power handling capabilities, directly boosting the demand for laminated busbars. Furthermore, the ongoing trend toward miniaturization and increased power density in electronic devices, particularly within the industrial and transportation sectors, further contributes to market growth. Advancements in insulation materials, such as the use of epoxy powder coating and polyvinyl fluoride film, are enhancing the performance and reliability of laminated busbars, making them suitable for demanding applications. While potential restraints could include the fluctuating prices of raw materials like copper and aluminum, the overall market outlook remains positive due to sustained growth in end-user industries and ongoing technological advancements. The market is segmented by insulation material (epoxy powder coating, polyvinyl fluoride film, polyester, heat-resistant fiber, and others), end-user (power utilities, industrial, transportation, residential and commercial), and material (aluminum and copper), offering varied opportunities for market players. Key players like Methode Electronics, Molex, and Rogers Corporation are actively shaping the market through innovation and strategic expansions. Geographic growth is anticipated across North America, Europe, and Asia-Pacific, driven by infrastructure development and industrialization.
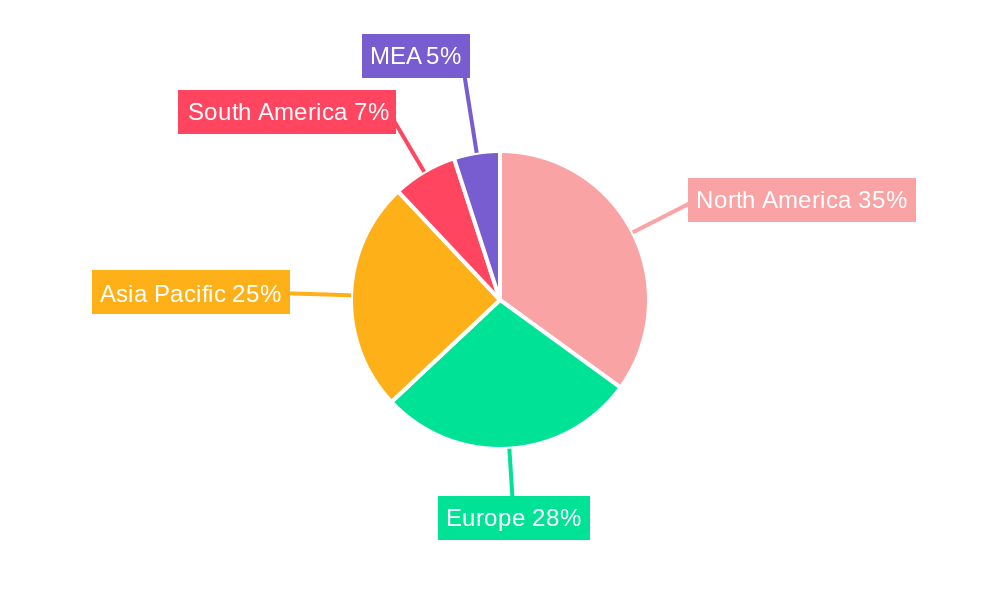
The geographical distribution of the market demonstrates a strong presence across various regions. North America, particularly the United States, is expected to hold a significant market share due to its advanced infrastructure and robust industrial base. Europe and Asia-Pacific are projected to witness considerable growth, driven by increasing energy demands and industrial expansion in these regions. The growth in these regions will be largely influenced by the adoption of advanced technologies, government initiatives promoting energy efficiency, and the rise of electric vehicles and renewable energy sources. South America and the Middle East & Africa are also expected to contribute to the market's overall growth, though at a potentially slower pace compared to the more developed regions. The forecast period of 2025-2033 presents a promising outlook for the laminated busbar industry, characterized by consistent growth and diversification across various applications and regions.
Laminated Busbar Industry Market Report: 2019-2033
This comprehensive report provides an in-depth analysis of the global laminated busbar industry, offering valuable insights for stakeholders, investors, and industry professionals. The report covers the period from 2019 to 2033, with a focus on the forecast period from 2025 to 2033 and a base year of 2025. The market is projected to reach a value of xx USD Billion by 2033, exhibiting a CAGR of xx% during the forecast period.
Laminated Busbar Industry Market Concentration & Innovation
This section analyzes the competitive landscape of the laminated busbar market, examining market concentration, innovation drivers, regulatory influences, and key industry activities. The market is moderately concentrated, with several key players holding significant market share. However, the presence of numerous smaller players indicates a dynamic and competitive environment.
- Market Share: The top five players (Methode Electronics Inc, Molex LLC, Eaton Corporation PLC, Amphenol Corporation, and Rogers Corporation) collectively hold an estimated xx% market share in 2025.
- Innovation Drivers: Key drivers include advancements in insulation materials (e.g., high-temperature resistant polymers), miniaturization trends, and the increasing demand for higher current carrying capacities. Furthermore, the integration of smart technologies and digitalization efforts are driving innovation.
- Regulatory Frameworks: Regulations concerning electrical safety and environmental compliance significantly influence the industry. Compliance with international standards and regional specifications is crucial for market participation.
- Product Substitutes: While laminated busbars offer advantages in terms of compactness and high current carrying capacity, alternative technologies such as traditional copper busbars continue to compete in specific applications.
- End-User Trends: The growing adoption of electric vehicles, renewable energy systems, and smart grids fuels market expansion across various end-user sectors.
- M&A Activities: The laminated busbar industry has witnessed several mergers and acquisitions in recent years, with deal values ranging from xx USD Billion to xx USD Billion, primarily driven by consolidation efforts and technology acquisition.
Laminated Busbar Industry Industry Trends & Insights
This section delves into the key trends shaping the laminated busbar market. Market growth is driven by the rising demand for reliable and efficient power transmission and distribution systems, particularly in rapidly developing economies. Technological advancements, such as the integration of advanced insulation materials and improved manufacturing processes, are enhancing the performance and reliability of laminated busbars. Consumer preferences are increasingly shifting towards compact, lightweight, and environmentally friendly solutions. The competitive landscape is characterized by intense competition among established players and emerging companies, leading to continuous product innovations and cost reductions.
The market is segmented based on insulation material, end-user, and material, with distinct growth trajectories within each segment. For example, the demand for Epoxy Powder Coating as insulation material is projected to grow at a CAGR of xx% during the forecast period, driven by its cost-effectiveness and excellent electrical insulation properties. The power utility segment is expected to dominate the market, accounting for xx% of total revenue by 2033.
Dominant Markets & Segments in Laminated Busbar Industry
The Asia-Pacific region is projected to dominate the global laminated busbar market throughout the forecast period. China's rapid industrialization and infrastructure development initiatives drive significant demand.
Key Drivers:
- Rapid Industrialization: Extensive industrial expansion and infrastructure projects in developing economies fuel the need for efficient power distribution systems.
- Government Initiatives: Supportive government policies and investments in renewable energy infrastructure further stimulate market growth.
- Technological Advancements: Innovation in insulation materials and manufacturing processes leads to superior product quality and wider applications.
Dominant Segments:
- Insulation Material: Epoxy Powder Coating holds the largest market share due to its cost-effectiveness and widespread use.
- End-User: The power utilities segment accounts for the highest proportion of revenue due to the significant requirement of laminated busbars in power transmission and distribution networks.
- Material: Copper remains the dominant material due to its excellent conductivity.
Laminated Busbar Industry Product Developments
Recent product innovations focus on enhancing thermal management, improving current carrying capacity, and minimizing size and weight. These advancements cater to the growing demand for high-performance and space-saving solutions in various applications, such as electric vehicles and renewable energy systems. Furthermore, the development of new insulation materials with improved dielectric strength and thermal stability provides a competitive advantage to manufacturers. The market is witnessing a trend towards the integration of smart sensors and digital monitoring systems for improved operational efficiency and predictive maintenance.
Report Scope & Segmentation Analysis
This report segments the laminated busbar market based on Insulation Material (Epoxy Powder Coating, Polyvinyl Fluoride Film, Polyester, Heat-Resistant Fiber, Other Insulation Materials), End-User (Power Utilities, Industrial, Transportation, Residential and Commercial), and Material (Aluminum, Copper). Each segment's growth projections, market size, and competitive dynamics are analyzed comprehensively. For instance, the Power Utilities segment is expected to witness significant growth, driven by large-scale infrastructure projects and the increasing demand for reliable power transmission systems. Similarly, the demand for Epoxy Powder Coating is projected to grow steadily due to its cost-effectiveness and excellent insulation properties.
Key Drivers of Laminated Busbar Industry Growth
The laminated busbar market is driven by several factors:
- Increasing Electrification: The global shift towards electrification across various sectors, including transportation, manufacturing, and residential applications, significantly boosts demand.
- Renewable Energy Growth: The expanding renewable energy sector requires robust and efficient power distribution systems, driving the adoption of laminated busbars.
- Infrastructure Development: Ongoing infrastructure projects worldwide, particularly in developing economies, fuel the need for efficient power transmission and distribution.
Challenges in the Laminated Busbar Industry Sector
Challenges include:
- Raw Material Price Volatility: Fluctuations in the prices of copper and aluminum impact production costs and profitability.
- Stringent Regulations: Compliance with increasingly stringent safety and environmental regulations poses a challenge for manufacturers.
- Intense Competition: The market is characterized by intense competition, requiring manufacturers to continuously innovate and optimize their offerings.
Emerging Opportunities in Laminated Busbar Industry
Opportunities exist in:
- Smart Grid Technologies: The integration of smart grid technologies and the Internet of Things (IoT) creates opportunities for advanced busbar systems with monitoring and control capabilities.
- Electric Vehicle (EV) Industry: The rapid expansion of the EV industry is a major growth catalyst for laminated busbars due to their application in electric powertrain systems.
- High-Power Applications: Developments in high-power applications, such as data centers and industrial automation, drive the demand for high-current capacity laminated busbars.
Leading Players in the Laminated Busbar Industry Market
- Methode Electronics Inc
- Suzhou West Deane Machinery Inc
- Electronic Systems Packaging LLC
- Molex LLC
- Ryoden Kasei Co Ltd
- Rogers Corporation
- Shanghai Eagtop Electronic Technology Co Ltd
- Eaton Corporation PLC [Eaton Corporation PLC]
- Amphenol Corporation [Amphenol Corporation]
- Segue Electronics Inc
- Zhejiang RHI ELectric Co Ltd
- Mersen SA
- Zhuzhou CRRC Times Electric Co Ltd
- Sun King Power Electronics Group Ltd
- Raychem RPG Private Limited
- EMS Industrial & Service Company
- Storm Power Components
Key Developments in Laminated Busbar Industry Industry
- February 2020: ABB Ltd. announced plans to introduce laminated bus plate technology for low-voltage switchgear, integrating it with the ABB Ability platform for enhanced reliability, efficiency, and safety.
- March 2020: BRAR successfully completed factory cold tests of busbars and Aluminium Power Conducting Arms for SMS Group, signifying progress in technological advancements and industry collaboration.
Strategic Outlook for Laminated Busbar Industry Market
The laminated busbar market is poised for significant growth, driven by the increasing demand for efficient power distribution systems and the expansion of various end-use industries. Innovation in materials science and manufacturing processes will play a crucial role in shaping the future of the industry. Strategic partnerships and collaborations will be vital for players to expand their market presence and offer integrated solutions catering to evolving customer needs. The focus will remain on enhanced efficiency, reliability, and sustainability, aligning with global environmental goals and the pursuit of a greener energy future.
Laminated Busbar Industry Segmentation
-
1. Material
- 1.1. Aluminum
- 1.2. Copper
-
2. Insulation Material
- 2.1. Epoxy Powder Coating
- 2.2. Polyvinyl Fluoride Film
- 2.3. Polyester
- 2.4. Heat-Resistant Fiber
- 2.5. Other Insulation Materials
-
3. End-User
- 3.1. Power Utilities
- 3.2. Industrial
- 3.3. Transportation
- 3.4. Residential and Commercial
Laminated Busbar Industry Segmentation By Geography
- 1. North America
- 2. Europe
- 3. Asia Pacific
- 4. South America
- 5. Middle East
Laminated Busbar Industry REPORT HIGHLIGHTS
| Aspects | Details |
|---|---|
| Study Period | 2019-2033 |
| Base Year | 2024 |
| Estimated Year | 2025 |
| Forecast Period | 2025-2033 |
| Historical Period | 2019-2024 |
| Growth Rate | CAGR of 6.02% from 2019-2033 |
| Segmentation |
|
Table of Contents
- 1. Introduction
- 1.1. Research Scope
- 1.2. Market Segmentation
- 1.3. Research Methodology
- 1.4. Definitions and Assumptions
- 2. Executive Summary
- 2.1. Introduction
- 3. Market Dynamics
- 3.1. Introduction
- 3.2. Market Drivers
- 3.2.1. 4.; Growing Energy Demand4.; Renewable Energy Transition
- 3.3. Market Restrains
- 3.3.1. 4.; Phasing out of Conventional Sources of Electricity
- 3.4. Market Trends
- 3.4.1. Power Utility Sub-sector to Dominate the Market
- 4. Market Factor Analysis
- 4.1. Porters Five Forces
- 4.2. Supply/Value Chain
- 4.3. PESTEL analysis
- 4.4. Market Entropy
- 4.5. Patent/Trademark Analysis
- 5. Global Laminated Busbar Industry Analysis, Insights and Forecast, 2019-2031
- 5.1. Market Analysis, Insights and Forecast - by Material
- 5.1.1. Aluminum
- 5.1.2. Copper
- 5.2. Market Analysis, Insights and Forecast - by Insulation Material
- 5.2.1. Epoxy Powder Coating
- 5.2.2. Polyvinyl Fluoride Film
- 5.2.3. Polyester
- 5.2.4. Heat-Resistant Fiber
- 5.2.5. Other Insulation Materials
- 5.3. Market Analysis, Insights and Forecast - by End-User
- 5.3.1. Power Utilities
- 5.3.2. Industrial
- 5.3.3. Transportation
- 5.3.4. Residential and Commercial
- 5.4. Market Analysis, Insights and Forecast - by Region
- 5.4.1. North America
- 5.4.2. Europe
- 5.4.3. Asia Pacific
- 5.4.4. South America
- 5.4.5. Middle East
- 5.1. Market Analysis, Insights and Forecast - by Material
- 6. North America Laminated Busbar Industry Analysis, Insights and Forecast, 2019-2031
- 6.1. Market Analysis, Insights and Forecast - by Material
- 6.1.1. Aluminum
- 6.1.2. Copper
- 6.2. Market Analysis, Insights and Forecast - by Insulation Material
- 6.2.1. Epoxy Powder Coating
- 6.2.2. Polyvinyl Fluoride Film
- 6.2.3. Polyester
- 6.2.4. Heat-Resistant Fiber
- 6.2.5. Other Insulation Materials
- 6.3. Market Analysis, Insights and Forecast - by End-User
- 6.3.1. Power Utilities
- 6.3.2. Industrial
- 6.3.3. Transportation
- 6.3.4. Residential and Commercial
- 6.1. Market Analysis, Insights and Forecast - by Material
- 7. Europe Laminated Busbar Industry Analysis, Insights and Forecast, 2019-2031
- 7.1. Market Analysis, Insights and Forecast - by Material
- 7.1.1. Aluminum
- 7.1.2. Copper
- 7.2. Market Analysis, Insights and Forecast - by Insulation Material
- 7.2.1. Epoxy Powder Coating
- 7.2.2. Polyvinyl Fluoride Film
- 7.2.3. Polyester
- 7.2.4. Heat-Resistant Fiber
- 7.2.5. Other Insulation Materials
- 7.3. Market Analysis, Insights and Forecast - by End-User
- 7.3.1. Power Utilities
- 7.3.2. Industrial
- 7.3.3. Transportation
- 7.3.4. Residential and Commercial
- 7.1. Market Analysis, Insights and Forecast - by Material
- 8. Asia Pacific Laminated Busbar Industry Analysis, Insights and Forecast, 2019-2031
- 8.1. Market Analysis, Insights and Forecast - by Material
- 8.1.1. Aluminum
- 8.1.2. Copper
- 8.2. Market Analysis, Insights and Forecast - by Insulation Material
- 8.2.1. Epoxy Powder Coating
- 8.2.2. Polyvinyl Fluoride Film
- 8.2.3. Polyester
- 8.2.4. Heat-Resistant Fiber
- 8.2.5. Other Insulation Materials
- 8.3. Market Analysis, Insights and Forecast - by End-User
- 8.3.1. Power Utilities
- 8.3.2. Industrial
- 8.3.3. Transportation
- 8.3.4. Residential and Commercial
- 8.1. Market Analysis, Insights and Forecast - by Material
- 9. South America Laminated Busbar Industry Analysis, Insights and Forecast, 2019-2031
- 9.1. Market Analysis, Insights and Forecast - by Material
- 9.1.1. Aluminum
- 9.1.2. Copper
- 9.2. Market Analysis, Insights and Forecast - by Insulation Material
- 9.2.1. Epoxy Powder Coating
- 9.2.2. Polyvinyl Fluoride Film
- 9.2.3. Polyester
- 9.2.4. Heat-Resistant Fiber
- 9.2.5. Other Insulation Materials
- 9.3. Market Analysis, Insights and Forecast - by End-User
- 9.3.1. Power Utilities
- 9.3.2. Industrial
- 9.3.3. Transportation
- 9.3.4. Residential and Commercial
- 9.1. Market Analysis, Insights and Forecast - by Material
- 10. Middle East Laminated Busbar Industry Analysis, Insights and Forecast, 2019-2031
- 10.1. Market Analysis, Insights and Forecast - by Material
- 10.1.1. Aluminum
- 10.1.2. Copper
- 10.2. Market Analysis, Insights and Forecast - by Insulation Material
- 10.2.1. Epoxy Powder Coating
- 10.2.2. Polyvinyl Fluoride Film
- 10.2.3. Polyester
- 10.2.4. Heat-Resistant Fiber
- 10.2.5. Other Insulation Materials
- 10.3. Market Analysis, Insights and Forecast - by End-User
- 10.3.1. Power Utilities
- 10.3.2. Industrial
- 10.3.3. Transportation
- 10.3.4. Residential and Commercial
- 10.1. Market Analysis, Insights and Forecast - by Material
- 11. North America Laminated Busbar Industry Analysis, Insights and Forecast, 2019-2031
- 11.1. Market Analysis, Insights and Forecast - By Country/Sub-region
- 11.1.1 United States
- 11.1.2 Canada
- 11.1.3 Mexico
- 12. Europe Laminated Busbar Industry Analysis, Insights and Forecast, 2019-2031
- 12.1. Market Analysis, Insights and Forecast - By Country/Sub-region
- 12.1.1 Germany
- 12.1.2 United Kingdom
- 12.1.3 France
- 12.1.4 Spain
- 12.1.5 Italy
- 12.1.6 Spain
- 12.1.7 Belgium
- 12.1.8 Netherland
- 12.1.9 Nordics
- 12.1.10 Rest of Europe
- 13. Asia Pacific Laminated Busbar Industry Analysis, Insights and Forecast, 2019-2031
- 13.1. Market Analysis, Insights and Forecast - By Country/Sub-region
- 13.1.1 China
- 13.1.2 Japan
- 13.1.3 India
- 13.1.4 South Korea
- 13.1.5 Southeast Asia
- 13.1.6 Australia
- 13.1.7 Indonesia
- 13.1.8 Phillipes
- 13.1.9 Singapore
- 13.1.10 Thailandc
- 13.1.11 Rest of Asia Pacific
- 14. South America Laminated Busbar Industry Analysis, Insights and Forecast, 2019-2031
- 14.1. Market Analysis, Insights and Forecast - By Country/Sub-region
- 14.1.1 Brazil
- 14.1.2 Argentina
- 14.1.3 Peru
- 14.1.4 Chile
- 14.1.5 Colombia
- 14.1.6 Ecuador
- 14.1.7 Venezuela
- 14.1.8 Rest of South America
- 15. North America Laminated Busbar Industry Analysis, Insights and Forecast, 2019-2031
- 15.1. Market Analysis, Insights and Forecast - By Country/Sub-region
- 15.1.1 United States
- 15.1.2 Canada
- 15.1.3 Mexico
- 16. MEA Laminated Busbar Industry Analysis, Insights and Forecast, 2019-2031
- 16.1. Market Analysis, Insights and Forecast - By Country/Sub-region
- 16.1.1 United Arab Emirates
- 16.1.2 Saudi Arabia
- 16.1.3 South Africa
- 16.1.4 Rest of Middle East and Africa
- 17. Competitive Analysis
- 17.1. Global Market Share Analysis 2024
- 17.2. Company Profiles
- 17.2.1 Methode Electronics Inc
- 17.2.1.1. Overview
- 17.2.1.2. Products
- 17.2.1.3. SWOT Analysis
- 17.2.1.4. Recent Developments
- 17.2.1.5. Financials (Based on Availability)
- 17.2.2 Suzhou West Deane Machinery Inc
- 17.2.2.1. Overview
- 17.2.2.2. Products
- 17.2.2.3. SWOT Analysis
- 17.2.2.4. Recent Developments
- 17.2.2.5. Financials (Based on Availability)
- 17.2.3 Electronic Systems Packaging LLC
- 17.2.3.1. Overview
- 17.2.3.2. Products
- 17.2.3.3. SWOT Analysis
- 17.2.3.4. Recent Developments
- 17.2.3.5. Financials (Based on Availability)
- 17.2.4 Molex LLC
- 17.2.4.1. Overview
- 17.2.4.2. Products
- 17.2.4.3. SWOT Analysis
- 17.2.4.4. Recent Developments
- 17.2.4.5. Financials (Based on Availability)
- 17.2.5 Ryoden Kasei Co Ltd
- 17.2.5.1. Overview
- 17.2.5.2. Products
- 17.2.5.3. SWOT Analysis
- 17.2.5.4. Recent Developments
- 17.2.5.5. Financials (Based on Availability)
- 17.2.6 Rogers Corporation
- 17.2.6.1. Overview
- 17.2.6.2. Products
- 17.2.6.3. SWOT Analysis
- 17.2.6.4. Recent Developments
- 17.2.6.5. Financials (Based on Availability)
- 17.2.7 Shanghai Eagtop Electronic Technology Co Ltd
- 17.2.7.1. Overview
- 17.2.7.2. Products
- 17.2.7.3. SWOT Analysis
- 17.2.7.4. Recent Developments
- 17.2.7.5. Financials (Based on Availability)
- 17.2.8 Eaton Corporation PLC
- 17.2.8.1. Overview
- 17.2.8.2. Products
- 17.2.8.3. SWOT Analysis
- 17.2.8.4. Recent Developments
- 17.2.8.5. Financials (Based on Availability)
- 17.2.9 Amphenol Corporation
- 17.2.9.1. Overview
- 17.2.9.2. Products
- 17.2.9.3. SWOT Analysis
- 17.2.9.4. Recent Developments
- 17.2.9.5. Financials (Based on Availability)
- 17.2.10 Segue Electronics Inc *List Not Exhaustive
- 17.2.10.1. Overview
- 17.2.10.2. Products
- 17.2.10.3. SWOT Analysis
- 17.2.10.4. Recent Developments
- 17.2.10.5. Financials (Based on Availability)
- 17.2.11 Zhejiang RHI ELectric Co Ltd
- 17.2.11.1. Overview
- 17.2.11.2. Products
- 17.2.11.3. SWOT Analysis
- 17.2.11.4. Recent Developments
- 17.2.11.5. Financials (Based on Availability)
- 17.2.12 Mersen SA
- 17.2.12.1. Overview
- 17.2.12.2. Products
- 17.2.12.3. SWOT Analysis
- 17.2.12.4. Recent Developments
- 17.2.12.5. Financials (Based on Availability)
- 17.2.13 Zhuzhou CRRC Times Electric Co Ltd
- 17.2.13.1. Overview
- 17.2.13.2. Products
- 17.2.13.3. SWOT Analysis
- 17.2.13.4. Recent Developments
- 17.2.13.5. Financials (Based on Availability)
- 17.2.14 Sun King Power Electronics Group Ltd
- 17.2.14.1. Overview
- 17.2.14.2. Products
- 17.2.14.3. SWOT Analysis
- 17.2.14.4. Recent Developments
- 17.2.14.5. Financials (Based on Availability)
- 17.2.15 Raychem RPG Private Limited
- 17.2.15.1. Overview
- 17.2.15.2. Products
- 17.2.15.3. SWOT Analysis
- 17.2.15.4. Recent Developments
- 17.2.15.5. Financials (Based on Availability)
- 17.2.16 EMS Industrial & Service Company
- 17.2.16.1. Overview
- 17.2.16.2. Products
- 17.2.16.3. SWOT Analysis
- 17.2.16.4. Recent Developments
- 17.2.16.5. Financials (Based on Availability)
- 17.2.17 Storm Power Components
- 17.2.17.1. Overview
- 17.2.17.2. Products
- 17.2.17.3. SWOT Analysis
- 17.2.17.4. Recent Developments
- 17.2.17.5. Financials (Based on Availability)
- 17.2.1 Methode Electronics Inc
List of Figures
- Figure 1: Global Laminated Busbar Industry Revenue Breakdown (USD Billion, %) by Region 2024 & 2032
- Figure 2: Global Laminated Busbar Industry Volume Breakdown (K Units, %) by Region 2024 & 2032
- Figure 3: North America Laminated Busbar Industry Revenue (USD Billion), by Country 2024 & 2032
- Figure 4: North America Laminated Busbar Industry Volume (K Units), by Country 2024 & 2032
- Figure 5: North America Laminated Busbar Industry Revenue Share (%), by Country 2024 & 2032
- Figure 6: North America Laminated Busbar Industry Volume Share (%), by Country 2024 & 2032
- Figure 7: Europe Laminated Busbar Industry Revenue (USD Billion), by Country 2024 & 2032
- Figure 8: Europe Laminated Busbar Industry Volume (K Units), by Country 2024 & 2032
- Figure 9: Europe Laminated Busbar Industry Revenue Share (%), by Country 2024 & 2032
- Figure 10: Europe Laminated Busbar Industry Volume Share (%), by Country 2024 & 2032
- Figure 11: Asia Pacific Laminated Busbar Industry Revenue (USD Billion), by Country 2024 & 2032
- Figure 12: Asia Pacific Laminated Busbar Industry Volume (K Units), by Country 2024 & 2032
- Figure 13: Asia Pacific Laminated Busbar Industry Revenue Share (%), by Country 2024 & 2032
- Figure 14: Asia Pacific Laminated Busbar Industry Volume Share (%), by Country 2024 & 2032
- Figure 15: South America Laminated Busbar Industry Revenue (USD Billion), by Country 2024 & 2032
- Figure 16: South America Laminated Busbar Industry Volume (K Units), by Country 2024 & 2032
- Figure 17: South America Laminated Busbar Industry Revenue Share (%), by Country 2024 & 2032
- Figure 18: South America Laminated Busbar Industry Volume Share (%), by Country 2024 & 2032
- Figure 19: North America Laminated Busbar Industry Revenue (USD Billion), by Country 2024 & 2032
- Figure 20: North America Laminated Busbar Industry Volume (K Units), by Country 2024 & 2032
- Figure 21: North America Laminated Busbar Industry Revenue Share (%), by Country 2024 & 2032
- Figure 22: North America Laminated Busbar Industry Volume Share (%), by Country 2024 & 2032
- Figure 23: MEA Laminated Busbar Industry Revenue (USD Billion), by Country 2024 & 2032
- Figure 24: MEA Laminated Busbar Industry Volume (K Units), by Country 2024 & 2032
- Figure 25: MEA Laminated Busbar Industry Revenue Share (%), by Country 2024 & 2032
- Figure 26: MEA Laminated Busbar Industry Volume Share (%), by Country 2024 & 2032
- Figure 27: North America Laminated Busbar Industry Revenue (USD Billion), by Material 2024 & 2032
- Figure 28: North America Laminated Busbar Industry Volume (K Units), by Material 2024 & 2032
- Figure 29: North America Laminated Busbar Industry Revenue Share (%), by Material 2024 & 2032
- Figure 30: North America Laminated Busbar Industry Volume Share (%), by Material 2024 & 2032
- Figure 31: North America Laminated Busbar Industry Revenue (USD Billion), by Insulation Material 2024 & 2032
- Figure 32: North America Laminated Busbar Industry Volume (K Units), by Insulation Material 2024 & 2032
- Figure 33: North America Laminated Busbar Industry Revenue Share (%), by Insulation Material 2024 & 2032
- Figure 34: North America Laminated Busbar Industry Volume Share (%), by Insulation Material 2024 & 2032
- Figure 35: North America Laminated Busbar Industry Revenue (USD Billion), by End-User 2024 & 2032
- Figure 36: North America Laminated Busbar Industry Volume (K Units), by End-User 2024 & 2032
- Figure 37: North America Laminated Busbar Industry Revenue Share (%), by End-User 2024 & 2032
- Figure 38: North America Laminated Busbar Industry Volume Share (%), by End-User 2024 & 2032
- Figure 39: North America Laminated Busbar Industry Revenue (USD Billion), by Country 2024 & 2032
- Figure 40: North America Laminated Busbar Industry Volume (K Units), by Country 2024 & 2032
- Figure 41: North America Laminated Busbar Industry Revenue Share (%), by Country 2024 & 2032
- Figure 42: North America Laminated Busbar Industry Volume Share (%), by Country 2024 & 2032
- Figure 43: Europe Laminated Busbar Industry Revenue (USD Billion), by Material 2024 & 2032
- Figure 44: Europe Laminated Busbar Industry Volume (K Units), by Material 2024 & 2032
- Figure 45: Europe Laminated Busbar Industry Revenue Share (%), by Material 2024 & 2032
- Figure 46: Europe Laminated Busbar Industry Volume Share (%), by Material 2024 & 2032
- Figure 47: Europe Laminated Busbar Industry Revenue (USD Billion), by Insulation Material 2024 & 2032
- Figure 48: Europe Laminated Busbar Industry Volume (K Units), by Insulation Material 2024 & 2032
- Figure 49: Europe Laminated Busbar Industry Revenue Share (%), by Insulation Material 2024 & 2032
- Figure 50: Europe Laminated Busbar Industry Volume Share (%), by Insulation Material 2024 & 2032
- Figure 51: Europe Laminated Busbar Industry Revenue (USD Billion), by End-User 2024 & 2032
- Figure 52: Europe Laminated Busbar Industry Volume (K Units), by End-User 2024 & 2032
- Figure 53: Europe Laminated Busbar Industry Revenue Share (%), by End-User 2024 & 2032
- Figure 54: Europe Laminated Busbar Industry Volume Share (%), by End-User 2024 & 2032
- Figure 55: Europe Laminated Busbar Industry Revenue (USD Billion), by Country 2024 & 2032
- Figure 56: Europe Laminated Busbar Industry Volume (K Units), by Country 2024 & 2032
- Figure 57: Europe Laminated Busbar Industry Revenue Share (%), by Country 2024 & 2032
- Figure 58: Europe Laminated Busbar Industry Volume Share (%), by Country 2024 & 2032
- Figure 59: Asia Pacific Laminated Busbar Industry Revenue (USD Billion), by Material 2024 & 2032
- Figure 60: Asia Pacific Laminated Busbar Industry Volume (K Units), by Material 2024 & 2032
- Figure 61: Asia Pacific Laminated Busbar Industry Revenue Share (%), by Material 2024 & 2032
- Figure 62: Asia Pacific Laminated Busbar Industry Volume Share (%), by Material 2024 & 2032
- Figure 63: Asia Pacific Laminated Busbar Industry Revenue (USD Billion), by Insulation Material 2024 & 2032
- Figure 64: Asia Pacific Laminated Busbar Industry Volume (K Units), by Insulation Material 2024 & 2032
- Figure 65: Asia Pacific Laminated Busbar Industry Revenue Share (%), by Insulation Material 2024 & 2032
- Figure 66: Asia Pacific Laminated Busbar Industry Volume Share (%), by Insulation Material 2024 & 2032
- Figure 67: Asia Pacific Laminated Busbar Industry Revenue (USD Billion), by End-User 2024 & 2032
- Figure 68: Asia Pacific Laminated Busbar Industry Volume (K Units), by End-User 2024 & 2032
- Figure 69: Asia Pacific Laminated Busbar Industry Revenue Share (%), by End-User 2024 & 2032
- Figure 70: Asia Pacific Laminated Busbar Industry Volume Share (%), by End-User 2024 & 2032
- Figure 71: Asia Pacific Laminated Busbar Industry Revenue (USD Billion), by Country 2024 & 2032
- Figure 72: Asia Pacific Laminated Busbar Industry Volume (K Units), by Country 2024 & 2032
- Figure 73: Asia Pacific Laminated Busbar Industry Revenue Share (%), by Country 2024 & 2032
- Figure 74: Asia Pacific Laminated Busbar Industry Volume Share (%), by Country 2024 & 2032
- Figure 75: South America Laminated Busbar Industry Revenue (USD Billion), by Material 2024 & 2032
- Figure 76: South America Laminated Busbar Industry Volume (K Units), by Material 2024 & 2032
- Figure 77: South America Laminated Busbar Industry Revenue Share (%), by Material 2024 & 2032
- Figure 78: South America Laminated Busbar Industry Volume Share (%), by Material 2024 & 2032
- Figure 79: South America Laminated Busbar Industry Revenue (USD Billion), by Insulation Material 2024 & 2032
- Figure 80: South America Laminated Busbar Industry Volume (K Units), by Insulation Material 2024 & 2032
- Figure 81: South America Laminated Busbar Industry Revenue Share (%), by Insulation Material 2024 & 2032
- Figure 82: South America Laminated Busbar Industry Volume Share (%), by Insulation Material 2024 & 2032
- Figure 83: South America Laminated Busbar Industry Revenue (USD Billion), by End-User 2024 & 2032
- Figure 84: South America Laminated Busbar Industry Volume (K Units), by End-User 2024 & 2032
- Figure 85: South America Laminated Busbar Industry Revenue Share (%), by End-User 2024 & 2032
- Figure 86: South America Laminated Busbar Industry Volume Share (%), by End-User 2024 & 2032
- Figure 87: South America Laminated Busbar Industry Revenue (USD Billion), by Country 2024 & 2032
- Figure 88: South America Laminated Busbar Industry Volume (K Units), by Country 2024 & 2032
- Figure 89: South America Laminated Busbar Industry Revenue Share (%), by Country 2024 & 2032
- Figure 90: South America Laminated Busbar Industry Volume Share (%), by Country 2024 & 2032
- Figure 91: Middle East Laminated Busbar Industry Revenue (USD Billion), by Material 2024 & 2032
- Figure 92: Middle East Laminated Busbar Industry Volume (K Units), by Material 2024 & 2032
- Figure 93: Middle East Laminated Busbar Industry Revenue Share (%), by Material 2024 & 2032
- Figure 94: Middle East Laminated Busbar Industry Volume Share (%), by Material 2024 & 2032
- Figure 95: Middle East Laminated Busbar Industry Revenue (USD Billion), by Insulation Material 2024 & 2032
- Figure 96: Middle East Laminated Busbar Industry Volume (K Units), by Insulation Material 2024 & 2032
- Figure 97: Middle East Laminated Busbar Industry Revenue Share (%), by Insulation Material 2024 & 2032
- Figure 98: Middle East Laminated Busbar Industry Volume Share (%), by Insulation Material 2024 & 2032
- Figure 99: Middle East Laminated Busbar Industry Revenue (USD Billion), by End-User 2024 & 2032
- Figure 100: Middle East Laminated Busbar Industry Volume (K Units), by End-User 2024 & 2032
- Figure 101: Middle East Laminated Busbar Industry Revenue Share (%), by End-User 2024 & 2032
- Figure 102: Middle East Laminated Busbar Industry Volume Share (%), by End-User 2024 & 2032
- Figure 103: Middle East Laminated Busbar Industry Revenue (USD Billion), by Country 2024 & 2032
- Figure 104: Middle East Laminated Busbar Industry Volume (K Units), by Country 2024 & 2032
- Figure 105: Middle East Laminated Busbar Industry Revenue Share (%), by Country 2024 & 2032
- Figure 106: Middle East Laminated Busbar Industry Volume Share (%), by Country 2024 & 2032
List of Tables
- Table 1: Global Laminated Busbar Industry Revenue USD Billion Forecast, by Region 2019 & 2032
- Table 2: Global Laminated Busbar Industry Volume K Units Forecast, by Region 2019 & 2032
- Table 3: Global Laminated Busbar Industry Revenue USD Billion Forecast, by Material 2019 & 2032
- Table 4: Global Laminated Busbar Industry Volume K Units Forecast, by Material 2019 & 2032
- Table 5: Global Laminated Busbar Industry Revenue USD Billion Forecast, by Insulation Material 2019 & 2032
- Table 6: Global Laminated Busbar Industry Volume K Units Forecast, by Insulation Material 2019 & 2032
- Table 7: Global Laminated Busbar Industry Revenue USD Billion Forecast, by End-User 2019 & 2032
- Table 8: Global Laminated Busbar Industry Volume K Units Forecast, by End-User 2019 & 2032
- Table 9: Global Laminated Busbar Industry Revenue USD Billion Forecast, by Region 2019 & 2032
- Table 10: Global Laminated Busbar Industry Volume K Units Forecast, by Region 2019 & 2032
- Table 11: Global Laminated Busbar Industry Revenue USD Billion Forecast, by Country 2019 & 2032
- Table 12: Global Laminated Busbar Industry Volume K Units Forecast, by Country 2019 & 2032
- Table 13: United States Laminated Busbar Industry Revenue (USD Billion) Forecast, by Application 2019 & 2032
- Table 14: United States Laminated Busbar Industry Volume (K Units) Forecast, by Application 2019 & 2032
- Table 15: Canada Laminated Busbar Industry Revenue (USD Billion) Forecast, by Application 2019 & 2032
- Table 16: Canada Laminated Busbar Industry Volume (K Units) Forecast, by Application 2019 & 2032
- Table 17: Mexico Laminated Busbar Industry Revenue (USD Billion) Forecast, by Application 2019 & 2032
- Table 18: Mexico Laminated Busbar Industry Volume (K Units) Forecast, by Application 2019 & 2032
- Table 19: Global Laminated Busbar Industry Revenue USD Billion Forecast, by Country 2019 & 2032
- Table 20: Global Laminated Busbar Industry Volume K Units Forecast, by Country 2019 & 2032
- Table 21: Germany Laminated Busbar Industry Revenue (USD Billion) Forecast, by Application 2019 & 2032
- Table 22: Germany Laminated Busbar Industry Volume (K Units) Forecast, by Application 2019 & 2032
- Table 23: United Kingdom Laminated Busbar Industry Revenue (USD Billion) Forecast, by Application 2019 & 2032
- Table 24: United Kingdom Laminated Busbar Industry Volume (K Units) Forecast, by Application 2019 & 2032
- Table 25: France Laminated Busbar Industry Revenue (USD Billion) Forecast, by Application 2019 & 2032
- Table 26: France Laminated Busbar Industry Volume (K Units) Forecast, by Application 2019 & 2032
- Table 27: Spain Laminated Busbar Industry Revenue (USD Billion) Forecast, by Application 2019 & 2032
- Table 28: Spain Laminated Busbar Industry Volume (K Units) Forecast, by Application 2019 & 2032
- Table 29: Italy Laminated Busbar Industry Revenue (USD Billion) Forecast, by Application 2019 & 2032
- Table 30: Italy Laminated Busbar Industry Volume (K Units) Forecast, by Application 2019 & 2032
- Table 31: Spain Laminated Busbar Industry Revenue (USD Billion) Forecast, by Application 2019 & 2032
- Table 32: Spain Laminated Busbar Industry Volume (K Units) Forecast, by Application 2019 & 2032
- Table 33: Belgium Laminated Busbar Industry Revenue (USD Billion) Forecast, by Application 2019 & 2032
- Table 34: Belgium Laminated Busbar Industry Volume (K Units) Forecast, by Application 2019 & 2032
- Table 35: Netherland Laminated Busbar Industry Revenue (USD Billion) Forecast, by Application 2019 & 2032
- Table 36: Netherland Laminated Busbar Industry Volume (K Units) Forecast, by Application 2019 & 2032
- Table 37: Nordics Laminated Busbar Industry Revenue (USD Billion) Forecast, by Application 2019 & 2032
- Table 38: Nordics Laminated Busbar Industry Volume (K Units) Forecast, by Application 2019 & 2032
- Table 39: Rest of Europe Laminated Busbar Industry Revenue (USD Billion) Forecast, by Application 2019 & 2032
- Table 40: Rest of Europe Laminated Busbar Industry Volume (K Units) Forecast, by Application 2019 & 2032
- Table 41: Global Laminated Busbar Industry Revenue USD Billion Forecast, by Country 2019 & 2032
- Table 42: Global Laminated Busbar Industry Volume K Units Forecast, by Country 2019 & 2032
- Table 43: China Laminated Busbar Industry Revenue (USD Billion) Forecast, by Application 2019 & 2032
- Table 44: China Laminated Busbar Industry Volume (K Units) Forecast, by Application 2019 & 2032
- Table 45: Japan Laminated Busbar Industry Revenue (USD Billion) Forecast, by Application 2019 & 2032
- Table 46: Japan Laminated Busbar Industry Volume (K Units) Forecast, by Application 2019 & 2032
- Table 47: India Laminated Busbar Industry Revenue (USD Billion) Forecast, by Application 2019 & 2032
- Table 48: India Laminated Busbar Industry Volume (K Units) Forecast, by Application 2019 & 2032
- Table 49: South Korea Laminated Busbar Industry Revenue (USD Billion) Forecast, by Application 2019 & 2032
- Table 50: South Korea Laminated Busbar Industry Volume (K Units) Forecast, by Application 2019 & 2032
- Table 51: Southeast Asia Laminated Busbar Industry Revenue (USD Billion) Forecast, by Application 2019 & 2032
- Table 52: Southeast Asia Laminated Busbar Industry Volume (K Units) Forecast, by Application 2019 & 2032
- Table 53: Australia Laminated Busbar Industry Revenue (USD Billion) Forecast, by Application 2019 & 2032
- Table 54: Australia Laminated Busbar Industry Volume (K Units) Forecast, by Application 2019 & 2032
- Table 55: Indonesia Laminated Busbar Industry Revenue (USD Billion) Forecast, by Application 2019 & 2032
- Table 56: Indonesia Laminated Busbar Industry Volume (K Units) Forecast, by Application 2019 & 2032
- Table 57: Phillipes Laminated Busbar Industry Revenue (USD Billion) Forecast, by Application 2019 & 2032
- Table 58: Phillipes Laminated Busbar Industry Volume (K Units) Forecast, by Application 2019 & 2032
- Table 59: Singapore Laminated Busbar Industry Revenue (USD Billion) Forecast, by Application 2019 & 2032
- Table 60: Singapore Laminated Busbar Industry Volume (K Units) Forecast, by Application 2019 & 2032
- Table 61: Thailandc Laminated Busbar Industry Revenue (USD Billion) Forecast, by Application 2019 & 2032
- Table 62: Thailandc Laminated Busbar Industry Volume (K Units) Forecast, by Application 2019 & 2032
- Table 63: Rest of Asia Pacific Laminated Busbar Industry Revenue (USD Billion) Forecast, by Application 2019 & 2032
- Table 64: Rest of Asia Pacific Laminated Busbar Industry Volume (K Units) Forecast, by Application 2019 & 2032
- Table 65: Global Laminated Busbar Industry Revenue USD Billion Forecast, by Country 2019 & 2032
- Table 66: Global Laminated Busbar Industry Volume K Units Forecast, by Country 2019 & 2032
- Table 67: Brazil Laminated Busbar Industry Revenue (USD Billion) Forecast, by Application 2019 & 2032
- Table 68: Brazil Laminated Busbar Industry Volume (K Units) Forecast, by Application 2019 & 2032
- Table 69: Argentina Laminated Busbar Industry Revenue (USD Billion) Forecast, by Application 2019 & 2032
- Table 70: Argentina Laminated Busbar Industry Volume (K Units) Forecast, by Application 2019 & 2032
- Table 71: Peru Laminated Busbar Industry Revenue (USD Billion) Forecast, by Application 2019 & 2032
- Table 72: Peru Laminated Busbar Industry Volume (K Units) Forecast, by Application 2019 & 2032
- Table 73: Chile Laminated Busbar Industry Revenue (USD Billion) Forecast, by Application 2019 & 2032
- Table 74: Chile Laminated Busbar Industry Volume (K Units) Forecast, by Application 2019 & 2032
- Table 75: Colombia Laminated Busbar Industry Revenue (USD Billion) Forecast, by Application 2019 & 2032
- Table 76: Colombia Laminated Busbar Industry Volume (K Units) Forecast, by Application 2019 & 2032
- Table 77: Ecuador Laminated Busbar Industry Revenue (USD Billion) Forecast, by Application 2019 & 2032
- Table 78: Ecuador Laminated Busbar Industry Volume (K Units) Forecast, by Application 2019 & 2032
- Table 79: Venezuela Laminated Busbar Industry Revenue (USD Billion) Forecast, by Application 2019 & 2032
- Table 80: Venezuela Laminated Busbar Industry Volume (K Units) Forecast, by Application 2019 & 2032
- Table 81: Rest of South America Laminated Busbar Industry Revenue (USD Billion) Forecast, by Application 2019 & 2032
- Table 82: Rest of South America Laminated Busbar Industry Volume (K Units) Forecast, by Application 2019 & 2032
- Table 83: Global Laminated Busbar Industry Revenue USD Billion Forecast, by Country 2019 & 2032
- Table 84: Global Laminated Busbar Industry Volume K Units Forecast, by Country 2019 & 2032
- Table 85: United States Laminated Busbar Industry Revenue (USD Billion) Forecast, by Application 2019 & 2032
- Table 86: United States Laminated Busbar Industry Volume (K Units) Forecast, by Application 2019 & 2032
- Table 87: Canada Laminated Busbar Industry Revenue (USD Billion) Forecast, by Application 2019 & 2032
- Table 88: Canada Laminated Busbar Industry Volume (K Units) Forecast, by Application 2019 & 2032
- Table 89: Mexico Laminated Busbar Industry Revenue (USD Billion) Forecast, by Application 2019 & 2032
- Table 90: Mexico Laminated Busbar Industry Volume (K Units) Forecast, by Application 2019 & 2032
- Table 91: Global Laminated Busbar Industry Revenue USD Billion Forecast, by Country 2019 & 2032
- Table 92: Global Laminated Busbar Industry Volume K Units Forecast, by Country 2019 & 2032
- Table 93: United Arab Emirates Laminated Busbar Industry Revenue (USD Billion) Forecast, by Application 2019 & 2032
- Table 94: United Arab Emirates Laminated Busbar Industry Volume (K Units) Forecast, by Application 2019 & 2032
- Table 95: Saudi Arabia Laminated Busbar Industry Revenue (USD Billion) Forecast, by Application 2019 & 2032
- Table 96: Saudi Arabia Laminated Busbar Industry Volume (K Units) Forecast, by Application 2019 & 2032
- Table 97: South Africa Laminated Busbar Industry Revenue (USD Billion) Forecast, by Application 2019 & 2032
- Table 98: South Africa Laminated Busbar Industry Volume (K Units) Forecast, by Application 2019 & 2032
- Table 99: Rest of Middle East and Africa Laminated Busbar Industry Revenue (USD Billion) Forecast, by Application 2019 & 2032
- Table 100: Rest of Middle East and Africa Laminated Busbar Industry Volume (K Units) Forecast, by Application 2019 & 2032
- Table 101: Global Laminated Busbar Industry Revenue USD Billion Forecast, by Material 2019 & 2032
- Table 102: Global Laminated Busbar Industry Volume K Units Forecast, by Material 2019 & 2032
- Table 103: Global Laminated Busbar Industry Revenue USD Billion Forecast, by Insulation Material 2019 & 2032
- Table 104: Global Laminated Busbar Industry Volume K Units Forecast, by Insulation Material 2019 & 2032
- Table 105: Global Laminated Busbar Industry Revenue USD Billion Forecast, by End-User 2019 & 2032
- Table 106: Global Laminated Busbar Industry Volume K Units Forecast, by End-User 2019 & 2032
- Table 107: Global Laminated Busbar Industry Revenue USD Billion Forecast, by Country 2019 & 2032
- Table 108: Global Laminated Busbar Industry Volume K Units Forecast, by Country 2019 & 2032
- Table 109: Global Laminated Busbar Industry Revenue USD Billion Forecast, by Material 2019 & 2032
- Table 110: Global Laminated Busbar Industry Volume K Units Forecast, by Material 2019 & 2032
- Table 111: Global Laminated Busbar Industry Revenue USD Billion Forecast, by Insulation Material 2019 & 2032
- Table 112: Global Laminated Busbar Industry Volume K Units Forecast, by Insulation Material 2019 & 2032
- Table 113: Global Laminated Busbar Industry Revenue USD Billion Forecast, by End-User 2019 & 2032
- Table 114: Global Laminated Busbar Industry Volume K Units Forecast, by End-User 2019 & 2032
- Table 115: Global Laminated Busbar Industry Revenue USD Billion Forecast, by Country 2019 & 2032
- Table 116: Global Laminated Busbar Industry Volume K Units Forecast, by Country 2019 & 2032
- Table 117: Global Laminated Busbar Industry Revenue USD Billion Forecast, by Material 2019 & 2032
- Table 118: Global Laminated Busbar Industry Volume K Units Forecast, by Material 2019 & 2032
- Table 119: Global Laminated Busbar Industry Revenue USD Billion Forecast, by Insulation Material 2019 & 2032
- Table 120: Global Laminated Busbar Industry Volume K Units Forecast, by Insulation Material 2019 & 2032
- Table 121: Global Laminated Busbar Industry Revenue USD Billion Forecast, by End-User 2019 & 2032
- Table 122: Global Laminated Busbar Industry Volume K Units Forecast, by End-User 2019 & 2032
- Table 123: Global Laminated Busbar Industry Revenue USD Billion Forecast, by Country 2019 & 2032
- Table 124: Global Laminated Busbar Industry Volume K Units Forecast, by Country 2019 & 2032
- Table 125: Global Laminated Busbar Industry Revenue USD Billion Forecast, by Material 2019 & 2032
- Table 126: Global Laminated Busbar Industry Volume K Units Forecast, by Material 2019 & 2032
- Table 127: Global Laminated Busbar Industry Revenue USD Billion Forecast, by Insulation Material 2019 & 2032
- Table 128: Global Laminated Busbar Industry Volume K Units Forecast, by Insulation Material 2019 & 2032
- Table 129: Global Laminated Busbar Industry Revenue USD Billion Forecast, by End-User 2019 & 2032
- Table 130: Global Laminated Busbar Industry Volume K Units Forecast, by End-User 2019 & 2032
- Table 131: Global Laminated Busbar Industry Revenue USD Billion Forecast, by Country 2019 & 2032
- Table 132: Global Laminated Busbar Industry Volume K Units Forecast, by Country 2019 & 2032
- Table 133: Global Laminated Busbar Industry Revenue USD Billion Forecast, by Material 2019 & 2032
- Table 134: Global Laminated Busbar Industry Volume K Units Forecast, by Material 2019 & 2032
- Table 135: Global Laminated Busbar Industry Revenue USD Billion Forecast, by Insulation Material 2019 & 2032
- Table 136: Global Laminated Busbar Industry Volume K Units Forecast, by Insulation Material 2019 & 2032
- Table 137: Global Laminated Busbar Industry Revenue USD Billion Forecast, by End-User 2019 & 2032
- Table 138: Global Laminated Busbar Industry Volume K Units Forecast, by End-User 2019 & 2032
- Table 139: Global Laminated Busbar Industry Revenue USD Billion Forecast, by Country 2019 & 2032
- Table 140: Global Laminated Busbar Industry Volume K Units Forecast, by Country 2019 & 2032
Frequently Asked Questions
1. What is the projected Compound Annual Growth Rate (CAGR) of the Laminated Busbar Industry?
The projected CAGR is approximately 6.02%.
2. Which companies are prominent players in the Laminated Busbar Industry?
Key companies in the market include Methode Electronics Inc, Suzhou West Deane Machinery Inc, Electronic Systems Packaging LLC, Molex LLC, Ryoden Kasei Co Ltd, Rogers Corporation, Shanghai Eagtop Electronic Technology Co Ltd, Eaton Corporation PLC, Amphenol Corporation, Segue Electronics Inc *List Not Exhaustive, Zhejiang RHI ELectric Co Ltd, Mersen SA, Zhuzhou CRRC Times Electric Co Ltd, Sun King Power Electronics Group Ltd, Raychem RPG Private Limited, EMS Industrial & Service Company, Storm Power Components.
3. What are the main segments of the Laminated Busbar Industry?
The market segments include Material, Insulation Material, End-User.
4. Can you provide details about the market size?
The market size is estimated to be USD 0.78 USD Billion as of 2022.
5. What are some drivers contributing to market growth?
4.; Growing Energy Demand4.; Renewable Energy Transition.
6. What are the notable trends driving market growth?
Power Utility Sub-sector to Dominate the Market.
7. Are there any restraints impacting market growth?
4.; Phasing out of Conventional Sources of Electricity.
8. Can you provide examples of recent developments in the market?
In February 2020, ABB Ltd planned to introduce laminated bus plate technology for low-voltage switchgear. The new technology is combined with the ABB Ability platform, and it offers the highest reliability, better efficiency, maximum safety, more flexibility, and measurable return on investment (ROI).
9. What pricing options are available for accessing the report?
Pricing options include single-user, multi-user, and enterprise licenses priced at USD 4750, USD 5250, and USD 8750 respectively.
10. Is the market size provided in terms of value or volume?
The market size is provided in terms of value, measured in USD Billion and volume, measured in K Units.
11. Are there any specific market keywords associated with the report?
Yes, the market keyword associated with the report is "Laminated Busbar Industry," which aids in identifying and referencing the specific market segment covered.
12. How do I determine which pricing option suits my needs best?
The pricing options vary based on user requirements and access needs. Individual users may opt for single-user licenses, while businesses requiring broader access may choose multi-user or enterprise licenses for cost-effective access to the report.
13. Are there any additional resources or data provided in the Laminated Busbar Industry report?
While the report offers comprehensive insights, it's advisable to review the specific contents or supplementary materials provided to ascertain if additional resources or data are available.
14. How can I stay updated on further developments or reports in the Laminated Busbar Industry?
To stay informed about further developments, trends, and reports in the Laminated Busbar Industry, consider subscribing to industry newsletters, following relevant companies and organizations, or regularly checking reputable industry news sources and publications.
Methodology
Step 1 - Identification of Relevant Samples Size from Population Database


Step 2 - Approaches for Defining Global Market Size (Value, Volume* & Price*)

Note*: In applicable scenarios
Step 3 - Data Sources
Primary Research
- Web Analytics
- Survey Reports
- Research Institute
- Latest Research Reports
- Opinion Leaders
Secondary Research
- Annual Reports
- White Paper
- Latest Press Release
- Industry Association
- Paid Database
- Investor Presentations

Step 4 - Data Triangulation
Involves using different sources of information in order to increase the validity of a study
These sources are likely to be stakeholders in a program - participants, other researchers, program staff, other community members, and so on.
Then we put all data in single framework & apply various statistical tools to find out the dynamic on the market.
During the analysis stage, feedback from the stakeholder groups would be compared to determine areas of agreement as well as areas of divergence


