
Key Insights
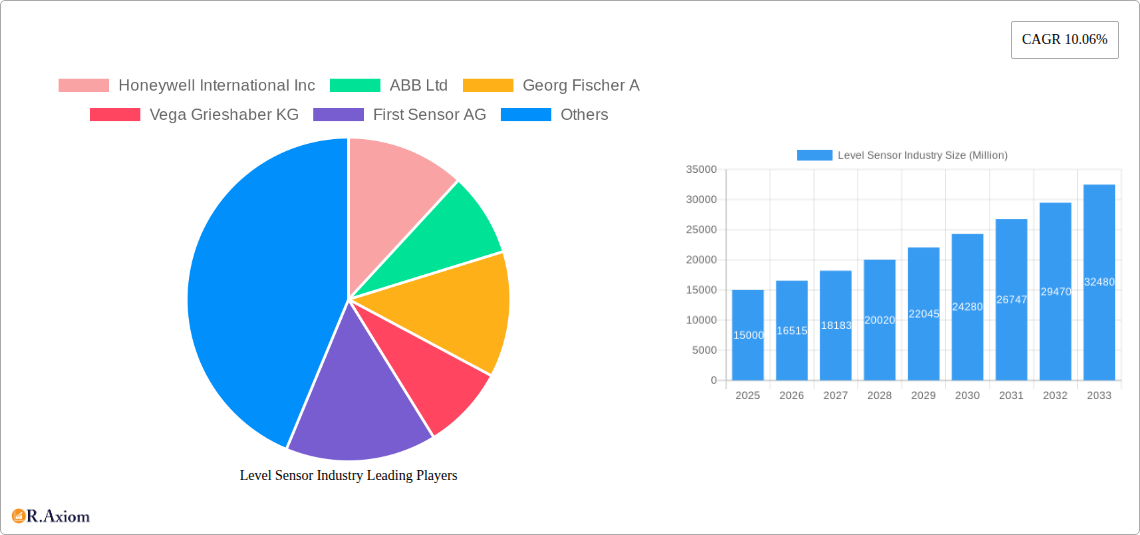
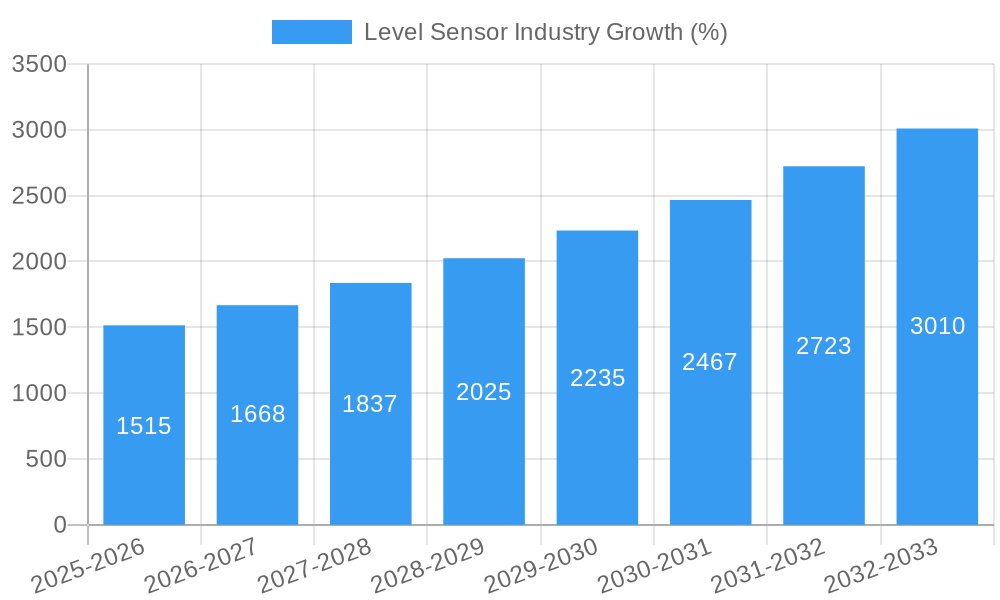
The global level sensor market is experiencing robust growth, projected to reach a substantial size driven by increasing automation across diverse industries. The 10.06% CAGR from 2019-2033 indicates a significant expansion, fueled primarily by the rising demand for precise level measurement in process control applications. Key drivers include the increasing adoption of advanced automation technologies in manufacturing, the burgeoning oil and gas sector's need for efficient resource management, and the growing emphasis on environmental monitoring and wastewater treatment. Continuous level sensors are expected to dominate the market due to their ability to provide real-time data, enhancing operational efficiency and reducing downtime. Significant end-user industry segments include power generation, oil and gas, and chemical processing, where precise level monitoring is critical for safety, efficiency, and regulatory compliance. However, high initial investment costs and the need for specialized technical expertise can pose challenges to market expansion. Despite these restraints, ongoing technological advancements leading to more compact, reliable, and cost-effective sensors are mitigating these factors, paving the way for continued market growth. The Asia-Pacific region is anticipated to witness substantial growth, driven by rapid industrialization and infrastructure development.
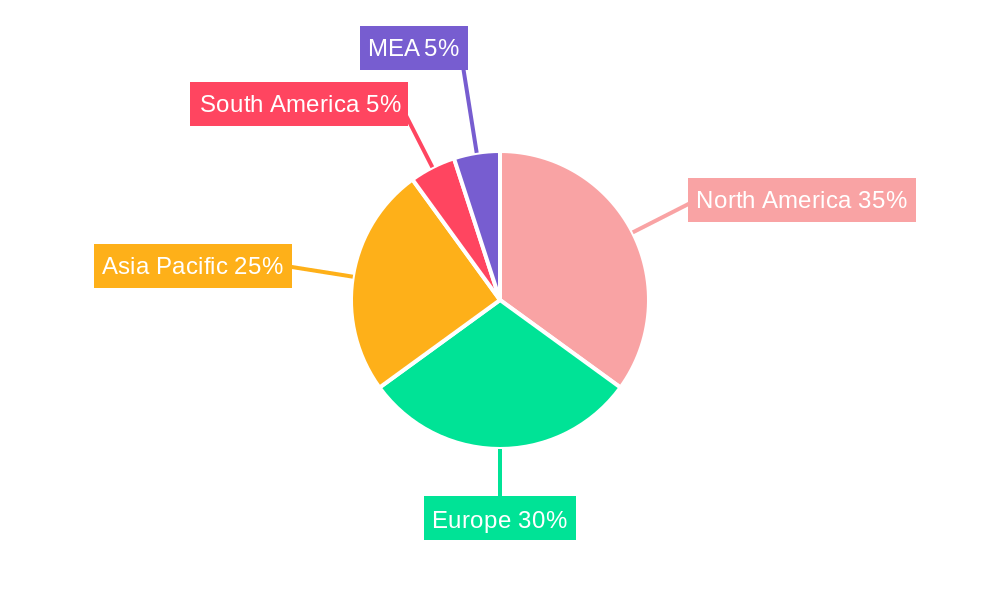
The competitive landscape is characterized by the presence of established players like Honeywell, ABB, and Emerson, alongside specialized sensor manufacturers. These companies are engaged in strategic initiatives such as mergers and acquisitions, product innovation, and geographical expansion to maintain a strong market position. The market is witnessing increased adoption of smart sensors integrated with IoT technologies, enabling remote monitoring and predictive maintenance. This trend, combined with the growing demand for higher accuracy and improved reliability, will shape the future trajectory of the level sensor market, driving further adoption across diverse sectors. The forecast period of 2025-2033 suggests continued expansion fueled by evolving technological capabilities and increased industry adoption. North America and Europe currently hold significant market share, yet developing economies in the Asia-Pacific region are poised to become key growth drivers in the coming years.
Level Sensor Industry: A Comprehensive Market Report (2019-2033)
This in-depth report provides a comprehensive analysis of the global Level Sensor industry, offering invaluable insights for stakeholders, investors, and industry professionals. Covering the period from 2019 to 2033, with a base year of 2025 and a forecast period of 2025-2033, this report meticulously examines market dynamics, growth drivers, challenges, and opportunities. The global market size is estimated at xx Million in 2025 and is projected to reach xx Million by 2033, exhibiting a CAGR of xx%. Key players analyzed include Honeywell International Inc, ABB Ltd, Georg Fischer AG, Vega Grieshaber KG, First Sensor AG, BinMaster Inc, Emerson Electric Co, Siemens AG, Sick AG, TE Connectivity Ltd, Endress + Hauser AG, and Baumer Group.
Level Sensor Industry Market Concentration & Innovation
The level sensor industry demonstrates a moderately concentrated market structure, with the top 10 players holding an estimated xx% market share in 2025. Honeywell International Inc., ABB Ltd., and Emerson Electric Co. are among the leading players, leveraging their established brand reputation and extensive product portfolios. However, smaller, specialized firms are also gaining traction through innovation and niche market focus.
Innovation Drivers:
- Advancements in sensor technologies (e.g., ultrasonic, radar, laser) driving enhanced accuracy and reliability.
- Growing demand for IoT-enabled sensors for remote monitoring and predictive maintenance.
- Development of intrinsically safe sensors for hazardous environments.
Regulatory Landscape:
Stringent safety and environmental regulations, particularly in sectors like oil and gas and chemical processing, are shaping product development and market demand.
Product Substitutes:
Alternative technologies, such as pressure-based level measurement, exist but often lack the accuracy and versatility of level sensors.
M&A Activities:
The industry has witnessed significant M&A activity in recent years, with deal values exceeding xx Million in the period 2019-2024. These activities reflect the consolidation trend within the industry and the pursuit of technological advancements.
End-User Trends:
Increasing automation across various industries, particularly in process control, is driving strong demand for level sensors.
Level Sensor Industry Industry Trends & Insights
The global level sensor market is experiencing robust growth, fueled by several key factors. The increasing demand for automation and process optimization across various end-user industries is a significant driver. Technological advancements, particularly in non-contact sensing technologies like radar and ultrasonic, are improving accuracy, reliability, and safety, leading to wider adoption. The growing adoption of Industry 4.0 principles and the Internet of Things (IoT) is also pushing demand for smart sensors, enabling real-time monitoring and predictive maintenance. Furthermore, the stringent environmental regulations across various industries are driving the adoption of more efficient and reliable level sensors. The market exhibits a competitive landscape with both established players and emerging companies competing on price, technology, and service offerings. The CAGR for the period 2025-2033 is projected to be xx%, indicating substantial growth potential. Market penetration is expected to increase significantly in emerging economies with growing industrialization.
Dominant Markets & Segments in Level Sensor Industry
The Oil and Gas segment holds a significant share of the level sensor market, driven by the need for precise level measurement in storage tanks, pipelines, and processing units. The Chemical industry also exhibits strong demand due to its need for accurate and reliable level measurement for various processes. Geographically, North America and Europe are currently leading markets, but Asia-Pacific is projected to show the highest growth rate due to rapid industrialization and investment in infrastructure development.
Key Drivers for Dominant Segments:
- Oil and Gas: Stringent safety regulations, need for precise inventory management, and automation initiatives.
- Chemical: Precise level control for process optimization and safety, and demand for high-accuracy sensors.
- North America & Europe: Established industrial base, advanced technological adoption, and stringent regulations.
- Asia-Pacific: Rapid industrialization, growing infrastructure investments, and increasing automation adoption.
Level Sensor Industry Product Developments
Recent years have seen significant advancements in level sensor technology, particularly with the introduction of non-contact sensors offering improved accuracy and reliability in challenging environments. Smart sensors with integrated communication capabilities are gaining traction, enabling remote monitoring and predictive maintenance. The focus is increasingly on miniaturization, enhanced durability, and the development of sensors suitable for specific applications, providing manufacturers with a competitive edge.
Report Scope & Segmentation Analysis
This report segments the level sensor market by monitoring type (Point Level Sensors, Continuous Level Sensors) and end-user industry (Power Generation, Oil and Gas, Mining and Metal Processing, Food and Beverage, Chemical, Water and Wastewater, Other End-user Industries). Each segment's growth projection, market size, and competitive dynamics are analyzed in detail. The report provides a comprehensive overview of the market landscape, including market share, competitive strategies, and future growth potential of each segment.
Key Drivers of Level Sensor Industry Growth
The level sensor industry's growth is driven by several key factors. Automation in process industries demands accurate and reliable level measurement. The increasing adoption of IoT and smart technologies enhances monitoring and predictive maintenance, increasing efficiency and reducing downtime. Furthermore, stringent environmental regulations necessitate precise level control in various industrial processes.
Challenges in the Level Sensor Industry Sector
The industry faces challenges including the high cost of advanced sensor technologies, potential supply chain disruptions, and intense competition from both established and emerging players. The need to comply with varying safety and regulatory standards across different regions also presents a challenge.
Emerging Opportunities in Level Sensor Industry
The market presents opportunities in developing smart sensors with advanced analytics capabilities. The expanding adoption of digitalization across industries is fueling demand for integrated solutions. Further growth potential lies in untapped markets within emerging economies and the development of sensors tailored for specific niche applications.
Leading Players in the Level Sensor Industry Market
- Honeywell International Inc
- ABB Ltd
- Georg Fischer AG
- Vega Grieshaber KG
- First Sensor AG
- BinMaster Inc
- Emerson Electric Co
- Siemens AG
- Sick AG
- TE Connectivity Ltd
- Endress + Hauser AG
- Baumer Group
Key Developments in Level Sensor Industry Industry
- January 2023: ABB Ltd. launched a new line of smart level sensors with integrated communication capabilities.
- June 2022: Honeywell International Inc. acquired a smaller level sensor manufacturer, expanding its product portfolio.
- October 2021: Siemens AG announced a partnership with a software company to develop advanced analytics for level sensor data. (Note: Further specific developments with dates would need to be added based on actual market events.)
Strategic Outlook for Level Sensor Industry Market
The level sensor market is poised for continued strong growth, driven by technological advancements, increasing automation, and the growing demand for smart and connected solutions. The focus on sustainability and environmental compliance will also drive innovation and demand for more efficient and reliable level measurement technologies. Companies that successfully integrate advanced technologies and cater to the specific needs of various end-user industries are expected to gain a significant competitive advantage.
Level Sensor Industry Segmentation
-
1. Monitoring Type
-
1.1. Point Level Sensors
- 1.1.1. Mechanical and Magnetic Float Level Sensors
- 1.1.2. Capacitance Level Sensors
- 1.1.3. Vibratory Probe Level Sensors
- 1.1.4. Conductivity Level Sensors
- 1.1.5. Other Point Level Sensors
-
1.2. Continuous Level Sensors
- 1.2.1. Laser Level Sensor
- 1.2.2. Ultrasonic Level Sensors
- 1.2.3. Magnetostrictive Level Sensors
- 1.2.4. Radar Level Sensors
- 1.2.5. Other Continuous Level Sensors
-
1.1. Point Level Sensors
-
2. End-user Industry
- 2.1. Power Generation
- 2.2. Oil and Gas
- 2.3. Mining and Metal Processing
- 2.4. Food and Beverage
- 2.5. Chemical
- 2.6. Water and Wastewater
- 2.7. Other En
Level Sensor Industry Segmentation By Geography
-
1. North America
- 1.1. United States
- 1.2. Canada
-
2. Europe
- 2.1. United Kingdom
- 2.2. Germany
- 2.3. France
- 2.4. Rest of Europe
-
3. Asia Pacific
- 3.1. China
- 3.2. India
- 3.3. Japan
- 3.4. Rest of Asia Pacific
- 4. Latin America
- 5. Middle East
Level Sensor Industry REPORT HIGHLIGHTS
| Aspects | Details |
|---|---|
| Study Period | 2019-2033 |
| Base Year | 2024 |
| Estimated Year | 2025 |
| Forecast Period | 2025-2033 |
| Historical Period | 2019-2024 |
| Growth Rate | CAGR of 10.06% from 2019-2033 |
| Segmentation |
|
Table of Contents
- 1. Introduction
- 1.1. Research Scope
- 1.2. Market Segmentation
- 1.3. Research Methodology
- 1.4. Definitions and Assumptions
- 2. Executive Summary
- 2.1. Introduction
- 3. Market Dynamics
- 3.1. Introduction
- 3.2. Market Drivers
- 3.2.1. ; Increasing Focus on Industrial Process Control; Growing Advancement of the IIoT and Industry 4.0
- 3.3. Market Restrains
- 3.3.1. Rising concerns related to data security
- 3.4. Market Trends
- 3.4.1. Oil and Gas Sector to be the Largest User of Level Sensors
- 4. Market Factor Analysis
- 4.1. Porters Five Forces
- 4.2. Supply/Value Chain
- 4.3. PESTEL analysis
- 4.4. Market Entropy
- 4.5. Patent/Trademark Analysis
- 5. Global Level Sensor Industry Analysis, Insights and Forecast, 2019-2031
- 5.1. Market Analysis, Insights and Forecast - by Monitoring Type
- 5.1.1. Point Level Sensors
- 5.1.1.1. Mechanical and Magnetic Float Level Sensors
- 5.1.1.2. Capacitance Level Sensors
- 5.1.1.3. Vibratory Probe Level Sensors
- 5.1.1.4. Conductivity Level Sensors
- 5.1.1.5. Other Point Level Sensors
- 5.1.2. Continuous Level Sensors
- 5.1.2.1. Laser Level Sensor
- 5.1.2.2. Ultrasonic Level Sensors
- 5.1.2.3. Magnetostrictive Level Sensors
- 5.1.2.4. Radar Level Sensors
- 5.1.2.5. Other Continuous Level Sensors
- 5.1.1. Point Level Sensors
- 5.2. Market Analysis, Insights and Forecast - by End-user Industry
- 5.2.1. Power Generation
- 5.2.2. Oil and Gas
- 5.2.3. Mining and Metal Processing
- 5.2.4. Food and Beverage
- 5.2.5. Chemical
- 5.2.6. Water and Wastewater
- 5.2.7. Other En
- 5.3. Market Analysis, Insights and Forecast - by Region
- 5.3.1. North America
- 5.3.2. Europe
- 5.3.3. Asia Pacific
- 5.3.4. Latin America
- 5.3.5. Middle East
- 5.1. Market Analysis, Insights and Forecast - by Monitoring Type
- 6. North America Level Sensor Industry Analysis, Insights and Forecast, 2019-2031
- 6.1. Market Analysis, Insights and Forecast - by Monitoring Type
- 6.1.1. Point Level Sensors
- 6.1.1.1. Mechanical and Magnetic Float Level Sensors
- 6.1.1.2. Capacitance Level Sensors
- 6.1.1.3. Vibratory Probe Level Sensors
- 6.1.1.4. Conductivity Level Sensors
- 6.1.1.5. Other Point Level Sensors
- 6.1.2. Continuous Level Sensors
- 6.1.2.1. Laser Level Sensor
- 6.1.2.2. Ultrasonic Level Sensors
- 6.1.2.3. Magnetostrictive Level Sensors
- 6.1.2.4. Radar Level Sensors
- 6.1.2.5. Other Continuous Level Sensors
- 6.1.1. Point Level Sensors
- 6.2. Market Analysis, Insights and Forecast - by End-user Industry
- 6.2.1. Power Generation
- 6.2.2. Oil and Gas
- 6.2.3. Mining and Metal Processing
- 6.2.4. Food and Beverage
- 6.2.5. Chemical
- 6.2.6. Water and Wastewater
- 6.2.7. Other En
- 6.1. Market Analysis, Insights and Forecast - by Monitoring Type
- 7. Europe Level Sensor Industry Analysis, Insights and Forecast, 2019-2031
- 7.1. Market Analysis, Insights and Forecast - by Monitoring Type
- 7.1.1. Point Level Sensors
- 7.1.1.1. Mechanical and Magnetic Float Level Sensors
- 7.1.1.2. Capacitance Level Sensors
- 7.1.1.3. Vibratory Probe Level Sensors
- 7.1.1.4. Conductivity Level Sensors
- 7.1.1.5. Other Point Level Sensors
- 7.1.2. Continuous Level Sensors
- 7.1.2.1. Laser Level Sensor
- 7.1.2.2. Ultrasonic Level Sensors
- 7.1.2.3. Magnetostrictive Level Sensors
- 7.1.2.4. Radar Level Sensors
- 7.1.2.5. Other Continuous Level Sensors
- 7.1.1. Point Level Sensors
- 7.2. Market Analysis, Insights and Forecast - by End-user Industry
- 7.2.1. Power Generation
- 7.2.2. Oil and Gas
- 7.2.3. Mining and Metal Processing
- 7.2.4. Food and Beverage
- 7.2.5. Chemical
- 7.2.6. Water and Wastewater
- 7.2.7. Other En
- 7.1. Market Analysis, Insights and Forecast - by Monitoring Type
- 8. Asia Pacific Level Sensor Industry Analysis, Insights and Forecast, 2019-2031
- 8.1. Market Analysis, Insights and Forecast - by Monitoring Type
- 8.1.1. Point Level Sensors
- 8.1.1.1. Mechanical and Magnetic Float Level Sensors
- 8.1.1.2. Capacitance Level Sensors
- 8.1.1.3. Vibratory Probe Level Sensors
- 8.1.1.4. Conductivity Level Sensors
- 8.1.1.5. Other Point Level Sensors
- 8.1.2. Continuous Level Sensors
- 8.1.2.1. Laser Level Sensor
- 8.1.2.2. Ultrasonic Level Sensors
- 8.1.2.3. Magnetostrictive Level Sensors
- 8.1.2.4. Radar Level Sensors
- 8.1.2.5. Other Continuous Level Sensors
- 8.1.1. Point Level Sensors
- 8.2. Market Analysis, Insights and Forecast - by End-user Industry
- 8.2.1. Power Generation
- 8.2.2. Oil and Gas
- 8.2.3. Mining and Metal Processing
- 8.2.4. Food and Beverage
- 8.2.5. Chemical
- 8.2.6. Water and Wastewater
- 8.2.7. Other En
- 8.1. Market Analysis, Insights and Forecast - by Monitoring Type
- 9. Latin America Level Sensor Industry Analysis, Insights and Forecast, 2019-2031
- 9.1. Market Analysis, Insights and Forecast - by Monitoring Type
- 9.1.1. Point Level Sensors
- 9.1.1.1. Mechanical and Magnetic Float Level Sensors
- 9.1.1.2. Capacitance Level Sensors
- 9.1.1.3. Vibratory Probe Level Sensors
- 9.1.1.4. Conductivity Level Sensors
- 9.1.1.5. Other Point Level Sensors
- 9.1.2. Continuous Level Sensors
- 9.1.2.1. Laser Level Sensor
- 9.1.2.2. Ultrasonic Level Sensors
- 9.1.2.3. Magnetostrictive Level Sensors
- 9.1.2.4. Radar Level Sensors
- 9.1.2.5. Other Continuous Level Sensors
- 9.1.1. Point Level Sensors
- 9.2. Market Analysis, Insights and Forecast - by End-user Industry
- 9.2.1. Power Generation
- 9.2.2. Oil and Gas
- 9.2.3. Mining and Metal Processing
- 9.2.4. Food and Beverage
- 9.2.5. Chemical
- 9.2.6. Water and Wastewater
- 9.2.7. Other En
- 9.1. Market Analysis, Insights and Forecast - by Monitoring Type
- 10. Middle East Level Sensor Industry Analysis, Insights and Forecast, 2019-2031
- 10.1. Market Analysis, Insights and Forecast - by Monitoring Type
- 10.1.1. Point Level Sensors
- 10.1.1.1. Mechanical and Magnetic Float Level Sensors
- 10.1.1.2. Capacitance Level Sensors
- 10.1.1.3. Vibratory Probe Level Sensors
- 10.1.1.4. Conductivity Level Sensors
- 10.1.1.5. Other Point Level Sensors
- 10.1.2. Continuous Level Sensors
- 10.1.2.1. Laser Level Sensor
- 10.1.2.2. Ultrasonic Level Sensors
- 10.1.2.3. Magnetostrictive Level Sensors
- 10.1.2.4. Radar Level Sensors
- 10.1.2.5. Other Continuous Level Sensors
- 10.1.1. Point Level Sensors
- 10.2. Market Analysis, Insights and Forecast - by End-user Industry
- 10.2.1. Power Generation
- 10.2.2. Oil and Gas
- 10.2.3. Mining and Metal Processing
- 10.2.4. Food and Beverage
- 10.2.5. Chemical
- 10.2.6. Water and Wastewater
- 10.2.7. Other En
- 10.1. Market Analysis, Insights and Forecast - by Monitoring Type
- 11. North America Level Sensor Industry Analysis, Insights and Forecast, 2019-2031
- 11.1. Market Analysis, Insights and Forecast - By Country/Sub-region
- 11.1.1. undefined
- 12. Europe Level Sensor Industry Analysis, Insights and Forecast, 2019-2031
- 12.1. Market Analysis, Insights and Forecast - By Country/Sub-region
- 12.1.1. undefined
- 13. Asia Pacific Level Sensor Industry Analysis, Insights and Forecast, 2019-2031
- 13.1. Market Analysis, Insights and Forecast - By Country/Sub-region
- 13.1.1. undefined
- 14. South America Level Sensor Industry Analysis, Insights and Forecast, 2019-2031
- 14.1. Market Analysis, Insights and Forecast - By Country/Sub-region
- 14.1.1. undefined
- 15. North America Level Sensor Industry Analysis, Insights and Forecast, 2019-2031
- 15.1. Market Analysis, Insights and Forecast - By Country/Sub-region
- 15.1.1. undefined
- 16. MEA Level Sensor Industry Analysis, Insights and Forecast, 2019-2031
- 16.1. Market Analysis, Insights and Forecast - By Country/Sub-region
- 16.1.1. undefined
- 17. Competitive Analysis
- 17.1. Global Market Share Analysis 2024
- 17.2. Company Profiles
- 17.2.1 Honeywell International Inc
- 17.2.1.1. Overview
- 17.2.1.2. Products
- 17.2.1.3. SWOT Analysis
- 17.2.1.4. Recent Developments
- 17.2.1.5. Financials (Based on Availability)
- 17.2.2 ABB Ltd
- 17.2.2.1. Overview
- 17.2.2.2. Products
- 17.2.2.3. SWOT Analysis
- 17.2.2.4. Recent Developments
- 17.2.2.5. Financials (Based on Availability)
- 17.2.3 Georg Fischer A
- 17.2.3.1. Overview
- 17.2.3.2. Products
- 17.2.3.3. SWOT Analysis
- 17.2.3.4. Recent Developments
- 17.2.3.5. Financials (Based on Availability)
- 17.2.4 Vega Grieshaber KG
- 17.2.4.1. Overview
- 17.2.4.2. Products
- 17.2.4.3. SWOT Analysis
- 17.2.4.4. Recent Developments
- 17.2.4.5. Financials (Based on Availability)
- 17.2.5 First Sensor AG
- 17.2.5.1. Overview
- 17.2.5.2. Products
- 17.2.5.3. SWOT Analysis
- 17.2.5.4. Recent Developments
- 17.2.5.5. Financials (Based on Availability)
- 17.2.6 BinMaster Inc
- 17.2.6.1. Overview
- 17.2.6.2. Products
- 17.2.6.3. SWOT Analysis
- 17.2.6.4. Recent Developments
- 17.2.6.5. Financials (Based on Availability)
- 17.2.7 Emerson Electric Co
- 17.2.7.1. Overview
- 17.2.7.2. Products
- 17.2.7.3. SWOT Analysis
- 17.2.7.4. Recent Developments
- 17.2.7.5. Financials (Based on Availability)
- 17.2.8 Siemens AG
- 17.2.8.1. Overview
- 17.2.8.2. Products
- 17.2.8.3. SWOT Analysis
- 17.2.8.4. Recent Developments
- 17.2.8.5. Financials (Based on Availability)
- 17.2.9 Sick AG
- 17.2.9.1. Overview
- 17.2.9.2. Products
- 17.2.9.3. SWOT Analysis
- 17.2.9.4. Recent Developments
- 17.2.9.5. Financials (Based on Availability)
- 17.2.10 TE Connectivity Ltd
- 17.2.10.1. Overview
- 17.2.10.2. Products
- 17.2.10.3. SWOT Analysis
- 17.2.10.4. Recent Developments
- 17.2.10.5. Financials (Based on Availability)
- 17.2.11 Endress + Hauser AG
- 17.2.11.1. Overview
- 17.2.11.2. Products
- 17.2.11.3. SWOT Analysis
- 17.2.11.4. Recent Developments
- 17.2.11.5. Financials (Based on Availability)
- 17.2.12 Baumer Group
- 17.2.12.1. Overview
- 17.2.12.2. Products
- 17.2.12.3. SWOT Analysis
- 17.2.12.4. Recent Developments
- 17.2.12.5. Financials (Based on Availability)
- 17.2.1 Honeywell International Inc
List of Figures
- Figure 1: Global Level Sensor Industry Revenue Breakdown (Million, %) by Region 2024 & 2032
- Figure 2: Global Level Sensor Industry Volume Breakdown (K Unit, %) by Region 2024 & 2032
- Figure 3: North America Level Sensor Industry Revenue (Million), by Country 2024 & 2032
- Figure 4: North America Level Sensor Industry Volume (K Unit), by Country 2024 & 2032
- Figure 5: North America Level Sensor Industry Revenue Share (%), by Country 2024 & 2032
- Figure 6: North America Level Sensor Industry Volume Share (%), by Country 2024 & 2032
- Figure 7: Europe Level Sensor Industry Revenue (Million), by Country 2024 & 2032
- Figure 8: Europe Level Sensor Industry Volume (K Unit), by Country 2024 & 2032
- Figure 9: Europe Level Sensor Industry Revenue Share (%), by Country 2024 & 2032
- Figure 10: Europe Level Sensor Industry Volume Share (%), by Country 2024 & 2032
- Figure 11: Asia Pacific Level Sensor Industry Revenue (Million), by Country 2024 & 2032
- Figure 12: Asia Pacific Level Sensor Industry Volume (K Unit), by Country 2024 & 2032
- Figure 13: Asia Pacific Level Sensor Industry Revenue Share (%), by Country 2024 & 2032
- Figure 14: Asia Pacific Level Sensor Industry Volume Share (%), by Country 2024 & 2032
- Figure 15: South America Level Sensor Industry Revenue (Million), by Country 2024 & 2032
- Figure 16: South America Level Sensor Industry Volume (K Unit), by Country 2024 & 2032
- Figure 17: South America Level Sensor Industry Revenue Share (%), by Country 2024 & 2032
- Figure 18: South America Level Sensor Industry Volume Share (%), by Country 2024 & 2032
- Figure 19: North America Level Sensor Industry Revenue (Million), by Country 2024 & 2032
- Figure 20: North America Level Sensor Industry Volume (K Unit), by Country 2024 & 2032
- Figure 21: North America Level Sensor Industry Revenue Share (%), by Country 2024 & 2032
- Figure 22: North America Level Sensor Industry Volume Share (%), by Country 2024 & 2032
- Figure 23: MEA Level Sensor Industry Revenue (Million), by Country 2024 & 2032
- Figure 24: MEA Level Sensor Industry Volume (K Unit), by Country 2024 & 2032
- Figure 25: MEA Level Sensor Industry Revenue Share (%), by Country 2024 & 2032
- Figure 26: MEA Level Sensor Industry Volume Share (%), by Country 2024 & 2032
- Figure 27: North America Level Sensor Industry Revenue (Million), by Monitoring Type 2024 & 2032
- Figure 28: North America Level Sensor Industry Volume (K Unit), by Monitoring Type 2024 & 2032
- Figure 29: North America Level Sensor Industry Revenue Share (%), by Monitoring Type 2024 & 2032
- Figure 30: North America Level Sensor Industry Volume Share (%), by Monitoring Type 2024 & 2032
- Figure 31: North America Level Sensor Industry Revenue (Million), by End-user Industry 2024 & 2032
- Figure 32: North America Level Sensor Industry Volume (K Unit), by End-user Industry 2024 & 2032
- Figure 33: North America Level Sensor Industry Revenue Share (%), by End-user Industry 2024 & 2032
- Figure 34: North America Level Sensor Industry Volume Share (%), by End-user Industry 2024 & 2032
- Figure 35: North America Level Sensor Industry Revenue (Million), by Country 2024 & 2032
- Figure 36: North America Level Sensor Industry Volume (K Unit), by Country 2024 & 2032
- Figure 37: North America Level Sensor Industry Revenue Share (%), by Country 2024 & 2032
- Figure 38: North America Level Sensor Industry Volume Share (%), by Country 2024 & 2032
- Figure 39: Europe Level Sensor Industry Revenue (Million), by Monitoring Type 2024 & 2032
- Figure 40: Europe Level Sensor Industry Volume (K Unit), by Monitoring Type 2024 & 2032
- Figure 41: Europe Level Sensor Industry Revenue Share (%), by Monitoring Type 2024 & 2032
- Figure 42: Europe Level Sensor Industry Volume Share (%), by Monitoring Type 2024 & 2032
- Figure 43: Europe Level Sensor Industry Revenue (Million), by End-user Industry 2024 & 2032
- Figure 44: Europe Level Sensor Industry Volume (K Unit), by End-user Industry 2024 & 2032
- Figure 45: Europe Level Sensor Industry Revenue Share (%), by End-user Industry 2024 & 2032
- Figure 46: Europe Level Sensor Industry Volume Share (%), by End-user Industry 2024 & 2032
- Figure 47: Europe Level Sensor Industry Revenue (Million), by Country 2024 & 2032
- Figure 48: Europe Level Sensor Industry Volume (K Unit), by Country 2024 & 2032
- Figure 49: Europe Level Sensor Industry Revenue Share (%), by Country 2024 & 2032
- Figure 50: Europe Level Sensor Industry Volume Share (%), by Country 2024 & 2032
- Figure 51: Asia Pacific Level Sensor Industry Revenue (Million), by Monitoring Type 2024 & 2032
- Figure 52: Asia Pacific Level Sensor Industry Volume (K Unit), by Monitoring Type 2024 & 2032
- Figure 53: Asia Pacific Level Sensor Industry Revenue Share (%), by Monitoring Type 2024 & 2032
- Figure 54: Asia Pacific Level Sensor Industry Volume Share (%), by Monitoring Type 2024 & 2032
- Figure 55: Asia Pacific Level Sensor Industry Revenue (Million), by End-user Industry 2024 & 2032
- Figure 56: Asia Pacific Level Sensor Industry Volume (K Unit), by End-user Industry 2024 & 2032
- Figure 57: Asia Pacific Level Sensor Industry Revenue Share (%), by End-user Industry 2024 & 2032
- Figure 58: Asia Pacific Level Sensor Industry Volume Share (%), by End-user Industry 2024 & 2032
- Figure 59: Asia Pacific Level Sensor Industry Revenue (Million), by Country 2024 & 2032
- Figure 60: Asia Pacific Level Sensor Industry Volume (K Unit), by Country 2024 & 2032
- Figure 61: Asia Pacific Level Sensor Industry Revenue Share (%), by Country 2024 & 2032
- Figure 62: Asia Pacific Level Sensor Industry Volume Share (%), by Country 2024 & 2032
- Figure 63: Latin America Level Sensor Industry Revenue (Million), by Monitoring Type 2024 & 2032
- Figure 64: Latin America Level Sensor Industry Volume (K Unit), by Monitoring Type 2024 & 2032
- Figure 65: Latin America Level Sensor Industry Revenue Share (%), by Monitoring Type 2024 & 2032
- Figure 66: Latin America Level Sensor Industry Volume Share (%), by Monitoring Type 2024 & 2032
- Figure 67: Latin America Level Sensor Industry Revenue (Million), by End-user Industry 2024 & 2032
- Figure 68: Latin America Level Sensor Industry Volume (K Unit), by End-user Industry 2024 & 2032
- Figure 69: Latin America Level Sensor Industry Revenue Share (%), by End-user Industry 2024 & 2032
- Figure 70: Latin America Level Sensor Industry Volume Share (%), by End-user Industry 2024 & 2032
- Figure 71: Latin America Level Sensor Industry Revenue (Million), by Country 2024 & 2032
- Figure 72: Latin America Level Sensor Industry Volume (K Unit), by Country 2024 & 2032
- Figure 73: Latin America Level Sensor Industry Revenue Share (%), by Country 2024 & 2032
- Figure 74: Latin America Level Sensor Industry Volume Share (%), by Country 2024 & 2032
- Figure 75: Middle East Level Sensor Industry Revenue (Million), by Monitoring Type 2024 & 2032
- Figure 76: Middle East Level Sensor Industry Volume (K Unit), by Monitoring Type 2024 & 2032
- Figure 77: Middle East Level Sensor Industry Revenue Share (%), by Monitoring Type 2024 & 2032
- Figure 78: Middle East Level Sensor Industry Volume Share (%), by Monitoring Type 2024 & 2032
- Figure 79: Middle East Level Sensor Industry Revenue (Million), by End-user Industry 2024 & 2032
- Figure 80: Middle East Level Sensor Industry Volume (K Unit), by End-user Industry 2024 & 2032
- Figure 81: Middle East Level Sensor Industry Revenue Share (%), by End-user Industry 2024 & 2032
- Figure 82: Middle East Level Sensor Industry Volume Share (%), by End-user Industry 2024 & 2032
- Figure 83: Middle East Level Sensor Industry Revenue (Million), by Country 2024 & 2032
- Figure 84: Middle East Level Sensor Industry Volume (K Unit), by Country 2024 & 2032
- Figure 85: Middle East Level Sensor Industry Revenue Share (%), by Country 2024 & 2032
- Figure 86: Middle East Level Sensor Industry Volume Share (%), by Country 2024 & 2032
List of Tables
- Table 1: Global Level Sensor Industry Revenue Million Forecast, by Region 2019 & 2032
- Table 2: Global Level Sensor Industry Volume K Unit Forecast, by Region 2019 & 2032
- Table 3: Global Level Sensor Industry Revenue Million Forecast, by Monitoring Type 2019 & 2032
- Table 4: Global Level Sensor Industry Volume K Unit Forecast, by Monitoring Type 2019 & 2032
- Table 5: Global Level Sensor Industry Revenue Million Forecast, by End-user Industry 2019 & 2032
- Table 6: Global Level Sensor Industry Volume K Unit Forecast, by End-user Industry 2019 & 2032
- Table 7: Global Level Sensor Industry Revenue Million Forecast, by Region 2019 & 2032
- Table 8: Global Level Sensor Industry Volume K Unit Forecast, by Region 2019 & 2032
- Table 9: Global Level Sensor Industry Revenue Million Forecast, by Country 2019 & 2032
- Table 10: Global Level Sensor Industry Volume K Unit Forecast, by Country 2019 & 2032
- Table 11: Global Level Sensor Industry Revenue Million Forecast, by Country 2019 & 2032
- Table 12: Global Level Sensor Industry Volume K Unit Forecast, by Country 2019 & 2032
- Table 13: Global Level Sensor Industry Revenue Million Forecast, by Country 2019 & 2032
- Table 14: Global Level Sensor Industry Volume K Unit Forecast, by Country 2019 & 2032
- Table 15: Global Level Sensor Industry Revenue Million Forecast, by Country 2019 & 2032
- Table 16: Global Level Sensor Industry Volume K Unit Forecast, by Country 2019 & 2032
- Table 17: Global Level Sensor Industry Revenue Million Forecast, by Country 2019 & 2032
- Table 18: Global Level Sensor Industry Volume K Unit Forecast, by Country 2019 & 2032
- Table 19: Global Level Sensor Industry Revenue Million Forecast, by Country 2019 & 2032
- Table 20: Global Level Sensor Industry Volume K Unit Forecast, by Country 2019 & 2032
- Table 21: Global Level Sensor Industry Revenue Million Forecast, by Monitoring Type 2019 & 2032
- Table 22: Global Level Sensor Industry Volume K Unit Forecast, by Monitoring Type 2019 & 2032
- Table 23: Global Level Sensor Industry Revenue Million Forecast, by End-user Industry 2019 & 2032
- Table 24: Global Level Sensor Industry Volume K Unit Forecast, by End-user Industry 2019 & 2032
- Table 25: Global Level Sensor Industry Revenue Million Forecast, by Country 2019 & 2032
- Table 26: Global Level Sensor Industry Volume K Unit Forecast, by Country 2019 & 2032
- Table 27: United States Level Sensor Industry Revenue (Million) Forecast, by Application 2019 & 2032
- Table 28: United States Level Sensor Industry Volume (K Unit) Forecast, by Application 2019 & 2032
- Table 29: Canada Level Sensor Industry Revenue (Million) Forecast, by Application 2019 & 2032
- Table 30: Canada Level Sensor Industry Volume (K Unit) Forecast, by Application 2019 & 2032
- Table 31: Global Level Sensor Industry Revenue Million Forecast, by Monitoring Type 2019 & 2032
- Table 32: Global Level Sensor Industry Volume K Unit Forecast, by Monitoring Type 2019 & 2032
- Table 33: Global Level Sensor Industry Revenue Million Forecast, by End-user Industry 2019 & 2032
- Table 34: Global Level Sensor Industry Volume K Unit Forecast, by End-user Industry 2019 & 2032
- Table 35: Global Level Sensor Industry Revenue Million Forecast, by Country 2019 & 2032
- Table 36: Global Level Sensor Industry Volume K Unit Forecast, by Country 2019 & 2032
- Table 37: United Kingdom Level Sensor Industry Revenue (Million) Forecast, by Application 2019 & 2032
- Table 38: United Kingdom Level Sensor Industry Volume (K Unit) Forecast, by Application 2019 & 2032
- Table 39: Germany Level Sensor Industry Revenue (Million) Forecast, by Application 2019 & 2032
- Table 40: Germany Level Sensor Industry Volume (K Unit) Forecast, by Application 2019 & 2032
- Table 41: France Level Sensor Industry Revenue (Million) Forecast, by Application 2019 & 2032
- Table 42: France Level Sensor Industry Volume (K Unit) Forecast, by Application 2019 & 2032
- Table 43: Rest of Europe Level Sensor Industry Revenue (Million) Forecast, by Application 2019 & 2032
- Table 44: Rest of Europe Level Sensor Industry Volume (K Unit) Forecast, by Application 2019 & 2032
- Table 45: Global Level Sensor Industry Revenue Million Forecast, by Monitoring Type 2019 & 2032
- Table 46: Global Level Sensor Industry Volume K Unit Forecast, by Monitoring Type 2019 & 2032
- Table 47: Global Level Sensor Industry Revenue Million Forecast, by End-user Industry 2019 & 2032
- Table 48: Global Level Sensor Industry Volume K Unit Forecast, by End-user Industry 2019 & 2032
- Table 49: Global Level Sensor Industry Revenue Million Forecast, by Country 2019 & 2032
- Table 50: Global Level Sensor Industry Volume K Unit Forecast, by Country 2019 & 2032
- Table 51: China Level Sensor Industry Revenue (Million) Forecast, by Application 2019 & 2032
- Table 52: China Level Sensor Industry Volume (K Unit) Forecast, by Application 2019 & 2032
- Table 53: India Level Sensor Industry Revenue (Million) Forecast, by Application 2019 & 2032
- Table 54: India Level Sensor Industry Volume (K Unit) Forecast, by Application 2019 & 2032
- Table 55: Japan Level Sensor Industry Revenue (Million) Forecast, by Application 2019 & 2032
- Table 56: Japan Level Sensor Industry Volume (K Unit) Forecast, by Application 2019 & 2032
- Table 57: Rest of Asia Pacific Level Sensor Industry Revenue (Million) Forecast, by Application 2019 & 2032
- Table 58: Rest of Asia Pacific Level Sensor Industry Volume (K Unit) Forecast, by Application 2019 & 2032
- Table 59: Global Level Sensor Industry Revenue Million Forecast, by Monitoring Type 2019 & 2032
- Table 60: Global Level Sensor Industry Volume K Unit Forecast, by Monitoring Type 2019 & 2032
- Table 61: Global Level Sensor Industry Revenue Million Forecast, by End-user Industry 2019 & 2032
- Table 62: Global Level Sensor Industry Volume K Unit Forecast, by End-user Industry 2019 & 2032
- Table 63: Global Level Sensor Industry Revenue Million Forecast, by Country 2019 & 2032
- Table 64: Global Level Sensor Industry Volume K Unit Forecast, by Country 2019 & 2032
- Table 65: Global Level Sensor Industry Revenue Million Forecast, by Monitoring Type 2019 & 2032
- Table 66: Global Level Sensor Industry Volume K Unit Forecast, by Monitoring Type 2019 & 2032
- Table 67: Global Level Sensor Industry Revenue Million Forecast, by End-user Industry 2019 & 2032
- Table 68: Global Level Sensor Industry Volume K Unit Forecast, by End-user Industry 2019 & 2032
- Table 69: Global Level Sensor Industry Revenue Million Forecast, by Country 2019 & 2032
- Table 70: Global Level Sensor Industry Volume K Unit Forecast, by Country 2019 & 2032
Frequently Asked Questions
1. What is the projected Compound Annual Growth Rate (CAGR) of the Level Sensor Industry?
The projected CAGR is approximately 10.06%.
2. Which companies are prominent players in the Level Sensor Industry?
Key companies in the market include Honeywell International Inc, ABB Ltd, Georg Fischer A, Vega Grieshaber KG, First Sensor AG, BinMaster Inc, Emerson Electric Co, Siemens AG, Sick AG, TE Connectivity Ltd, Endress + Hauser AG, Baumer Group.
3. What are the main segments of the Level Sensor Industry?
The market segments include Monitoring Type, End-user Industry.
4. Can you provide details about the market size?
The market size is estimated to be USD XX Million as of 2022.
5. What are some drivers contributing to market growth?
; Increasing Focus on Industrial Process Control; Growing Advancement of the IIoT and Industry 4.0.
6. What are the notable trends driving market growth?
Oil and Gas Sector to be the Largest User of Level Sensors.
7. Are there any restraints impacting market growth?
Rising concerns related to data security.
8. Can you provide examples of recent developments in the market?
N/A
9. What pricing options are available for accessing the report?
Pricing options include single-user, multi-user, and enterprise licenses priced at USD 4750, USD 5250, and USD 8750 respectively.
10. Is the market size provided in terms of value or volume?
The market size is provided in terms of value, measured in Million and volume, measured in K Unit.
11. Are there any specific market keywords associated with the report?
Yes, the market keyword associated with the report is "Level Sensor Industry," which aids in identifying and referencing the specific market segment covered.
12. How do I determine which pricing option suits my needs best?
The pricing options vary based on user requirements and access needs. Individual users may opt for single-user licenses, while businesses requiring broader access may choose multi-user or enterprise licenses for cost-effective access to the report.
13. Are there any additional resources or data provided in the Level Sensor Industry report?
While the report offers comprehensive insights, it's advisable to review the specific contents or supplementary materials provided to ascertain if additional resources or data are available.
14. How can I stay updated on further developments or reports in the Level Sensor Industry?
To stay informed about further developments, trends, and reports in the Level Sensor Industry, consider subscribing to industry newsletters, following relevant companies and organizations, or regularly checking reputable industry news sources and publications.
Methodology
Step 1 - Identification of Relevant Samples Size from Population Database


Step 2 - Approaches for Defining Global Market Size (Value, Volume* & Price*)

Note*: In applicable scenarios
Step 3 - Data Sources
Primary Research
- Web Analytics
- Survey Reports
- Research Institute
- Latest Research Reports
- Opinion Leaders
Secondary Research
- Annual Reports
- White Paper
- Latest Press Release
- Industry Association
- Paid Database
- Investor Presentations

Step 4 - Data Triangulation
Involves using different sources of information in order to increase the validity of a study
These sources are likely to be stakeholders in a program - participants, other researchers, program staff, other community members, and so on.
Then we put all data in single framework & apply various statistical tools to find out the dynamic on the market.
During the analysis stage, feedback from the stakeholder groups would be compared to determine areas of agreement as well as areas of divergence


