
Key Insights
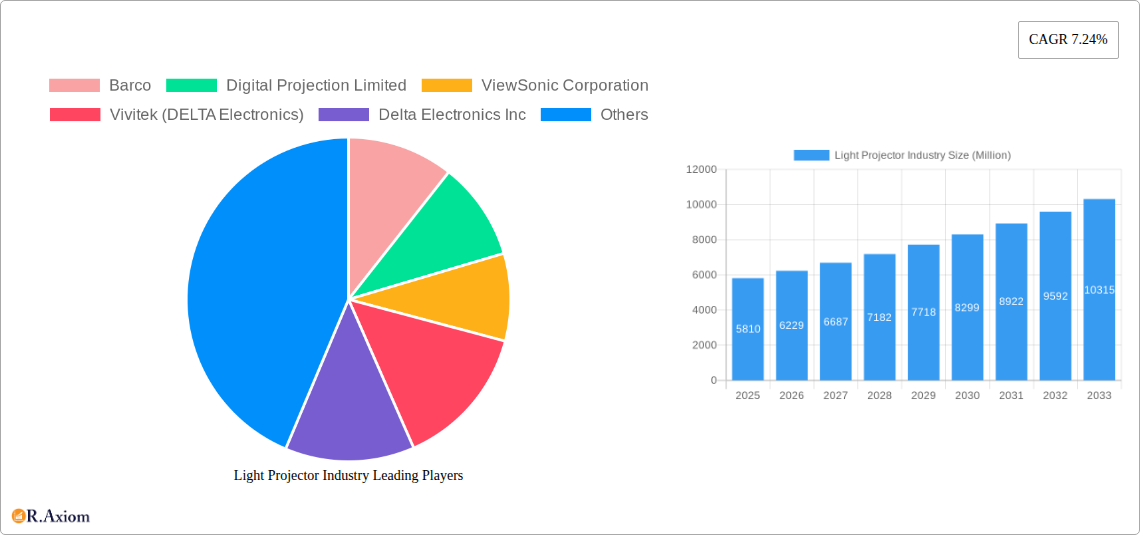
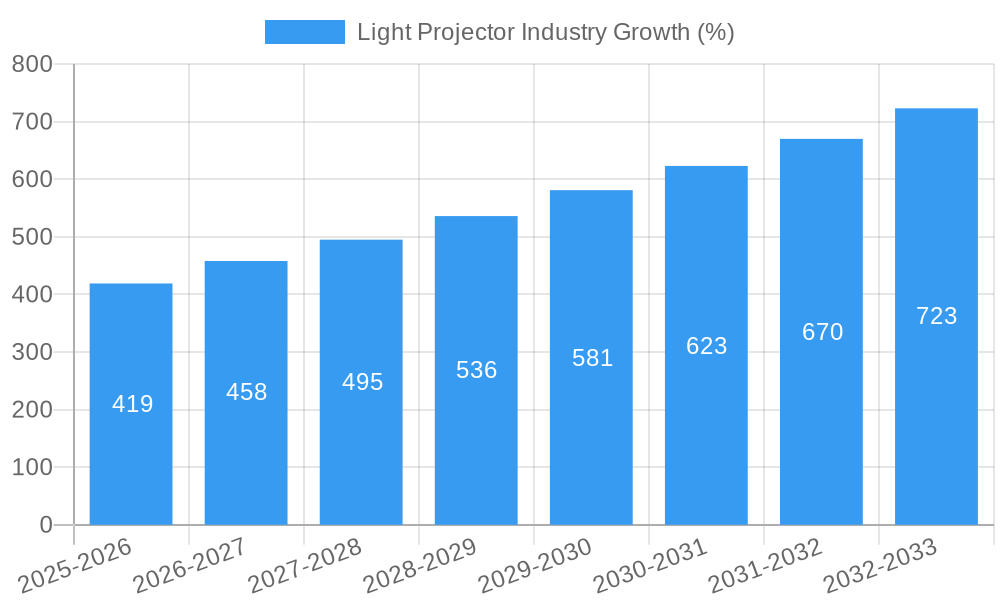
The global light projector market, valued at $5.81 billion in 2025, is projected to experience robust growth, driven by a Compound Annual Growth Rate (CAGR) of 7.24% from 2025 to 2033. This expansion is fueled by several key factors. The increasing adoption of projectors in home entertainment, particularly for immersive cinematic experiences, is a major contributor. The rise of smart home technology and integration with streaming services further enhances this trend. Furthermore, the projector market benefits from growing demand in the education and business sectors, where they are used for presentations, interactive lessons, and collaborative workspaces. Technological advancements, such as improved LED and laser light sources offering higher brightness, longer lifespan, and improved color accuracy, are also stimulating market growth. The development of ultra-short-throw projectors, which require minimal space, is another significant driver, especially in smaller homes and classrooms. While the market faces restraints such as high initial investment costs for some models and competition from alternative display technologies like large-screen TVs, the overall growth trajectory remains positive due to the compelling advantages projectors offer in terms of screen size flexibility and portability.
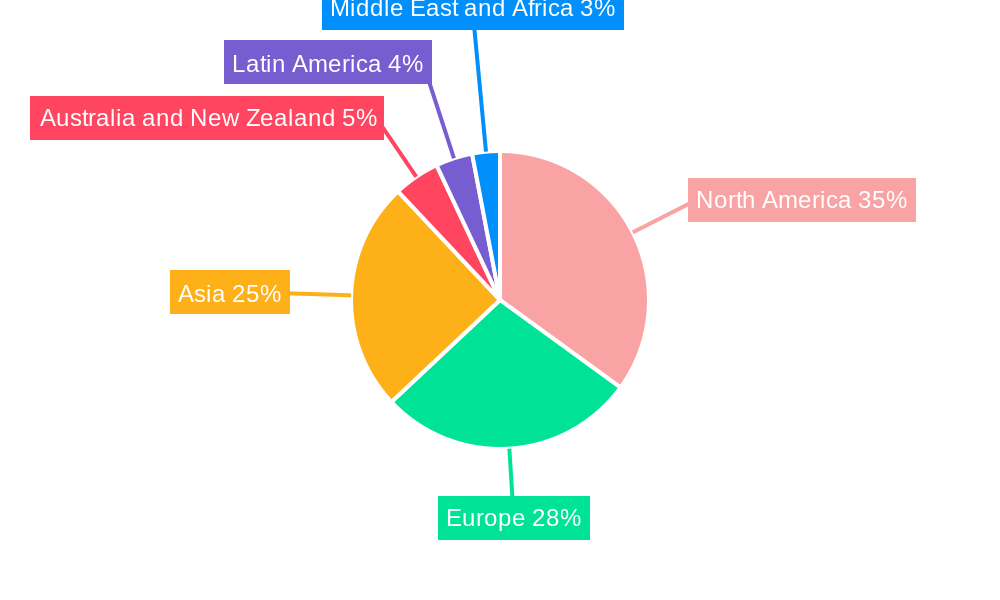
Segmentation reveals diverse market dynamics. LED projectors are expected to dominate due to their energy efficiency and cost-effectiveness, although laser projectors are gaining traction due to their superior brightness and color performance. The three-chip DLP technology segment holds significant market share, primarily in high-end applications demanding superior image quality. The home entertainment and cinema segment remains the largest application area, although the education and business sectors are experiencing rapid growth. Geographically, North America and Europe currently hold significant market shares, but the Asia-Pacific region is poised for accelerated growth due to rising disposable incomes and increasing technological adoption. Key players like Barco, Epson, BenQ, and Optoma are engaged in intense competition, driving innovation and pricing strategies to maintain market position. The market's future growth will hinge on continuous technological enhancements, affordability improvements, and successful penetration of emerging markets.
Light Projector Industry Market Report: 2019-2033
This comprehensive report provides a detailed analysis of the global light projector industry, covering market size, segmentation, key players, and future trends from 2019 to 2033. The study period (2019-2024) provides historical context, while the forecast period (2025-2033) offers valuable insights for strategic decision-making. The base year is 2025 and the estimated year is 2025. The report utilizes a robust methodology incorporating primary and secondary research, providing actionable insights for industry stakeholders. The total market value is projected to reach xx Million by 2033.
Light Projector Industry Market Concentration & Innovation
The light projector market exhibits a moderately concentrated landscape, with several key players holding significant market share. However, the presence of numerous smaller companies and ongoing technological innovations contribute to a dynamic competitive environment. Market share data for 2024 suggests that the top five players—Barco, Digital Projection Limited, ViewSonic Corporation, Epson, and BenQ Corporation—control approximately xx% of the global market. This concentration is partly due to economies of scale and established brand recognition. However, smaller companies are successfully competing by focusing on niche applications or offering innovative features at competitive prices.
Innovation is a major driver, with ongoing advancements in light source technology (LED, laser), chip models (one-chip, three-chip), throw distance (short-throw, ultra-short-throw), and resolution. Regulatory frameworks, particularly those concerning energy efficiency and environmental standards, play a significant role, influencing product development and material choices. The emergence of alternative display technologies, such as LED walls and interactive flat panels, presents a degree of substitution. End-user trends, including the increasing demand for larger screen sizes, higher resolutions, and interactive features in various applications, further shape market dynamics. Mergers and acquisitions (M&A) activity has been relatively moderate in recent years, with deal values averaging around xx Million annually, but strategic partnerships are becoming increasingly common. Examples of key M&A activities and partnerships are detailed in the "Key Developments" section.
Light Projector Industry Industry Trends & Insights
The light projector industry is experiencing a period of significant transformation driven by several factors. Market growth is projected at a CAGR of xx% from 2025 to 2033, fueled by rising demand across diverse sectors, including home entertainment, education, business, and large venues. Technological disruptions, such as the increasing adoption of laser light sources and improved resolution capabilities, are enhancing product performance and expanding application possibilities. Consumer preferences are shifting towards smaller, more portable projectors, smart features, and increased connectivity options. Furthermore, the growing integration of projectors with other smart home devices and the increasing demand for interactive displays are further shaping the industry landscape. The market penetration of laser-based projectors is expected to increase from xx% in 2025 to xx% by 2033, while the penetration of short-throw and ultra-short-throw projectors is also witnessing robust growth. Competitive dynamics remain fierce, with companies competing on price, features, and brand reputation. The market exhibits a strong focus on differentiation through proprietary technologies and innovative features.
Dominant Markets & Segments in Light Projector Industry
The North American region currently holds the dominant position in the global light projector market, followed by Europe and Asia-Pacific.
- By Light Source: The LED segment is experiencing the fastest growth, driven by its energy efficiency and longer lifespan compared to traditional lamp-based projectors. Laser technology is also gaining traction, particularly in high-brightness applications. The lamp-based segment is gradually declining.
- By Chip Model: Three-chip DLP projectors remain popular in high-end applications due to their superior color accuracy and brightness, while one-chip DLP projectors dominate the mainstream market due to their lower cost.
- By Throw Distance: Short-throw and ultra-short-throw projectors are gaining popularity in various applications, especially in classrooms and meeting rooms, due to their space-saving design. Normal-throw projectors continue to be prevalent in large venue installations.
- By Application: The business sector dominates the market, driven by demand for high-quality displays in corporate environments, education, and government agencies. Home entertainment and cinema are also significant segments, while large venue installations continue to offer strong growth opportunities.
Key drivers for market dominance include strong economic conditions, well-developed infrastructure supporting technology adoption, and a high level of disposable income in these regions. However, emerging economies in Asia-Pacific are showing strong growth potential, driven by increasing investment in infrastructure and education.
Light Projector Industry Product Developments
Recent product innovations focus on improving brightness, resolution, portability, and smart features. The integration of laser light sources, 4K resolution, and advanced connectivity options is shaping the market. Manufacturers are increasingly focusing on improving user experience through intuitive interfaces and mobile app integration. These developments cater to the growing demand for high-quality, versatile projectors across diverse applications, providing competitive advantages by offering enhanced performance and features.
Report Scope & Segmentation Analysis
This report segments the light projector market by light source (lamp, LED, laser), chip model (one-chip, three-chip), throw distance (normal throw, short throw, ultra-short throw), and application (home entertainment and cinema, business, education and government, large venues, other applications). Each segment is analyzed in detail, providing market size, growth projections, and competitive dynamics. The report also assesses the impact of technological advancements, regulatory changes, and economic factors on the growth trajectory of each segment.
Key Drivers of Light Projector Industry Growth
Several factors drive growth in the light projector industry. Technological advancements, including the development of laser light sources, higher resolutions, and improved energy efficiency, are crucial. Economic growth in developing countries is boosting demand, particularly in education and business sectors. Government initiatives promoting digitalization and smart classrooms also play a significant role. The growing popularity of home theaters and the demand for large-screen displays in entertainment further stimulates market expansion.
Challenges in the Light Projector Industry Sector
The light projector industry faces challenges such as intense competition, price pressure, and the emergence of alternative display technologies. Supply chain disruptions can significantly impact production and availability. Stringent environmental regulations related to energy consumption and waste disposal pose ongoing challenges for manufacturers. The increasing adoption of alternative display technologies like LED walls and interactive flat panels presents a threat to market share. These factors collectively exert pressure on profitability and growth potential.
Emerging Opportunities in Light Projector Industry
Emerging opportunities include the expanding adoption of short-throw and ultra-short-throw projectors, the growth of the interactive display market, and the increasing demand for high-brightness projectors in large-venue applications. The integration of projectors with smart home ecosystems and the development of innovative applications in areas such as virtual and augmented reality present further growth prospects. Expansion into new geographic markets, particularly in developing economies, offers significant potential.
Leading Players in the Light Projector Industry Market
- Barco
- Digital Projection Limited
- ViewSonic Corporation
- Vivitek (DELTA Electronics)
- Delta Electronics Inc
- Acer Inc
- Texas Instruments Inc
- BenQ Corporation
- Panasonic Corporation
- Optoma Corporation (Coretronic Corp)
- NEC Corporation
- Sharp Corporation
Key Developments in Light Projector Industry Industry
- February 2023: Digital Projection International received the TNT (Top New Technologies) award from CE Pro magazine for its HIGHlite 4K UHD Reference Satellite Modular Light Source (MLS) projection system. This highlights advancements in high-resolution projection technology.
- January 2023: Epson announced new projectors and visual solutions for professional displays, education, business, and life events, showcasing its commitment to innovation across various market segments, particularly in short-throw and ultra-short-throw laser displays.
Strategic Outlook for Light Projector Industry Market
The light projector market is poised for continued growth, driven by technological advancements, increasing demand across various applications, and expansion into new geographic markets. Focus areas for future success include innovation in light source technology, improved user experience through smart features, and the development of niche applications that cater to specific market needs. Strategic partnerships and acquisitions will play a key role in shaping the competitive landscape and driving market consolidation. The long-term growth potential is substantial, promising significant returns for companies that adapt to the evolving market dynamics.
Light Projector Industry Segmentation
-
1. Light Source
- 1.1. Lamp
- 1.2. LED
- 1.3. Laser
-
2. Chip Model
- 2.1. One Chip
- 2.2. Three Chip
-
3. Throw Distance
- 3.1. Normal Throw
- 3.2. Short Throw
- 3.3. Ultra-Short Throw
-
4. Application
- 4.1. Home Entertainment and Cinema
- 4.2. Business
- 4.3. Education and Government
- 4.4. Large Venues
- 4.5. Other Applications
Light Projector Industry Segmentation By Geography
- 1. North America
- 2. Europe
- 3. Asia
- 4. Australia and New Zealand
- 5. Latin America
- 6. Middle East and Africa
Light Projector Industry REPORT HIGHLIGHTS
| Aspects | Details |
|---|---|
| Study Period | 2019-2033 |
| Base Year | 2024 |
| Estimated Year | 2025 |
| Forecast Period | 2025-2033 |
| Historical Period | 2019-2024 |
| Growth Rate | CAGR of 7.24% from 2019-2033 |
| Segmentation |
|
Table of Contents
- 1. Introduction
- 1.1. Research Scope
- 1.2. Market Segmentation
- 1.3. Research Methodology
- 1.4. Definitions and Assumptions
- 2. Executive Summary
- 2.1. Introduction
- 3. Market Dynamics
- 3.1. Introduction
- 3.2. Market Drivers
- 3.2.1. Increment in the Demand of DLP Projector in the Entertainment Industry; Increasing Digitalization Process in the Education Sector
- 3.3. Market Restrains
- 3.3.1 High Cost and Lack of Knowledge; Stiff Competition from Other Projection Technologies such as LCD
- 3.3.2 LCOS
- 3.4. Market Trends
- 3.4.1. Increasing Demand of DLP Projector in the Home Entertainment and Cinema Industry to Drive the Market
- 4. Market Factor Analysis
- 4.1. Porters Five Forces
- 4.2. Supply/Value Chain
- 4.3. PESTEL analysis
- 4.4. Market Entropy
- 4.5. Patent/Trademark Analysis
- 5. Global Light Projector Industry Analysis, Insights and Forecast, 2019-2031
- 5.1. Market Analysis, Insights and Forecast - by Light Source
- 5.1.1. Lamp
- 5.1.2. LED
- 5.1.3. Laser
- 5.2. Market Analysis, Insights and Forecast - by Chip Model
- 5.2.1. One Chip
- 5.2.2. Three Chip
- 5.3. Market Analysis, Insights and Forecast - by Throw Distance
- 5.3.1. Normal Throw
- 5.3.2. Short Throw
- 5.3.3. Ultra-Short Throw
- 5.4. Market Analysis, Insights and Forecast - by Application
- 5.4.1. Home Entertainment and Cinema
- 5.4.2. Business
- 5.4.3. Education and Government
- 5.4.4. Large Venues
- 5.4.5. Other Applications
- 5.5. Market Analysis, Insights and Forecast - by Region
- 5.5.1. North America
- 5.5.2. Europe
- 5.5.3. Asia
- 5.5.4. Australia and New Zealand
- 5.5.5. Latin America
- 5.5.6. Middle East and Africa
- 5.1. Market Analysis, Insights and Forecast - by Light Source
- 6. North America Light Projector Industry Analysis, Insights and Forecast, 2019-2031
- 6.1. Market Analysis, Insights and Forecast - by Light Source
- 6.1.1. Lamp
- 6.1.2. LED
- 6.1.3. Laser
- 6.2. Market Analysis, Insights and Forecast - by Chip Model
- 6.2.1. One Chip
- 6.2.2. Three Chip
- 6.3. Market Analysis, Insights and Forecast - by Throw Distance
- 6.3.1. Normal Throw
- 6.3.2. Short Throw
- 6.3.3. Ultra-Short Throw
- 6.4. Market Analysis, Insights and Forecast - by Application
- 6.4.1. Home Entertainment and Cinema
- 6.4.2. Business
- 6.4.3. Education and Government
- 6.4.4. Large Venues
- 6.4.5. Other Applications
- 6.1. Market Analysis, Insights and Forecast - by Light Source
- 7. Europe Light Projector Industry Analysis, Insights and Forecast, 2019-2031
- 7.1. Market Analysis, Insights and Forecast - by Light Source
- 7.1.1. Lamp
- 7.1.2. LED
- 7.1.3. Laser
- 7.2. Market Analysis, Insights and Forecast - by Chip Model
- 7.2.1. One Chip
- 7.2.2. Three Chip
- 7.3. Market Analysis, Insights and Forecast - by Throw Distance
- 7.3.1. Normal Throw
- 7.3.2. Short Throw
- 7.3.3. Ultra-Short Throw
- 7.4. Market Analysis, Insights and Forecast - by Application
- 7.4.1. Home Entertainment and Cinema
- 7.4.2. Business
- 7.4.3. Education and Government
- 7.4.4. Large Venues
- 7.4.5. Other Applications
- 7.1. Market Analysis, Insights and Forecast - by Light Source
- 8. Asia Light Projector Industry Analysis, Insights and Forecast, 2019-2031
- 8.1. Market Analysis, Insights and Forecast - by Light Source
- 8.1.1. Lamp
- 8.1.2. LED
- 8.1.3. Laser
- 8.2. Market Analysis, Insights and Forecast - by Chip Model
- 8.2.1. One Chip
- 8.2.2. Three Chip
- 8.3. Market Analysis, Insights and Forecast - by Throw Distance
- 8.3.1. Normal Throw
- 8.3.2. Short Throw
- 8.3.3. Ultra-Short Throw
- 8.4. Market Analysis, Insights and Forecast - by Application
- 8.4.1. Home Entertainment and Cinema
- 8.4.2. Business
- 8.4.3. Education and Government
- 8.4.4. Large Venues
- 8.4.5. Other Applications
- 8.1. Market Analysis, Insights and Forecast - by Light Source
- 9. Australia and New Zealand Light Projector Industry Analysis, Insights and Forecast, 2019-2031
- 9.1. Market Analysis, Insights and Forecast - by Light Source
- 9.1.1. Lamp
- 9.1.2. LED
- 9.1.3. Laser
- 9.2. Market Analysis, Insights and Forecast - by Chip Model
- 9.2.1. One Chip
- 9.2.2. Three Chip
- 9.3. Market Analysis, Insights and Forecast - by Throw Distance
- 9.3.1. Normal Throw
- 9.3.2. Short Throw
- 9.3.3. Ultra-Short Throw
- 9.4. Market Analysis, Insights and Forecast - by Application
- 9.4.1. Home Entertainment and Cinema
- 9.4.2. Business
- 9.4.3. Education and Government
- 9.4.4. Large Venues
- 9.4.5. Other Applications
- 9.1. Market Analysis, Insights and Forecast - by Light Source
- 10. Latin America Light Projector Industry Analysis, Insights and Forecast, 2019-2031
- 10.1. Market Analysis, Insights and Forecast - by Light Source
- 10.1.1. Lamp
- 10.1.2. LED
- 10.1.3. Laser
- 10.2. Market Analysis, Insights and Forecast - by Chip Model
- 10.2.1. One Chip
- 10.2.2. Three Chip
- 10.3. Market Analysis, Insights and Forecast - by Throw Distance
- 10.3.1. Normal Throw
- 10.3.2. Short Throw
- 10.3.3. Ultra-Short Throw
- 10.4. Market Analysis, Insights and Forecast - by Application
- 10.4.1. Home Entertainment and Cinema
- 10.4.2. Business
- 10.4.3. Education and Government
- 10.4.4. Large Venues
- 10.4.5. Other Applications
- 10.1. Market Analysis, Insights and Forecast - by Light Source
- 11. Middle East and Africa Light Projector Industry Analysis, Insights and Forecast, 2019-2031
- 11.1. Market Analysis, Insights and Forecast - by Light Source
- 11.1.1. Lamp
- 11.1.2. LED
- 11.1.3. Laser
- 11.2. Market Analysis, Insights and Forecast - by Chip Model
- 11.2.1. One Chip
- 11.2.2. Three Chip
- 11.3. Market Analysis, Insights and Forecast - by Throw Distance
- 11.3.1. Normal Throw
- 11.3.2. Short Throw
- 11.3.3. Ultra-Short Throw
- 11.4. Market Analysis, Insights and Forecast - by Application
- 11.4.1. Home Entertainment and Cinema
- 11.4.2. Business
- 11.4.3. Education and Government
- 11.4.4. Large Venues
- 11.4.5. Other Applications
- 11.1. Market Analysis, Insights and Forecast - by Light Source
- 12. North America Light Projector Industry Analysis, Insights and Forecast, 2019-2031
- 12.1. Market Analysis, Insights and Forecast - By Country/Sub-region
- 12.1.1.
- 13. Europe Light Projector Industry Analysis, Insights and Forecast, 2019-2031
- 13.1. Market Analysis, Insights and Forecast - By Country/Sub-region
- 13.1.1.
- 14. Asia Light Projector Industry Analysis, Insights and Forecast, 2019-2031
- 14.1. Market Analysis, Insights and Forecast - By Country/Sub-region
- 14.1.1.
- 15. Australia and New Zealand Light Projector Industry Analysis, Insights and Forecast, 2019-2031
- 15.1. Market Analysis, Insights and Forecast - By Country/Sub-region
- 15.1.1.
- 16. Latin America Light Projector Industry Analysis, Insights and Forecast, 2019-2031
- 16.1. Market Analysis, Insights and Forecast - By Country/Sub-region
- 16.1.1.
- 17. Middle East and Africa Light Projector Industry Analysis, Insights and Forecast, 2019-2031
- 17.1. Market Analysis, Insights and Forecast - By Country/Sub-region
- 17.1.1.
- 18. Competitive Analysis
- 18.1. Global Market Share Analysis 2024
- 18.2. Company Profiles
- 18.2.1 Barco
- 18.2.1.1. Overview
- 18.2.1.2. Products
- 18.2.1.3. SWOT Analysis
- 18.2.1.4. Recent Developments
- 18.2.1.5. Financials (Based on Availability)
- 18.2.2 Digital Projection Limited
- 18.2.2.1. Overview
- 18.2.2.2. Products
- 18.2.2.3. SWOT Analysis
- 18.2.2.4. Recent Developments
- 18.2.2.5. Financials (Based on Availability)
- 18.2.3 ViewSonic Corporation
- 18.2.3.1. Overview
- 18.2.3.2. Products
- 18.2.3.3. SWOT Analysis
- 18.2.3.4. Recent Developments
- 18.2.3.5. Financials (Based on Availability)
- 18.2.4 Vivitek (DELTA Electronics)
- 18.2.4.1. Overview
- 18.2.4.2. Products
- 18.2.4.3. SWOT Analysis
- 18.2.4.4. Recent Developments
- 18.2.4.5. Financials (Based on Availability)
- 18.2.5 Delta Electronics Inc
- 18.2.5.1. Overview
- 18.2.5.2. Products
- 18.2.5.3. SWOT Analysis
- 18.2.5.4. Recent Developments
- 18.2.5.5. Financials (Based on Availability)
- 18.2.6 Acer Inc
- 18.2.6.1. Overview
- 18.2.6.2. Products
- 18.2.6.3. SWOT Analysis
- 18.2.6.4. Recent Developments
- 18.2.6.5. Financials (Based on Availability)
- 18.2.7 Texas Instruments Inc
- 18.2.7.1. Overview
- 18.2.7.2. Products
- 18.2.7.3. SWOT Analysis
- 18.2.7.4. Recent Developments
- 18.2.7.5. Financials (Based on Availability)
- 18.2.8 BenQ Corporation
- 18.2.8.1. Overview
- 18.2.8.2. Products
- 18.2.8.3. SWOT Analysis
- 18.2.8.4. Recent Developments
- 18.2.8.5. Financials (Based on Availability)
- 18.2.9 Panasonic Corporation*List Not Exhaustive
- 18.2.9.1. Overview
- 18.2.9.2. Products
- 18.2.9.3. SWOT Analysis
- 18.2.9.4. Recent Developments
- 18.2.9.5. Financials (Based on Availability)
- 18.2.10 Optoma Corporation (Coretronic Corp )
- 18.2.10.1. Overview
- 18.2.10.2. Products
- 18.2.10.3. SWOT Analysis
- 18.2.10.4. Recent Developments
- 18.2.10.5. Financials (Based on Availability)
- 18.2.11 NEC Corporation
- 18.2.11.1. Overview
- 18.2.11.2. Products
- 18.2.11.3. SWOT Analysis
- 18.2.11.4. Recent Developments
- 18.2.11.5. Financials (Based on Availability)
- 18.2.12 Sharp Corporation
- 18.2.12.1. Overview
- 18.2.12.2. Products
- 18.2.12.3. SWOT Analysis
- 18.2.12.4. Recent Developments
- 18.2.12.5. Financials (Based on Availability)
- 18.2.1 Barco
List of Figures
- Figure 1: Global Light Projector Industry Revenue Breakdown (Million, %) by Region 2024 & 2032
- Figure 2: North America Light Projector Industry Revenue (Million), by Country 2024 & 2032
- Figure 3: North America Light Projector Industry Revenue Share (%), by Country 2024 & 2032
- Figure 4: Europe Light Projector Industry Revenue (Million), by Country 2024 & 2032
- Figure 5: Europe Light Projector Industry Revenue Share (%), by Country 2024 & 2032
- Figure 6: Asia Light Projector Industry Revenue (Million), by Country 2024 & 2032
- Figure 7: Asia Light Projector Industry Revenue Share (%), by Country 2024 & 2032
- Figure 8: Australia and New Zealand Light Projector Industry Revenue (Million), by Country 2024 & 2032
- Figure 9: Australia and New Zealand Light Projector Industry Revenue Share (%), by Country 2024 & 2032
- Figure 10: Latin America Light Projector Industry Revenue (Million), by Country 2024 & 2032
- Figure 11: Latin America Light Projector Industry Revenue Share (%), by Country 2024 & 2032
- Figure 12: Middle East and Africa Light Projector Industry Revenue (Million), by Country 2024 & 2032
- Figure 13: Middle East and Africa Light Projector Industry Revenue Share (%), by Country 2024 & 2032
- Figure 14: North America Light Projector Industry Revenue (Million), by Light Source 2024 & 2032
- Figure 15: North America Light Projector Industry Revenue Share (%), by Light Source 2024 & 2032
- Figure 16: North America Light Projector Industry Revenue (Million), by Chip Model 2024 & 2032
- Figure 17: North America Light Projector Industry Revenue Share (%), by Chip Model 2024 & 2032
- Figure 18: North America Light Projector Industry Revenue (Million), by Throw Distance 2024 & 2032
- Figure 19: North America Light Projector Industry Revenue Share (%), by Throw Distance 2024 & 2032
- Figure 20: North America Light Projector Industry Revenue (Million), by Application 2024 & 2032
- Figure 21: North America Light Projector Industry Revenue Share (%), by Application 2024 & 2032
- Figure 22: North America Light Projector Industry Revenue (Million), by Country 2024 & 2032
- Figure 23: North America Light Projector Industry Revenue Share (%), by Country 2024 & 2032
- Figure 24: Europe Light Projector Industry Revenue (Million), by Light Source 2024 & 2032
- Figure 25: Europe Light Projector Industry Revenue Share (%), by Light Source 2024 & 2032
- Figure 26: Europe Light Projector Industry Revenue (Million), by Chip Model 2024 & 2032
- Figure 27: Europe Light Projector Industry Revenue Share (%), by Chip Model 2024 & 2032
- Figure 28: Europe Light Projector Industry Revenue (Million), by Throw Distance 2024 & 2032
- Figure 29: Europe Light Projector Industry Revenue Share (%), by Throw Distance 2024 & 2032
- Figure 30: Europe Light Projector Industry Revenue (Million), by Application 2024 & 2032
- Figure 31: Europe Light Projector Industry Revenue Share (%), by Application 2024 & 2032
- Figure 32: Europe Light Projector Industry Revenue (Million), by Country 2024 & 2032
- Figure 33: Europe Light Projector Industry Revenue Share (%), by Country 2024 & 2032
- Figure 34: Asia Light Projector Industry Revenue (Million), by Light Source 2024 & 2032
- Figure 35: Asia Light Projector Industry Revenue Share (%), by Light Source 2024 & 2032
- Figure 36: Asia Light Projector Industry Revenue (Million), by Chip Model 2024 & 2032
- Figure 37: Asia Light Projector Industry Revenue Share (%), by Chip Model 2024 & 2032
- Figure 38: Asia Light Projector Industry Revenue (Million), by Throw Distance 2024 & 2032
- Figure 39: Asia Light Projector Industry Revenue Share (%), by Throw Distance 2024 & 2032
- Figure 40: Asia Light Projector Industry Revenue (Million), by Application 2024 & 2032
- Figure 41: Asia Light Projector Industry Revenue Share (%), by Application 2024 & 2032
- Figure 42: Asia Light Projector Industry Revenue (Million), by Country 2024 & 2032
- Figure 43: Asia Light Projector Industry Revenue Share (%), by Country 2024 & 2032
- Figure 44: Australia and New Zealand Light Projector Industry Revenue (Million), by Light Source 2024 & 2032
- Figure 45: Australia and New Zealand Light Projector Industry Revenue Share (%), by Light Source 2024 & 2032
- Figure 46: Australia and New Zealand Light Projector Industry Revenue (Million), by Chip Model 2024 & 2032
- Figure 47: Australia and New Zealand Light Projector Industry Revenue Share (%), by Chip Model 2024 & 2032
- Figure 48: Australia and New Zealand Light Projector Industry Revenue (Million), by Throw Distance 2024 & 2032
- Figure 49: Australia and New Zealand Light Projector Industry Revenue Share (%), by Throw Distance 2024 & 2032
- Figure 50: Australia and New Zealand Light Projector Industry Revenue (Million), by Application 2024 & 2032
- Figure 51: Australia and New Zealand Light Projector Industry Revenue Share (%), by Application 2024 & 2032
- Figure 52: Australia and New Zealand Light Projector Industry Revenue (Million), by Country 2024 & 2032
- Figure 53: Australia and New Zealand Light Projector Industry Revenue Share (%), by Country 2024 & 2032
- Figure 54: Latin America Light Projector Industry Revenue (Million), by Light Source 2024 & 2032
- Figure 55: Latin America Light Projector Industry Revenue Share (%), by Light Source 2024 & 2032
- Figure 56: Latin America Light Projector Industry Revenue (Million), by Chip Model 2024 & 2032
- Figure 57: Latin America Light Projector Industry Revenue Share (%), by Chip Model 2024 & 2032
- Figure 58: Latin America Light Projector Industry Revenue (Million), by Throw Distance 2024 & 2032
- Figure 59: Latin America Light Projector Industry Revenue Share (%), by Throw Distance 2024 & 2032
- Figure 60: Latin America Light Projector Industry Revenue (Million), by Application 2024 & 2032
- Figure 61: Latin America Light Projector Industry Revenue Share (%), by Application 2024 & 2032
- Figure 62: Latin America Light Projector Industry Revenue (Million), by Country 2024 & 2032
- Figure 63: Latin America Light Projector Industry Revenue Share (%), by Country 2024 & 2032
- Figure 64: Middle East and Africa Light Projector Industry Revenue (Million), by Light Source 2024 & 2032
- Figure 65: Middle East and Africa Light Projector Industry Revenue Share (%), by Light Source 2024 & 2032
- Figure 66: Middle East and Africa Light Projector Industry Revenue (Million), by Chip Model 2024 & 2032
- Figure 67: Middle East and Africa Light Projector Industry Revenue Share (%), by Chip Model 2024 & 2032
- Figure 68: Middle East and Africa Light Projector Industry Revenue (Million), by Throw Distance 2024 & 2032
- Figure 69: Middle East and Africa Light Projector Industry Revenue Share (%), by Throw Distance 2024 & 2032
- Figure 70: Middle East and Africa Light Projector Industry Revenue (Million), by Application 2024 & 2032
- Figure 71: Middle East and Africa Light Projector Industry Revenue Share (%), by Application 2024 & 2032
- Figure 72: Middle East and Africa Light Projector Industry Revenue (Million), by Country 2024 & 2032
- Figure 73: Middle East and Africa Light Projector Industry Revenue Share (%), by Country 2024 & 2032
List of Tables
- Table 1: Global Light Projector Industry Revenue Million Forecast, by Region 2019 & 2032
- Table 2: Global Light Projector Industry Revenue Million Forecast, by Light Source 2019 & 2032
- Table 3: Global Light Projector Industry Revenue Million Forecast, by Chip Model 2019 & 2032
- Table 4: Global Light Projector Industry Revenue Million Forecast, by Throw Distance 2019 & 2032
- Table 5: Global Light Projector Industry Revenue Million Forecast, by Application 2019 & 2032
- Table 6: Global Light Projector Industry Revenue Million Forecast, by Region 2019 & 2032
- Table 7: Global Light Projector Industry Revenue Million Forecast, by Country 2019 & 2032
- Table 8: Light Projector Industry Revenue (Million) Forecast, by Application 2019 & 2032
- Table 9: Global Light Projector Industry Revenue Million Forecast, by Country 2019 & 2032
- Table 10: Light Projector Industry Revenue (Million) Forecast, by Application 2019 & 2032
- Table 11: Global Light Projector Industry Revenue Million Forecast, by Country 2019 & 2032
- Table 12: Light Projector Industry Revenue (Million) Forecast, by Application 2019 & 2032
- Table 13: Global Light Projector Industry Revenue Million Forecast, by Country 2019 & 2032
- Table 14: Light Projector Industry Revenue (Million) Forecast, by Application 2019 & 2032
- Table 15: Global Light Projector Industry Revenue Million Forecast, by Country 2019 & 2032
- Table 16: Light Projector Industry Revenue (Million) Forecast, by Application 2019 & 2032
- Table 17: Global Light Projector Industry Revenue Million Forecast, by Country 2019 & 2032
- Table 18: Light Projector Industry Revenue (Million) Forecast, by Application 2019 & 2032
- Table 19: Global Light Projector Industry Revenue Million Forecast, by Light Source 2019 & 2032
- Table 20: Global Light Projector Industry Revenue Million Forecast, by Chip Model 2019 & 2032
- Table 21: Global Light Projector Industry Revenue Million Forecast, by Throw Distance 2019 & 2032
- Table 22: Global Light Projector Industry Revenue Million Forecast, by Application 2019 & 2032
- Table 23: Global Light Projector Industry Revenue Million Forecast, by Country 2019 & 2032
- Table 24: Global Light Projector Industry Revenue Million Forecast, by Light Source 2019 & 2032
- Table 25: Global Light Projector Industry Revenue Million Forecast, by Chip Model 2019 & 2032
- Table 26: Global Light Projector Industry Revenue Million Forecast, by Throw Distance 2019 & 2032
- Table 27: Global Light Projector Industry Revenue Million Forecast, by Application 2019 & 2032
- Table 28: Global Light Projector Industry Revenue Million Forecast, by Country 2019 & 2032
- Table 29: Global Light Projector Industry Revenue Million Forecast, by Light Source 2019 & 2032
- Table 30: Global Light Projector Industry Revenue Million Forecast, by Chip Model 2019 & 2032
- Table 31: Global Light Projector Industry Revenue Million Forecast, by Throw Distance 2019 & 2032
- Table 32: Global Light Projector Industry Revenue Million Forecast, by Application 2019 & 2032
- Table 33: Global Light Projector Industry Revenue Million Forecast, by Country 2019 & 2032
- Table 34: Global Light Projector Industry Revenue Million Forecast, by Light Source 2019 & 2032
- Table 35: Global Light Projector Industry Revenue Million Forecast, by Chip Model 2019 & 2032
- Table 36: Global Light Projector Industry Revenue Million Forecast, by Throw Distance 2019 & 2032
- Table 37: Global Light Projector Industry Revenue Million Forecast, by Application 2019 & 2032
- Table 38: Global Light Projector Industry Revenue Million Forecast, by Country 2019 & 2032
- Table 39: Global Light Projector Industry Revenue Million Forecast, by Light Source 2019 & 2032
- Table 40: Global Light Projector Industry Revenue Million Forecast, by Chip Model 2019 & 2032
- Table 41: Global Light Projector Industry Revenue Million Forecast, by Throw Distance 2019 & 2032
- Table 42: Global Light Projector Industry Revenue Million Forecast, by Application 2019 & 2032
- Table 43: Global Light Projector Industry Revenue Million Forecast, by Country 2019 & 2032
- Table 44: Global Light Projector Industry Revenue Million Forecast, by Light Source 2019 & 2032
- Table 45: Global Light Projector Industry Revenue Million Forecast, by Chip Model 2019 & 2032
- Table 46: Global Light Projector Industry Revenue Million Forecast, by Throw Distance 2019 & 2032
- Table 47: Global Light Projector Industry Revenue Million Forecast, by Application 2019 & 2032
- Table 48: Global Light Projector Industry Revenue Million Forecast, by Country 2019 & 2032
Frequently Asked Questions
1. What is the projected Compound Annual Growth Rate (CAGR) of the Light Projector Industry?
The projected CAGR is approximately 7.24%.
2. Which companies are prominent players in the Light Projector Industry?
Key companies in the market include Barco, Digital Projection Limited, ViewSonic Corporation, Vivitek (DELTA Electronics), Delta Electronics Inc, Acer Inc, Texas Instruments Inc, BenQ Corporation, Panasonic Corporation*List Not Exhaustive, Optoma Corporation (Coretronic Corp ), NEC Corporation, Sharp Corporation.
3. What are the main segments of the Light Projector Industry?
The market segments include Light Source, Chip Model, Throw Distance, Application.
4. Can you provide details about the market size?
The market size is estimated to be USD 5.81 Million as of 2022.
5. What are some drivers contributing to market growth?
Increment in the Demand of DLP Projector in the Entertainment Industry; Increasing Digitalization Process in the Education Sector.
6. What are the notable trends driving market growth?
Increasing Demand of DLP Projector in the Home Entertainment and Cinema Industry to Drive the Market.
7. Are there any restraints impacting market growth?
High Cost and Lack of Knowledge; Stiff Competition from Other Projection Technologies such as LCD. LCOS.
8. Can you provide examples of recent developments in the market?
February 2023 - Digital Projection International received the coveted TNT (Top New Technologies) award from CE Pro magazine for its HIGHlite 4K UHD Reference Satellite Modular Light Source (MLS) projection system.
9. What pricing options are available for accessing the report?
Pricing options include single-user, multi-user, and enterprise licenses priced at USD 4750, USD 5250, and USD 8750 respectively.
10. Is the market size provided in terms of value or volume?
The market size is provided in terms of value, measured in Million.
11. Are there any specific market keywords associated with the report?
Yes, the market keyword associated with the report is "Light Projector Industry," which aids in identifying and referencing the specific market segment covered.
12. How do I determine which pricing option suits my needs best?
The pricing options vary based on user requirements and access needs. Individual users may opt for single-user licenses, while businesses requiring broader access may choose multi-user or enterprise licenses for cost-effective access to the report.
13. Are there any additional resources or data provided in the Light Projector Industry report?
While the report offers comprehensive insights, it's advisable to review the specific contents or supplementary materials provided to ascertain if additional resources or data are available.
14. How can I stay updated on further developments or reports in the Light Projector Industry?
To stay informed about further developments, trends, and reports in the Light Projector Industry, consider subscribing to industry newsletters, following relevant companies and organizations, or regularly checking reputable industry news sources and publications.
Methodology
Step 1 - Identification of Relevant Samples Size from Population Database


Step 2 - Approaches for Defining Global Market Size (Value, Volume* & Price*)

Note*: In applicable scenarios
Step 3 - Data Sources
Primary Research
- Web Analytics
- Survey Reports
- Research Institute
- Latest Research Reports
- Opinion Leaders
Secondary Research
- Annual Reports
- White Paper
- Latest Press Release
- Industry Association
- Paid Database
- Investor Presentations

Step 4 - Data Triangulation
Involves using different sources of information in order to increase the validity of a study
These sources are likely to be stakeholders in a program - participants, other researchers, program staff, other community members, and so on.
Then we put all data in single framework & apply various statistical tools to find out the dynamic on the market.
During the analysis stage, feedback from the stakeholder groups would be compared to determine areas of agreement as well as areas of divergence


