
Key Insights
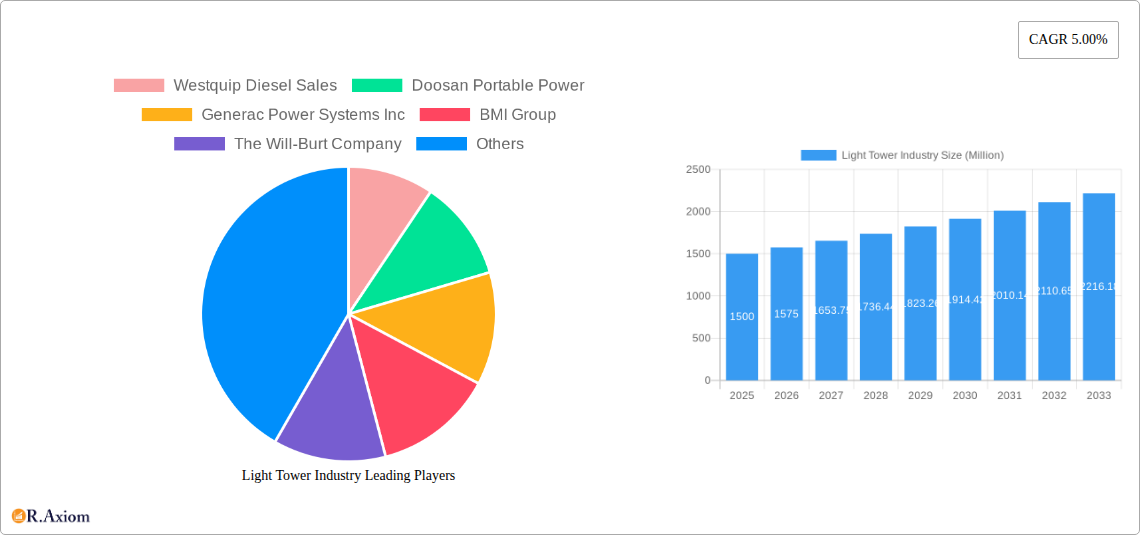
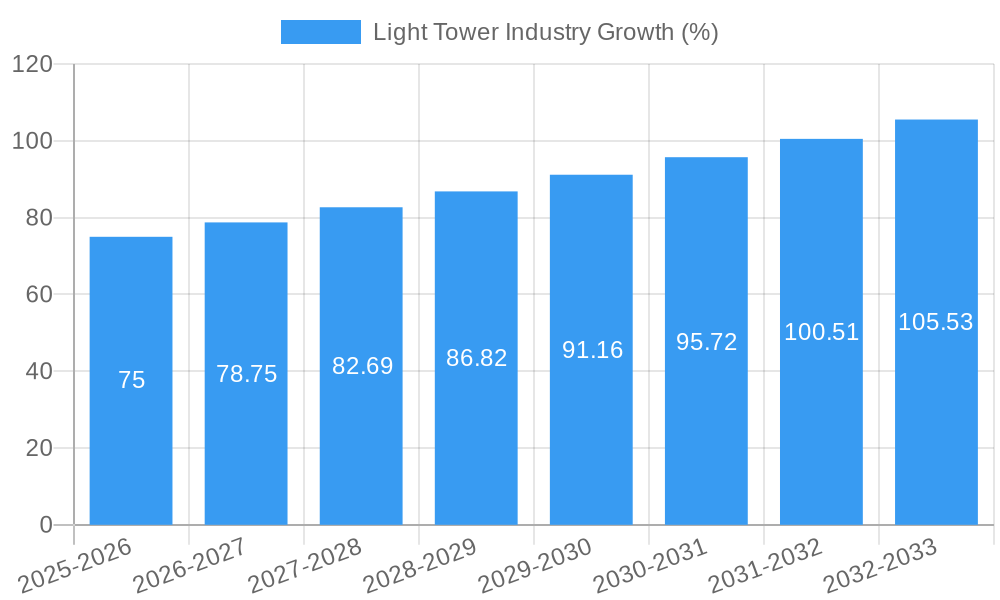
The global light tower market is experiencing steady growth, projected to maintain a 5% Compound Annual Growth Rate (CAGR) from 2025 to 2033. This expansion is fueled by several key drivers. The burgeoning construction industry, particularly in developing economies experiencing rapid urbanization, is a major contributor to demand. Simultaneously, increasing activity in the oil & gas and mining sectors, requiring robust and reliable lighting solutions for both safety and operational efficiency, significantly boosts market size. Furthermore, the ongoing shift towards environmentally friendly energy sources is driving adoption of solar-powered light towers, representing a significant segment within the overall market. Technological advancements, such as improved LED technology offering increased energy efficiency and longer lifespans, further contribute to market growth. However, the market faces challenges, including fluctuating fuel prices (particularly impacting diesel-powered models) and stringent environmental regulations impacting the manufacturing and disposal of light towers. This necessitates manufacturers to focus on sustainable and eco-friendly designs.
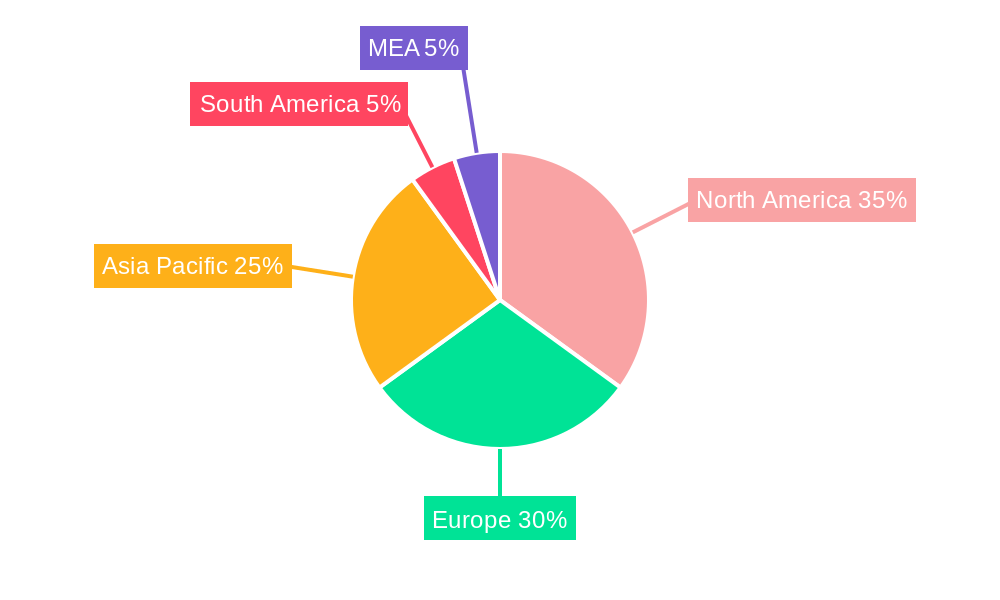
Market segmentation reveals a diverse landscape. LED light towers are gaining prominence due to their energy efficiency and cost-effectiveness over traditional metal halide options. Power source preferences are varied, with diesel-powered models maintaining a significant share due to their established reliability, while solar-powered and hydrogen fuel-powered options are attracting increasing interest driven by environmental concerns and sustainability goals. The construction sector remains the largest end-user industry, followed by oil & gas and mining. Geographically, North America and Europe currently hold substantial market shares, but the Asia-Pacific region is expected to witness significant growth driven by infrastructure development and industrial expansion. The competitive landscape comprises both established industry giants and regional players, each vying for market share through technological innovation, strategic partnerships, and regional expansion initiatives. The market's future trajectory will depend significantly on global economic conditions, infrastructural investments, and the pace of adoption of sustainable energy solutions.
This comprehensive report provides an in-depth analysis of the Light Tower Industry, encompassing market size, segmentation, growth drivers, challenges, and opportunities from 2019 to 2033. The study covers key players like Generac Power Systems, Atlas Copco, and others, offering valuable insights for industry stakeholders, investors, and strategic decision-makers. The report leverages extensive primary and secondary research, delivering actionable intelligence for navigating the evolving landscape of the light tower market. The base year for this analysis is 2025, with a forecast period extending to 2033. The historical period reviewed is 2019-2024. The total market value is predicted to reach XX Million by 2033.
Light Tower Industry Market Concentration & Innovation
The light tower industry exhibits a moderately concentrated market structure, with a few major players commanding significant market share. While precise market share figures for individual companies are proprietary, estimates suggest that the top five players collectively hold approximately 40% of the global market. This concentration is influenced by factors such as economies of scale in manufacturing, established distribution networks, and brand recognition. Innovation within the industry is driven by the increasing demand for energy-efficient and technologically advanced light towers. Key advancements include the adoption of LED technology, improved power source options (solar, diesel, hydrogen), and enhanced mobility features. Regulatory frameworks related to emissions and safety standards significantly influence product design and manufacturing processes. The industry also faces pressure from substitute technologies, such as advanced lighting systems, which are becoming increasingly cost-competitive. Mergers and acquisitions (M&A) activity is relatively moderate, with occasional deals focused on expanding geographical reach or incorporating new technologies. The average M&A deal value over the past five years has been approximately XX Million. End-user trends toward sustainability and reduced operational costs continue to shape product development and market dynamics.
- Key Innovation Drivers: LED technology, alternative power sources, improved mobility, enhanced safety features.
- Regulatory Influences: Emission standards, safety regulations.
- Competitive Dynamics: Moderate M&A activity, growing competition from substitute technologies.
- End-User Trends: Emphasis on sustainability, cost-effectiveness, and operational efficiency.
Light Tower Industry Industry Trends & Insights
The light tower industry is experiencing significant growth, fueled by robust demand across various end-user industries, particularly construction and oil & gas. The global market is projected to register a CAGR of XX% during the forecast period (2025-2033), reaching an estimated value of XX Million by 2033. This growth is driven by several factors, including rising infrastructure spending globally, expanding mining operations, and increasing energy exploration and production activities. Technological disruptions, such as the transition to LED lighting and the exploration of alternative power sources (solar, hydrogen), are reshaping the competitive landscape. Consumer preferences are shifting toward energy-efficient, sustainable, and technologically advanced solutions, which places pressure on manufacturers to innovate. The market penetration of LED light towers is steadily increasing, while the adoption of solar and hydrogen-powered units is expected to gain momentum in the coming years. The competitive landscape is characterized by both established players and emerging companies vying for market share through product differentiation and strategic partnerships. Market penetration of LED light towers is estimated at XX% in 2025, expected to reach XX% by 2033.
Dominant Markets & Segments in Light Tower Industry
The construction sector represents the largest end-user segment for light towers globally, accounting for approximately XX% of total market value in 2025. The Asia-Pacific region is expected to experience the highest growth rate during the forecast period, driven by significant infrastructure development and industrialization. North America is another important market for light towers, with substantial demand in the construction and oil & gas industries. Within the product segmentation, LED light towers are the fastest-growing type, surpassing metal halide light towers in market share by 2025 due to their energy efficiency and longer lifespan. Diesel-powered light towers currently dominate the market by type of power source, but solar-powered and hydrogen fuel-powered units are gaining traction due to environmental concerns and advancements in technology.
- Key Drivers for Construction Segment Dominance: High infrastructure spending, rapid urbanization, and large-scale construction projects.
- Key Drivers for Asia-Pacific Regional Growth: Rapid economic development, expanding infrastructure investments, and rising industrialization.
- Key Drivers for LED Light Tower Growth: Energy efficiency, longer lifespan, and reduced operational costs.
Light Tower Industry Product Developments
Recent product developments focus on enhancing energy efficiency, improving mobility, and integrating smart technologies. LED technology is now standard in most new light towers, while the incorporation of remote monitoring capabilities and automated control systems is gaining popularity. Manufacturers are exploring alternative power sources like solar and hydrogen to reduce reliance on diesel, aligning with global sustainability goals. These developments aim to improve operational efficiency, reduce environmental impact, and provide users with more versatile and cost-effective lighting solutions.
Report Scope & Segmentation Analysis
This report provides a comprehensive analysis of the light tower market, segmented by type (LED Light Tower, Metal Halid Light Tower), type of power source (Solar Powered, Diesel Powered, Hydrogen Fuel Powered, Directly Powered), and end-user industry (Construction, Oil & Gas, Mining, Industrial, Other End-user Industries). Each segment's growth projections, market sizes, and competitive dynamics are analyzed in detail. The forecast period extends to 2033, providing a long-term perspective on market trends and opportunities.
Key Drivers of Light Tower Industry Growth
The key drivers of growth in the light tower industry include increasing infrastructure spending across various sectors, a rise in large-scale construction projects, growing demand from the oil and gas industry, and advancements in lighting technology leading to greater energy efficiency. Furthermore, the rising adoption of sustainable practices in industries and government regulations promoting environmentally friendly technologies are boosting market growth.
Challenges in the Light Tower Industry Sector
The industry faces challenges like fluctuating fuel prices (particularly affecting diesel-powered units), stringent emission regulations leading to higher manufacturing costs, and intense competition from established players and new entrants. Supply chain disruptions can also impact production and delivery timelines, affecting overall market stability.
Emerging Opportunities in Light Tower Industry
Emerging opportunities include the increasing adoption of solar-powered and hydrogen fuel-powered light towers, the integration of smart technologies and IoT capabilities for remote monitoring and control, and the expansion into new and developing markets. These opportunities reflect the industry's shift toward sustainable and technologically advanced solutions.
Leading Players in the Light Tower Industry Market
- Westquip Diesel Sales
- Doosan Portable Power
- Generac Power Systems Inc
- BMI Group
- The Will-Burt Company
- Xylem Inc
- Atlas Copco AB
- Youngman Richardson & Co Ltd
- Wacker Neuson Group
- Wanco Inc
- J C Bamford Excavators Ltd
- Inmesol Gensets SL
- Colorado Standby
- Larson Electronics LLC
- Terex Corporation
Key Developments in Light Tower Industry Industry
- February 2021: Generac Power Systems announced plans to increase its manufacturing capacity and respond to increasing demand for its power backup solutions and other energy technologies by opening a new manufacturing, assembly, and distribution operation in South Carolina, USA. This expansion signifies the growing demand for reliable power solutions, including light towers, and demonstrates the company's commitment to meeting market needs.
Strategic Outlook for Light Tower Industry Market
The light tower industry is poised for continued growth, driven by ongoing infrastructure development, expanding industrial activities, and the adoption of innovative technologies. The increasing emphasis on sustainability and energy efficiency will further fuel the market's expansion, with significant growth anticipated for LED, solar, and hydrogen-powered units. The industry's strategic focus will be on delivering technologically advanced, environmentally friendly, and cost-effective solutions to meet the evolving needs of its diverse customer base.
Light Tower Industry Segmentation
-
1. Type
- 1.1. LED Light Tower
- 1.2. Metal Halid Light Tower
-
2. Type of Power Source
- 2.1. Solar Powered
- 2.2. Diesel Powered
- 2.3. Hydrogen Fuel Powered
- 2.4. Directly Powered
-
3. End-user Industry
- 3.1. Construction
- 3.2. Oil & Gas
- 3.3. Mining
- 3.4. Industrial
- 3.5. Other End-user Industries
Light Tower Industry Segmentation By Geography
- 1. North America
- 2. Europe
- 3. Asia Pacific
- 4. Latin America
- 5. Middle East and Africa
Light Tower Industry REPORT HIGHLIGHTS
| Aspects | Details |
|---|---|
| Study Period | 2019-2033 |
| Base Year | 2024 |
| Estimated Year | 2025 |
| Forecast Period | 2025-2033 |
| Historical Period | 2019-2024 |
| Growth Rate | CAGR of 5.00% from 2019-2033 |
| Segmentation |
|
Table of Contents
- 1. Introduction
- 1.1. Research Scope
- 1.2. Market Segmentation
- 1.3. Research Methodology
- 1.4. Definitions and Assumptions
- 2. Executive Summary
- 2.1. Introduction
- 3. Market Dynamics
- 3.1. Introduction
- 3.2. Market Drivers
- 3.2.1 Investments and Rapid Growth in the Oil and Gas
- 3.2.2 Mining and Construction Sectors; Focus on Reducing Light Tower Emissions
- 3.3. Market Restrains
- 3.3.1. Environmental and Safe Use Concerns
- 3.4. Market Trends
- 3.4.1. LED Light Tower Accounts For the Largest Market Share
- 4. Market Factor Analysis
- 4.1. Porters Five Forces
- 4.2. Supply/Value Chain
- 4.3. PESTEL analysis
- 4.4. Market Entropy
- 4.5. Patent/Trademark Analysis
- 5. Global Light Tower Industry Analysis, Insights and Forecast, 2019-2031
- 5.1. Market Analysis, Insights and Forecast - by Type
- 5.1.1. LED Light Tower
- 5.1.2. Metal Halid Light Tower
- 5.2. Market Analysis, Insights and Forecast - by Type of Power Source
- 5.2.1. Solar Powered
- 5.2.2. Diesel Powered
- 5.2.3. Hydrogen Fuel Powered
- 5.2.4. Directly Powered
- 5.3. Market Analysis, Insights and Forecast - by End-user Industry
- 5.3.1. Construction
- 5.3.2. Oil & Gas
- 5.3.3. Mining
- 5.3.4. Industrial
- 5.3.5. Other End-user Industries
- 5.4. Market Analysis, Insights and Forecast - by Region
- 5.4.1. North America
- 5.4.2. Europe
- 5.4.3. Asia Pacific
- 5.4.4. Latin America
- 5.4.5. Middle East and Africa
- 5.1. Market Analysis, Insights and Forecast - by Type
- 6. North America Light Tower Industry Analysis, Insights and Forecast, 2019-2031
- 6.1. Market Analysis, Insights and Forecast - by Type
- 6.1.1. LED Light Tower
- 6.1.2. Metal Halid Light Tower
- 6.2. Market Analysis, Insights and Forecast - by Type of Power Source
- 6.2.1. Solar Powered
- 6.2.2. Diesel Powered
- 6.2.3. Hydrogen Fuel Powered
- 6.2.4. Directly Powered
- 6.3. Market Analysis, Insights and Forecast - by End-user Industry
- 6.3.1. Construction
- 6.3.2. Oil & Gas
- 6.3.3. Mining
- 6.3.4. Industrial
- 6.3.5. Other End-user Industries
- 6.1. Market Analysis, Insights and Forecast - by Type
- 7. Europe Light Tower Industry Analysis, Insights and Forecast, 2019-2031
- 7.1. Market Analysis, Insights and Forecast - by Type
- 7.1.1. LED Light Tower
- 7.1.2. Metal Halid Light Tower
- 7.2. Market Analysis, Insights and Forecast - by Type of Power Source
- 7.2.1. Solar Powered
- 7.2.2. Diesel Powered
- 7.2.3. Hydrogen Fuel Powered
- 7.2.4. Directly Powered
- 7.3. Market Analysis, Insights and Forecast - by End-user Industry
- 7.3.1. Construction
- 7.3.2. Oil & Gas
- 7.3.3. Mining
- 7.3.4. Industrial
- 7.3.5. Other End-user Industries
- 7.1. Market Analysis, Insights and Forecast - by Type
- 8. Asia Pacific Light Tower Industry Analysis, Insights and Forecast, 2019-2031
- 8.1. Market Analysis, Insights and Forecast - by Type
- 8.1.1. LED Light Tower
- 8.1.2. Metal Halid Light Tower
- 8.2. Market Analysis, Insights and Forecast - by Type of Power Source
- 8.2.1. Solar Powered
- 8.2.2. Diesel Powered
- 8.2.3. Hydrogen Fuel Powered
- 8.2.4. Directly Powered
- 8.3. Market Analysis, Insights and Forecast - by End-user Industry
- 8.3.1. Construction
- 8.3.2. Oil & Gas
- 8.3.3. Mining
- 8.3.4. Industrial
- 8.3.5. Other End-user Industries
- 8.1. Market Analysis, Insights and Forecast - by Type
- 9. Latin America Light Tower Industry Analysis, Insights and Forecast, 2019-2031
- 9.1. Market Analysis, Insights and Forecast - by Type
- 9.1.1. LED Light Tower
- 9.1.2. Metal Halid Light Tower
- 9.2. Market Analysis, Insights and Forecast - by Type of Power Source
- 9.2.1. Solar Powered
- 9.2.2. Diesel Powered
- 9.2.3. Hydrogen Fuel Powered
- 9.2.4. Directly Powered
- 9.3. Market Analysis, Insights and Forecast - by End-user Industry
- 9.3.1. Construction
- 9.3.2. Oil & Gas
- 9.3.3. Mining
- 9.3.4. Industrial
- 9.3.5. Other End-user Industries
- 9.1. Market Analysis, Insights and Forecast - by Type
- 10. Middle East and Africa Light Tower Industry Analysis, Insights and Forecast, 2019-2031
- 10.1. Market Analysis, Insights and Forecast - by Type
- 10.1.1. LED Light Tower
- 10.1.2. Metal Halid Light Tower
- 10.2. Market Analysis, Insights and Forecast - by Type of Power Source
- 10.2.1. Solar Powered
- 10.2.2. Diesel Powered
- 10.2.3. Hydrogen Fuel Powered
- 10.2.4. Directly Powered
- 10.3. Market Analysis, Insights and Forecast - by End-user Industry
- 10.3.1. Construction
- 10.3.2. Oil & Gas
- 10.3.3. Mining
- 10.3.4. Industrial
- 10.3.5. Other End-user Industries
- 10.1. Market Analysis, Insights and Forecast - by Type
- 11. North America Light Tower Industry Analysis, Insights and Forecast, 2019-2031
- 11.1. Market Analysis, Insights and Forecast - By Country/Sub-region
- 11.1.1 United States
- 11.1.2 Canada
- 11.1.3 Mexico
- 12. Europe Light Tower Industry Analysis, Insights and Forecast, 2019-2031
- 12.1. Market Analysis, Insights and Forecast - By Country/Sub-region
- 12.1.1 Germany
- 12.1.2 United Kingdom
- 12.1.3 France
- 12.1.4 Spain
- 12.1.5 Italy
- 12.1.6 Spain
- 12.1.7 Belgium
- 12.1.8 Netherland
- 12.1.9 Nordics
- 12.1.10 Rest of Europe
- 13. Asia Pacific Light Tower Industry Analysis, Insights and Forecast, 2019-2031
- 13.1. Market Analysis, Insights and Forecast - By Country/Sub-region
- 13.1.1 China
- 13.1.2 Japan
- 13.1.3 India
- 13.1.4 South Korea
- 13.1.5 Southeast Asia
- 13.1.6 Australia
- 13.1.7 Indonesia
- 13.1.8 Phillipes
- 13.1.9 Singapore
- 13.1.10 Thailandc
- 13.1.11 Rest of Asia Pacific
- 14. South America Light Tower Industry Analysis, Insights and Forecast, 2019-2031
- 14.1. Market Analysis, Insights and Forecast - By Country/Sub-region
- 14.1.1 Brazil
- 14.1.2 Argentina
- 14.1.3 Peru
- 14.1.4 Chile
- 14.1.5 Colombia
- 14.1.6 Ecuador
- 14.1.7 Venezuela
- 14.1.8 Rest of South America
- 15. North America Light Tower Industry Analysis, Insights and Forecast, 2019-2031
- 15.1. Market Analysis, Insights and Forecast - By Country/Sub-region
- 15.1.1 United States
- 15.1.2 Canada
- 15.1.3 Mexico
- 16. MEA Light Tower Industry Analysis, Insights and Forecast, 2019-2031
- 16.1. Market Analysis, Insights and Forecast - By Country/Sub-region
- 16.1.1 United Arab Emirates
- 16.1.2 Saudi Arabia
- 16.1.3 South Africa
- 16.1.4 Rest of Middle East and Africa
- 17. Competitive Analysis
- 17.1. Global Market Share Analysis 2024
- 17.2. Company Profiles
- 17.2.1 Westquip Diesel Sales
- 17.2.1.1. Overview
- 17.2.1.2. Products
- 17.2.1.3. SWOT Analysis
- 17.2.1.4. Recent Developments
- 17.2.1.5. Financials (Based on Availability)
- 17.2.2 Doosan Portable Power
- 17.2.2.1. Overview
- 17.2.2.2. Products
- 17.2.2.3. SWOT Analysis
- 17.2.2.4. Recent Developments
- 17.2.2.5. Financials (Based on Availability)
- 17.2.3 Generac Power Systems Inc
- 17.2.3.1. Overview
- 17.2.3.2. Products
- 17.2.3.3. SWOT Analysis
- 17.2.3.4. Recent Developments
- 17.2.3.5. Financials (Based on Availability)
- 17.2.4 BMI Group
- 17.2.4.1. Overview
- 17.2.4.2. Products
- 17.2.4.3. SWOT Analysis
- 17.2.4.4. Recent Developments
- 17.2.4.5. Financials (Based on Availability)
- 17.2.5 The Will-Burt Company
- 17.2.5.1. Overview
- 17.2.5.2. Products
- 17.2.5.3. SWOT Analysis
- 17.2.5.4. Recent Developments
- 17.2.5.5. Financials (Based on Availability)
- 17.2.6 Xylem Inc
- 17.2.6.1. Overview
- 17.2.6.2. Products
- 17.2.6.3. SWOT Analysis
- 17.2.6.4. Recent Developments
- 17.2.6.5. Financials (Based on Availability)
- 17.2.7 Atlas Copco AB
- 17.2.7.1. Overview
- 17.2.7.2. Products
- 17.2.7.3. SWOT Analysis
- 17.2.7.4. Recent Developments
- 17.2.7.5. Financials (Based on Availability)
- 17.2.8 Youngman Richardson & Co Ltd
- 17.2.8.1. Overview
- 17.2.8.2. Products
- 17.2.8.3. SWOT Analysis
- 17.2.8.4. Recent Developments
- 17.2.8.5. Financials (Based on Availability)
- 17.2.9 Wacker Neuson Group
- 17.2.9.1. Overview
- 17.2.9.2. Products
- 17.2.9.3. SWOT Analysis
- 17.2.9.4. Recent Developments
- 17.2.9.5. Financials (Based on Availability)
- 17.2.10 Wanco Inc
- 17.2.10.1. Overview
- 17.2.10.2. Products
- 17.2.10.3. SWOT Analysis
- 17.2.10.4. Recent Developments
- 17.2.10.5. Financials (Based on Availability)
- 17.2.11 J C Bamford Excavators Ltd
- 17.2.11.1. Overview
- 17.2.11.2. Products
- 17.2.11.3. SWOT Analysis
- 17.2.11.4. Recent Developments
- 17.2.11.5. Financials (Based on Availability)
- 17.2.12 Inmesol Gensets SL
- 17.2.12.1. Overview
- 17.2.12.2. Products
- 17.2.12.3. SWOT Analysis
- 17.2.12.4. Recent Developments
- 17.2.12.5. Financials (Based on Availability)
- 17.2.13 Colorado Standby
- 17.2.13.1. Overview
- 17.2.13.2. Products
- 17.2.13.3. SWOT Analysis
- 17.2.13.4. Recent Developments
- 17.2.13.5. Financials (Based on Availability)
- 17.2.14 Larson Electronics LLC
- 17.2.14.1. Overview
- 17.2.14.2. Products
- 17.2.14.3. SWOT Analysis
- 17.2.14.4. Recent Developments
- 17.2.14.5. Financials (Based on Availability)
- 17.2.15 Terex Corporation
- 17.2.15.1. Overview
- 17.2.15.2. Products
- 17.2.15.3. SWOT Analysis
- 17.2.15.4. Recent Developments
- 17.2.15.5. Financials (Based on Availability)
- 17.2.1 Westquip Diesel Sales
List of Figures
- Figure 1: Global Light Tower Industry Revenue Breakdown (Million, %) by Region 2024 & 2032
- Figure 2: Global Light Tower Industry Volume Breakdown (K Unit, %) by Region 2024 & 2032
- Figure 3: North America Light Tower Industry Revenue (Million), by Country 2024 & 2032
- Figure 4: North America Light Tower Industry Volume (K Unit), by Country 2024 & 2032
- Figure 5: North America Light Tower Industry Revenue Share (%), by Country 2024 & 2032
- Figure 6: North America Light Tower Industry Volume Share (%), by Country 2024 & 2032
- Figure 7: Europe Light Tower Industry Revenue (Million), by Country 2024 & 2032
- Figure 8: Europe Light Tower Industry Volume (K Unit), by Country 2024 & 2032
- Figure 9: Europe Light Tower Industry Revenue Share (%), by Country 2024 & 2032
- Figure 10: Europe Light Tower Industry Volume Share (%), by Country 2024 & 2032
- Figure 11: Asia Pacific Light Tower Industry Revenue (Million), by Country 2024 & 2032
- Figure 12: Asia Pacific Light Tower Industry Volume (K Unit), by Country 2024 & 2032
- Figure 13: Asia Pacific Light Tower Industry Revenue Share (%), by Country 2024 & 2032
- Figure 14: Asia Pacific Light Tower Industry Volume Share (%), by Country 2024 & 2032
- Figure 15: South America Light Tower Industry Revenue (Million), by Country 2024 & 2032
- Figure 16: South America Light Tower Industry Volume (K Unit), by Country 2024 & 2032
- Figure 17: South America Light Tower Industry Revenue Share (%), by Country 2024 & 2032
- Figure 18: South America Light Tower Industry Volume Share (%), by Country 2024 & 2032
- Figure 19: North America Light Tower Industry Revenue (Million), by Country 2024 & 2032
- Figure 20: North America Light Tower Industry Volume (K Unit), by Country 2024 & 2032
- Figure 21: North America Light Tower Industry Revenue Share (%), by Country 2024 & 2032
- Figure 22: North America Light Tower Industry Volume Share (%), by Country 2024 & 2032
- Figure 23: MEA Light Tower Industry Revenue (Million), by Country 2024 & 2032
- Figure 24: MEA Light Tower Industry Volume (K Unit), by Country 2024 & 2032
- Figure 25: MEA Light Tower Industry Revenue Share (%), by Country 2024 & 2032
- Figure 26: MEA Light Tower Industry Volume Share (%), by Country 2024 & 2032
- Figure 27: North America Light Tower Industry Revenue (Million), by Type 2024 & 2032
- Figure 28: North America Light Tower Industry Volume (K Unit), by Type 2024 & 2032
- Figure 29: North America Light Tower Industry Revenue Share (%), by Type 2024 & 2032
- Figure 30: North America Light Tower Industry Volume Share (%), by Type 2024 & 2032
- Figure 31: North America Light Tower Industry Revenue (Million), by Type of Power Source 2024 & 2032
- Figure 32: North America Light Tower Industry Volume (K Unit), by Type of Power Source 2024 & 2032
- Figure 33: North America Light Tower Industry Revenue Share (%), by Type of Power Source 2024 & 2032
- Figure 34: North America Light Tower Industry Volume Share (%), by Type of Power Source 2024 & 2032
- Figure 35: North America Light Tower Industry Revenue (Million), by End-user Industry 2024 & 2032
- Figure 36: North America Light Tower Industry Volume (K Unit), by End-user Industry 2024 & 2032
- Figure 37: North America Light Tower Industry Revenue Share (%), by End-user Industry 2024 & 2032
- Figure 38: North America Light Tower Industry Volume Share (%), by End-user Industry 2024 & 2032
- Figure 39: North America Light Tower Industry Revenue (Million), by Country 2024 & 2032
- Figure 40: North America Light Tower Industry Volume (K Unit), by Country 2024 & 2032
- Figure 41: North America Light Tower Industry Revenue Share (%), by Country 2024 & 2032
- Figure 42: North America Light Tower Industry Volume Share (%), by Country 2024 & 2032
- Figure 43: Europe Light Tower Industry Revenue (Million), by Type 2024 & 2032
- Figure 44: Europe Light Tower Industry Volume (K Unit), by Type 2024 & 2032
- Figure 45: Europe Light Tower Industry Revenue Share (%), by Type 2024 & 2032
- Figure 46: Europe Light Tower Industry Volume Share (%), by Type 2024 & 2032
- Figure 47: Europe Light Tower Industry Revenue (Million), by Type of Power Source 2024 & 2032
- Figure 48: Europe Light Tower Industry Volume (K Unit), by Type of Power Source 2024 & 2032
- Figure 49: Europe Light Tower Industry Revenue Share (%), by Type of Power Source 2024 & 2032
- Figure 50: Europe Light Tower Industry Volume Share (%), by Type of Power Source 2024 & 2032
- Figure 51: Europe Light Tower Industry Revenue (Million), by End-user Industry 2024 & 2032
- Figure 52: Europe Light Tower Industry Volume (K Unit), by End-user Industry 2024 & 2032
- Figure 53: Europe Light Tower Industry Revenue Share (%), by End-user Industry 2024 & 2032
- Figure 54: Europe Light Tower Industry Volume Share (%), by End-user Industry 2024 & 2032
- Figure 55: Europe Light Tower Industry Revenue (Million), by Country 2024 & 2032
- Figure 56: Europe Light Tower Industry Volume (K Unit), by Country 2024 & 2032
- Figure 57: Europe Light Tower Industry Revenue Share (%), by Country 2024 & 2032
- Figure 58: Europe Light Tower Industry Volume Share (%), by Country 2024 & 2032
- Figure 59: Asia Pacific Light Tower Industry Revenue (Million), by Type 2024 & 2032
- Figure 60: Asia Pacific Light Tower Industry Volume (K Unit), by Type 2024 & 2032
- Figure 61: Asia Pacific Light Tower Industry Revenue Share (%), by Type 2024 & 2032
- Figure 62: Asia Pacific Light Tower Industry Volume Share (%), by Type 2024 & 2032
- Figure 63: Asia Pacific Light Tower Industry Revenue (Million), by Type of Power Source 2024 & 2032
- Figure 64: Asia Pacific Light Tower Industry Volume (K Unit), by Type of Power Source 2024 & 2032
- Figure 65: Asia Pacific Light Tower Industry Revenue Share (%), by Type of Power Source 2024 & 2032
- Figure 66: Asia Pacific Light Tower Industry Volume Share (%), by Type of Power Source 2024 & 2032
- Figure 67: Asia Pacific Light Tower Industry Revenue (Million), by End-user Industry 2024 & 2032
- Figure 68: Asia Pacific Light Tower Industry Volume (K Unit), by End-user Industry 2024 & 2032
- Figure 69: Asia Pacific Light Tower Industry Revenue Share (%), by End-user Industry 2024 & 2032
- Figure 70: Asia Pacific Light Tower Industry Volume Share (%), by End-user Industry 2024 & 2032
- Figure 71: Asia Pacific Light Tower Industry Revenue (Million), by Country 2024 & 2032
- Figure 72: Asia Pacific Light Tower Industry Volume (K Unit), by Country 2024 & 2032
- Figure 73: Asia Pacific Light Tower Industry Revenue Share (%), by Country 2024 & 2032
- Figure 74: Asia Pacific Light Tower Industry Volume Share (%), by Country 2024 & 2032
- Figure 75: Latin America Light Tower Industry Revenue (Million), by Type 2024 & 2032
- Figure 76: Latin America Light Tower Industry Volume (K Unit), by Type 2024 & 2032
- Figure 77: Latin America Light Tower Industry Revenue Share (%), by Type 2024 & 2032
- Figure 78: Latin America Light Tower Industry Volume Share (%), by Type 2024 & 2032
- Figure 79: Latin America Light Tower Industry Revenue (Million), by Type of Power Source 2024 & 2032
- Figure 80: Latin America Light Tower Industry Volume (K Unit), by Type of Power Source 2024 & 2032
- Figure 81: Latin America Light Tower Industry Revenue Share (%), by Type of Power Source 2024 & 2032
- Figure 82: Latin America Light Tower Industry Volume Share (%), by Type of Power Source 2024 & 2032
- Figure 83: Latin America Light Tower Industry Revenue (Million), by End-user Industry 2024 & 2032
- Figure 84: Latin America Light Tower Industry Volume (K Unit), by End-user Industry 2024 & 2032
- Figure 85: Latin America Light Tower Industry Revenue Share (%), by End-user Industry 2024 & 2032
- Figure 86: Latin America Light Tower Industry Volume Share (%), by End-user Industry 2024 & 2032
- Figure 87: Latin America Light Tower Industry Revenue (Million), by Country 2024 & 2032
- Figure 88: Latin America Light Tower Industry Volume (K Unit), by Country 2024 & 2032
- Figure 89: Latin America Light Tower Industry Revenue Share (%), by Country 2024 & 2032
- Figure 90: Latin America Light Tower Industry Volume Share (%), by Country 2024 & 2032
- Figure 91: Middle East and Africa Light Tower Industry Revenue (Million), by Type 2024 & 2032
- Figure 92: Middle East and Africa Light Tower Industry Volume (K Unit), by Type 2024 & 2032
- Figure 93: Middle East and Africa Light Tower Industry Revenue Share (%), by Type 2024 & 2032
- Figure 94: Middle East and Africa Light Tower Industry Volume Share (%), by Type 2024 & 2032
- Figure 95: Middle East and Africa Light Tower Industry Revenue (Million), by Type of Power Source 2024 & 2032
- Figure 96: Middle East and Africa Light Tower Industry Volume (K Unit), by Type of Power Source 2024 & 2032
- Figure 97: Middle East and Africa Light Tower Industry Revenue Share (%), by Type of Power Source 2024 & 2032
- Figure 98: Middle East and Africa Light Tower Industry Volume Share (%), by Type of Power Source 2024 & 2032
- Figure 99: Middle East and Africa Light Tower Industry Revenue (Million), by End-user Industry 2024 & 2032
- Figure 100: Middle East and Africa Light Tower Industry Volume (K Unit), by End-user Industry 2024 & 2032
- Figure 101: Middle East and Africa Light Tower Industry Revenue Share (%), by End-user Industry 2024 & 2032
- Figure 102: Middle East and Africa Light Tower Industry Volume Share (%), by End-user Industry 2024 & 2032
- Figure 103: Middle East and Africa Light Tower Industry Revenue (Million), by Country 2024 & 2032
- Figure 104: Middle East and Africa Light Tower Industry Volume (K Unit), by Country 2024 & 2032
- Figure 105: Middle East and Africa Light Tower Industry Revenue Share (%), by Country 2024 & 2032
- Figure 106: Middle East and Africa Light Tower Industry Volume Share (%), by Country 2024 & 2032
List of Tables
- Table 1: Global Light Tower Industry Revenue Million Forecast, by Region 2019 & 2032
- Table 2: Global Light Tower Industry Volume K Unit Forecast, by Region 2019 & 2032
- Table 3: Global Light Tower Industry Revenue Million Forecast, by Type 2019 & 2032
- Table 4: Global Light Tower Industry Volume K Unit Forecast, by Type 2019 & 2032
- Table 5: Global Light Tower Industry Revenue Million Forecast, by Type of Power Source 2019 & 2032
- Table 6: Global Light Tower Industry Volume K Unit Forecast, by Type of Power Source 2019 & 2032
- Table 7: Global Light Tower Industry Revenue Million Forecast, by End-user Industry 2019 & 2032
- Table 8: Global Light Tower Industry Volume K Unit Forecast, by End-user Industry 2019 & 2032
- Table 9: Global Light Tower Industry Revenue Million Forecast, by Region 2019 & 2032
- Table 10: Global Light Tower Industry Volume K Unit Forecast, by Region 2019 & 2032
- Table 11: Global Light Tower Industry Revenue Million Forecast, by Country 2019 & 2032
- Table 12: Global Light Tower Industry Volume K Unit Forecast, by Country 2019 & 2032
- Table 13: United States Light Tower Industry Revenue (Million) Forecast, by Application 2019 & 2032
- Table 14: United States Light Tower Industry Volume (K Unit) Forecast, by Application 2019 & 2032
- Table 15: Canada Light Tower Industry Revenue (Million) Forecast, by Application 2019 & 2032
- Table 16: Canada Light Tower Industry Volume (K Unit) Forecast, by Application 2019 & 2032
- Table 17: Mexico Light Tower Industry Revenue (Million) Forecast, by Application 2019 & 2032
- Table 18: Mexico Light Tower Industry Volume (K Unit) Forecast, by Application 2019 & 2032
- Table 19: Global Light Tower Industry Revenue Million Forecast, by Country 2019 & 2032
- Table 20: Global Light Tower Industry Volume K Unit Forecast, by Country 2019 & 2032
- Table 21: Germany Light Tower Industry Revenue (Million) Forecast, by Application 2019 & 2032
- Table 22: Germany Light Tower Industry Volume (K Unit) Forecast, by Application 2019 & 2032
- Table 23: United Kingdom Light Tower Industry Revenue (Million) Forecast, by Application 2019 & 2032
- Table 24: United Kingdom Light Tower Industry Volume (K Unit) Forecast, by Application 2019 & 2032
- Table 25: France Light Tower Industry Revenue (Million) Forecast, by Application 2019 & 2032
- Table 26: France Light Tower Industry Volume (K Unit) Forecast, by Application 2019 & 2032
- Table 27: Spain Light Tower Industry Revenue (Million) Forecast, by Application 2019 & 2032
- Table 28: Spain Light Tower Industry Volume (K Unit) Forecast, by Application 2019 & 2032
- Table 29: Italy Light Tower Industry Revenue (Million) Forecast, by Application 2019 & 2032
- Table 30: Italy Light Tower Industry Volume (K Unit) Forecast, by Application 2019 & 2032
- Table 31: Spain Light Tower Industry Revenue (Million) Forecast, by Application 2019 & 2032
- Table 32: Spain Light Tower Industry Volume (K Unit) Forecast, by Application 2019 & 2032
- Table 33: Belgium Light Tower Industry Revenue (Million) Forecast, by Application 2019 & 2032
- Table 34: Belgium Light Tower Industry Volume (K Unit) Forecast, by Application 2019 & 2032
- Table 35: Netherland Light Tower Industry Revenue (Million) Forecast, by Application 2019 & 2032
- Table 36: Netherland Light Tower Industry Volume (K Unit) Forecast, by Application 2019 & 2032
- Table 37: Nordics Light Tower Industry Revenue (Million) Forecast, by Application 2019 & 2032
- Table 38: Nordics Light Tower Industry Volume (K Unit) Forecast, by Application 2019 & 2032
- Table 39: Rest of Europe Light Tower Industry Revenue (Million) Forecast, by Application 2019 & 2032
- Table 40: Rest of Europe Light Tower Industry Volume (K Unit) Forecast, by Application 2019 & 2032
- Table 41: Global Light Tower Industry Revenue Million Forecast, by Country 2019 & 2032
- Table 42: Global Light Tower Industry Volume K Unit Forecast, by Country 2019 & 2032
- Table 43: China Light Tower Industry Revenue (Million) Forecast, by Application 2019 & 2032
- Table 44: China Light Tower Industry Volume (K Unit) Forecast, by Application 2019 & 2032
- Table 45: Japan Light Tower Industry Revenue (Million) Forecast, by Application 2019 & 2032
- Table 46: Japan Light Tower Industry Volume (K Unit) Forecast, by Application 2019 & 2032
- Table 47: India Light Tower Industry Revenue (Million) Forecast, by Application 2019 & 2032
- Table 48: India Light Tower Industry Volume (K Unit) Forecast, by Application 2019 & 2032
- Table 49: South Korea Light Tower Industry Revenue (Million) Forecast, by Application 2019 & 2032
- Table 50: South Korea Light Tower Industry Volume (K Unit) Forecast, by Application 2019 & 2032
- Table 51: Southeast Asia Light Tower Industry Revenue (Million) Forecast, by Application 2019 & 2032
- Table 52: Southeast Asia Light Tower Industry Volume (K Unit) Forecast, by Application 2019 & 2032
- Table 53: Australia Light Tower Industry Revenue (Million) Forecast, by Application 2019 & 2032
- Table 54: Australia Light Tower Industry Volume (K Unit) Forecast, by Application 2019 & 2032
- Table 55: Indonesia Light Tower Industry Revenue (Million) Forecast, by Application 2019 & 2032
- Table 56: Indonesia Light Tower Industry Volume (K Unit) Forecast, by Application 2019 & 2032
- Table 57: Phillipes Light Tower Industry Revenue (Million) Forecast, by Application 2019 & 2032
- Table 58: Phillipes Light Tower Industry Volume (K Unit) Forecast, by Application 2019 & 2032
- Table 59: Singapore Light Tower Industry Revenue (Million) Forecast, by Application 2019 & 2032
- Table 60: Singapore Light Tower Industry Volume (K Unit) Forecast, by Application 2019 & 2032
- Table 61: Thailandc Light Tower Industry Revenue (Million) Forecast, by Application 2019 & 2032
- Table 62: Thailandc Light Tower Industry Volume (K Unit) Forecast, by Application 2019 & 2032
- Table 63: Rest of Asia Pacific Light Tower Industry Revenue (Million) Forecast, by Application 2019 & 2032
- Table 64: Rest of Asia Pacific Light Tower Industry Volume (K Unit) Forecast, by Application 2019 & 2032
- Table 65: Global Light Tower Industry Revenue Million Forecast, by Country 2019 & 2032
- Table 66: Global Light Tower Industry Volume K Unit Forecast, by Country 2019 & 2032
- Table 67: Brazil Light Tower Industry Revenue (Million) Forecast, by Application 2019 & 2032
- Table 68: Brazil Light Tower Industry Volume (K Unit) Forecast, by Application 2019 & 2032
- Table 69: Argentina Light Tower Industry Revenue (Million) Forecast, by Application 2019 & 2032
- Table 70: Argentina Light Tower Industry Volume (K Unit) Forecast, by Application 2019 & 2032
- Table 71: Peru Light Tower Industry Revenue (Million) Forecast, by Application 2019 & 2032
- Table 72: Peru Light Tower Industry Volume (K Unit) Forecast, by Application 2019 & 2032
- Table 73: Chile Light Tower Industry Revenue (Million) Forecast, by Application 2019 & 2032
- Table 74: Chile Light Tower Industry Volume (K Unit) Forecast, by Application 2019 & 2032
- Table 75: Colombia Light Tower Industry Revenue (Million) Forecast, by Application 2019 & 2032
- Table 76: Colombia Light Tower Industry Volume (K Unit) Forecast, by Application 2019 & 2032
- Table 77: Ecuador Light Tower Industry Revenue (Million) Forecast, by Application 2019 & 2032
- Table 78: Ecuador Light Tower Industry Volume (K Unit) Forecast, by Application 2019 & 2032
- Table 79: Venezuela Light Tower Industry Revenue (Million) Forecast, by Application 2019 & 2032
- Table 80: Venezuela Light Tower Industry Volume (K Unit) Forecast, by Application 2019 & 2032
- Table 81: Rest of South America Light Tower Industry Revenue (Million) Forecast, by Application 2019 & 2032
- Table 82: Rest of South America Light Tower Industry Volume (K Unit) Forecast, by Application 2019 & 2032
- Table 83: Global Light Tower Industry Revenue Million Forecast, by Country 2019 & 2032
- Table 84: Global Light Tower Industry Volume K Unit Forecast, by Country 2019 & 2032
- Table 85: United States Light Tower Industry Revenue (Million) Forecast, by Application 2019 & 2032
- Table 86: United States Light Tower Industry Volume (K Unit) Forecast, by Application 2019 & 2032
- Table 87: Canada Light Tower Industry Revenue (Million) Forecast, by Application 2019 & 2032
- Table 88: Canada Light Tower Industry Volume (K Unit) Forecast, by Application 2019 & 2032
- Table 89: Mexico Light Tower Industry Revenue (Million) Forecast, by Application 2019 & 2032
- Table 90: Mexico Light Tower Industry Volume (K Unit) Forecast, by Application 2019 & 2032
- Table 91: Global Light Tower Industry Revenue Million Forecast, by Country 2019 & 2032
- Table 92: Global Light Tower Industry Volume K Unit Forecast, by Country 2019 & 2032
- Table 93: United Arab Emirates Light Tower Industry Revenue (Million) Forecast, by Application 2019 & 2032
- Table 94: United Arab Emirates Light Tower Industry Volume (K Unit) Forecast, by Application 2019 & 2032
- Table 95: Saudi Arabia Light Tower Industry Revenue (Million) Forecast, by Application 2019 & 2032
- Table 96: Saudi Arabia Light Tower Industry Volume (K Unit) Forecast, by Application 2019 & 2032
- Table 97: South Africa Light Tower Industry Revenue (Million) Forecast, by Application 2019 & 2032
- Table 98: South Africa Light Tower Industry Volume (K Unit) Forecast, by Application 2019 & 2032
- Table 99: Rest of Middle East and Africa Light Tower Industry Revenue (Million) Forecast, by Application 2019 & 2032
- Table 100: Rest of Middle East and Africa Light Tower Industry Volume (K Unit) Forecast, by Application 2019 & 2032
- Table 101: Global Light Tower Industry Revenue Million Forecast, by Type 2019 & 2032
- Table 102: Global Light Tower Industry Volume K Unit Forecast, by Type 2019 & 2032
- Table 103: Global Light Tower Industry Revenue Million Forecast, by Type of Power Source 2019 & 2032
- Table 104: Global Light Tower Industry Volume K Unit Forecast, by Type of Power Source 2019 & 2032
- Table 105: Global Light Tower Industry Revenue Million Forecast, by End-user Industry 2019 & 2032
- Table 106: Global Light Tower Industry Volume K Unit Forecast, by End-user Industry 2019 & 2032
- Table 107: Global Light Tower Industry Revenue Million Forecast, by Country 2019 & 2032
- Table 108: Global Light Tower Industry Volume K Unit Forecast, by Country 2019 & 2032
- Table 109: Global Light Tower Industry Revenue Million Forecast, by Type 2019 & 2032
- Table 110: Global Light Tower Industry Volume K Unit Forecast, by Type 2019 & 2032
- Table 111: Global Light Tower Industry Revenue Million Forecast, by Type of Power Source 2019 & 2032
- Table 112: Global Light Tower Industry Volume K Unit Forecast, by Type of Power Source 2019 & 2032
- Table 113: Global Light Tower Industry Revenue Million Forecast, by End-user Industry 2019 & 2032
- Table 114: Global Light Tower Industry Volume K Unit Forecast, by End-user Industry 2019 & 2032
- Table 115: Global Light Tower Industry Revenue Million Forecast, by Country 2019 & 2032
- Table 116: Global Light Tower Industry Volume K Unit Forecast, by Country 2019 & 2032
- Table 117: Global Light Tower Industry Revenue Million Forecast, by Type 2019 & 2032
- Table 118: Global Light Tower Industry Volume K Unit Forecast, by Type 2019 & 2032
- Table 119: Global Light Tower Industry Revenue Million Forecast, by Type of Power Source 2019 & 2032
- Table 120: Global Light Tower Industry Volume K Unit Forecast, by Type of Power Source 2019 & 2032
- Table 121: Global Light Tower Industry Revenue Million Forecast, by End-user Industry 2019 & 2032
- Table 122: Global Light Tower Industry Volume K Unit Forecast, by End-user Industry 2019 & 2032
- Table 123: Global Light Tower Industry Revenue Million Forecast, by Country 2019 & 2032
- Table 124: Global Light Tower Industry Volume K Unit Forecast, by Country 2019 & 2032
- Table 125: Global Light Tower Industry Revenue Million Forecast, by Type 2019 & 2032
- Table 126: Global Light Tower Industry Volume K Unit Forecast, by Type 2019 & 2032
- Table 127: Global Light Tower Industry Revenue Million Forecast, by Type of Power Source 2019 & 2032
- Table 128: Global Light Tower Industry Volume K Unit Forecast, by Type of Power Source 2019 & 2032
- Table 129: Global Light Tower Industry Revenue Million Forecast, by End-user Industry 2019 & 2032
- Table 130: Global Light Tower Industry Volume K Unit Forecast, by End-user Industry 2019 & 2032
- Table 131: Global Light Tower Industry Revenue Million Forecast, by Country 2019 & 2032
- Table 132: Global Light Tower Industry Volume K Unit Forecast, by Country 2019 & 2032
- Table 133: Global Light Tower Industry Revenue Million Forecast, by Type 2019 & 2032
- Table 134: Global Light Tower Industry Volume K Unit Forecast, by Type 2019 & 2032
- Table 135: Global Light Tower Industry Revenue Million Forecast, by Type of Power Source 2019 & 2032
- Table 136: Global Light Tower Industry Volume K Unit Forecast, by Type of Power Source 2019 & 2032
- Table 137: Global Light Tower Industry Revenue Million Forecast, by End-user Industry 2019 & 2032
- Table 138: Global Light Tower Industry Volume K Unit Forecast, by End-user Industry 2019 & 2032
- Table 139: Global Light Tower Industry Revenue Million Forecast, by Country 2019 & 2032
- Table 140: Global Light Tower Industry Volume K Unit Forecast, by Country 2019 & 2032
Frequently Asked Questions
1. What is the projected Compound Annual Growth Rate (CAGR) of the Light Tower Industry?
The projected CAGR is approximately 5.00%.
2. Which companies are prominent players in the Light Tower Industry?
Key companies in the market include Westquip Diesel Sales, Doosan Portable Power, Generac Power Systems Inc, BMI Group, The Will-Burt Company, Xylem Inc, Atlas Copco AB, Youngman Richardson & Co Ltd, Wacker Neuson Group, Wanco Inc, J C Bamford Excavators Ltd, Inmesol Gensets SL, Colorado Standby, Larson Electronics LLC, Terex Corporation.
3. What are the main segments of the Light Tower Industry?
The market segments include Type, Type of Power Source, End-user Industry.
4. Can you provide details about the market size?
The market size is estimated to be USD XX Million as of 2022.
5. What are some drivers contributing to market growth?
Investments and Rapid Growth in the Oil and Gas. Mining and Construction Sectors; Focus on Reducing Light Tower Emissions.
6. What are the notable trends driving market growth?
LED Light Tower Accounts For the Largest Market Share.
7. Are there any restraints impacting market growth?
Environmental and Safe Use Concerns.
8. Can you provide examples of recent developments in the market?
February 2021 - Generac Power Systems announced its plans to increase its manufacturing capacity and respond to increasing demand for its power backup solutions and other energy technologies by opening new manufacturing, assembly, and distribution operation in South Carolina, USA.
9. What pricing options are available for accessing the report?
Pricing options include single-user, multi-user, and enterprise licenses priced at USD 4750, USD 5250, and USD 8750 respectively.
10. Is the market size provided in terms of value or volume?
The market size is provided in terms of value, measured in Million and volume, measured in K Unit.
11. Are there any specific market keywords associated with the report?
Yes, the market keyword associated with the report is "Light Tower Industry," which aids in identifying and referencing the specific market segment covered.
12. How do I determine which pricing option suits my needs best?
The pricing options vary based on user requirements and access needs. Individual users may opt for single-user licenses, while businesses requiring broader access may choose multi-user or enterprise licenses for cost-effective access to the report.
13. Are there any additional resources or data provided in the Light Tower Industry report?
While the report offers comprehensive insights, it's advisable to review the specific contents or supplementary materials provided to ascertain if additional resources or data are available.
14. How can I stay updated on further developments or reports in the Light Tower Industry?
To stay informed about further developments, trends, and reports in the Light Tower Industry, consider subscribing to industry newsletters, following relevant companies and organizations, or regularly checking reputable industry news sources and publications.
Methodology
Step 1 - Identification of Relevant Samples Size from Population Database


Step 2 - Approaches for Defining Global Market Size (Value, Volume* & Price*)

Note*: In applicable scenarios
Step 3 - Data Sources
Primary Research
- Web Analytics
- Survey Reports
- Research Institute
- Latest Research Reports
- Opinion Leaders
Secondary Research
- Annual Reports
- White Paper
- Latest Press Release
- Industry Association
- Paid Database
- Investor Presentations

Step 4 - Data Triangulation
Involves using different sources of information in order to increase the validity of a study
These sources are likely to be stakeholders in a program - participants, other researchers, program staff, other community members, and so on.
Then we put all data in single framework & apply various statistical tools to find out the dynamic on the market.
During the analysis stage, feedback from the stakeholder groups would be compared to determine areas of agreement as well as areas of divergence


